AWS Cloud Operations Blog
Manage Amazon EC2 instance clock accuracy using Amazon Time Sync Service and Amazon CloudWatch – Part 2
In part 1 of this series, I cover important concepts about measuring the accuracy of time on Amazon EC2 instances . I discussed calculating ClockErrorBound (?) and using its value as a range between which system time is accurate. In this part, I walk through the process of using Amazon CloudWatch to measure and monitor system time accuracy via an example exercise.
Measuring and monitoring system time
The following exercise walks you through the steps to measure and monitor time on your EC2 instances.
Prerequisites
- Account permissions to install packages on two EC2 instances.
- Account permissions to create custom metrics and alerts in CloudWatch.
- An Amazon Simple Notification Service (Amazon SNS) topic configured to deliver notifications.
- EC2 instance with AWS CLI configured with appropriate credentials.
The following example works on EC2 instances running Amazon Linux. You might need changes for your OS.
Step 1. Install chrony on an EC2 instance
A flexible implementation of NTP, chrony is a replacement for the Network Time Protocol (NTP) included in most Linux distributions. On Amazon Linux 2, the default configuration uses chrony and is configured to use the Amazon Time Sync Service.
If you are not using it already, start by replacing NTP on your EC2 Linux instance with chrony.
sudo yum erase ntp*
sudo yum -y install chrony
sudo service chronyd start
The instance now uses chronyd to sync local time with the Amazon Time Sync Service available at 169.254.169.123.
Run the following command to configure your instance to start the chrony service as part of the boot sequence.
sudo chkconfig chronyd on
By default, chrony polls the NTP servers every 32 to 1,024 seconds. To improve the clock accuracy on your instance, we recommend that you change the polling internal to 16 seconds. To do this, edit the chrony configuration file (/etc/chrony.conf) on your instance and add the following line:
server 169.254.169.123 prefer iburst minpoll 4 maxpoll 4
Amazon Time Sync service is available at the 169.254.169.123 IP address for any instance running in an Amazon Virtual Private Cloud (Amazon VPC).
The minpoll and maxpoll parameters configure the minimum and maximum time interval for polling. The values for this parameter are the number of seconds as a power of two. In this case, the parameter is set to 4 (2^4) and this sets the minimum and maximum polling time interval to 16 seconds. A lower and appropriate frequency of polling ensures lower ClockErrorBound values.
The Amazon CloudWatch dashboard in Figure 1 displays data from two instances. Chronyd on Instance 1 is configured with the server directive and has minpoll and maxpoll values of 4. Notice that the ClockErrorBound values are consistently less than 1 millisecond (ms) and therefore do not trigger the CloudWatch alarm.
For more information about setting the time on EC2 instances, check set the time for your Linux instance in the Amazon EC2 user guide for Linux instances.
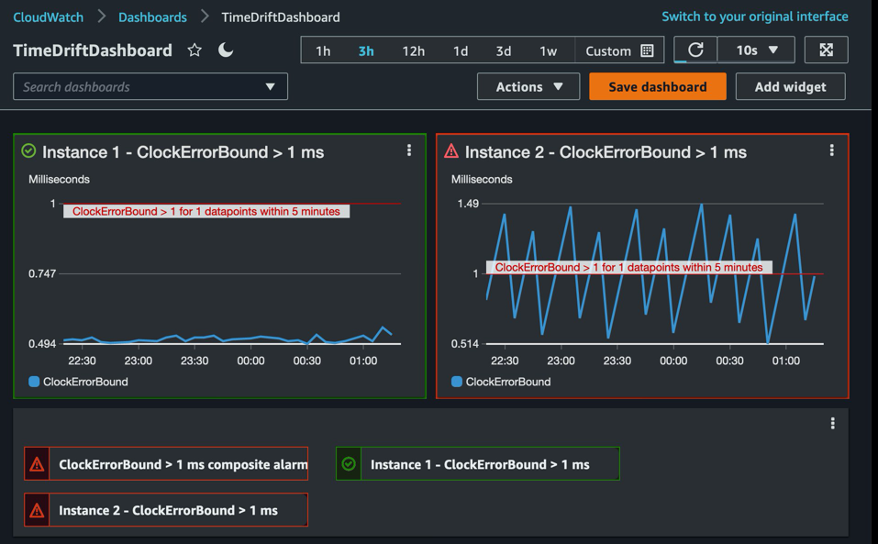
Figure 1: Amazon CloudWatch dashboard displaying alarms and metrics
Step 2. Create a script to monitor the drift in system time
The chrony client output provides detailed metrics on differences between system time and reference time. You can query the client output to determine the time difference and report it as a custom metric to CloudWatch. Here is the chronyc client output:
[ec2-user@ip-192-0-2-0 ~]$ chronyc tracking
Reference ID : A9FEA97B (169.254.169.123)
Stratum : 4
Ref time (UTC) : Thu Feb 04 03:22:27 2021
System time    : 0.000000011 seconds slow of NTP time
Last offset    : +0.000041659 seconds
RMS offset     : 0.000041659 seconds
Frequency      : 10.141 ppm slow
Residual freq  : +7.557 ppm
Skew           : 2.329 ppm
Root delay     : 0.000544 seconds
Root dispersion: 0.000431 seconds
Update interval: 16.0 seconds
Leap status    : Normal
Use the output to calculate the range within which system time is accurate. Three fields from the output, system time (local offset), root delay, and root dispersion, are used to calculate the time offset on the instance and the ClockErrorBound (?).
ClockErrorBound(?) = System time + (0.5 * Root delay) + Root dispersion)
In the preceding example, the clock error bound reported by chrony is:
? = 0.000000011 + 0.000431 + 0.5 x 0.000544 = 0.7 milliseconds
ClockErrorBound(?) is a good proxy for the accuracy of system time because it gives us the bounds between which observed time (C(t)) is accurate. Reference time is between C(t) + ? and(t) – ?. The following shell script (timepublisher.sh) calculates the ClockErrorBound(?) value on a Linux instance. The last line of the script uses the AWS CLI to create or update a CloudWatch custom metric, ClockErrorBound with the calculated value in milliseconds. A new custom metric is created if it doesn’t exist already.
#!/bin/bash

SYSTEM_TIME=""
ROOT_DELAY=""
ROOT_DISPERSION=""
INSTANCE_ID=`curl -s http://169.254.169.254/latest/meta-data/instance-id`

output=$(chronyc tracking)

while read -r line; do
# look for "System time", "Root delay", "Root dispersion".

 if [[ $line == "System time"* ]]
 then
 SYSTEM_TIME=`echo $line | cut -f2 -d":" | cut -f2 -d" "`
 elif [[ $line == "Root delay"* ]]
 then
 ROOT_DELAY=`echo $line | cut -f2 -d":" | cut -f2 -d" " `
 elif [[ $line == "Root dispersion"* ]]
 then
 ROOT_DISPERSION=`echo $line | cut -f2 -d":" | cut -f2 -d" " `
 fi
done <<< "$output"

CLOCK_ERROR_BOUND=`echo "($SYSTEM_TIME + (.5 * $ROOT_DELAY) + $ROOT_DISPERSION) * 1000" | bc `

# create or update a custom metric in CW.
aws cloudwatch put-metric-data --metric-name ClockErrorBound --dimensions Instance=$INSTANCE_ID --namespace "TimeDrift" --value $CLOCK_ERROR_BOUND
Step 3. Create a cron job to publish metrics automatically
Next, you create a cron job to run this script at a regular interval. The following cron entry runs the timepublisher.sh script every five minutes.
*/5 * * * * $HOME/timepublisher.sh
The ClockErrorBound metrics are available in the CloudWatch console when they are published.
Open the Amazon CloudWatch console and from the left navigation pane, choose Metrics. The CloudErrorBound metrics published by the timepublisher.sh script are grouped by EC2 instance ID in the TimeDrift namespace. In this example, there are 158 total metrics and your total metrics may differ. Two of them are the custom TimeDrift metrics being published by the timepublisher.sh script running on the two instances.
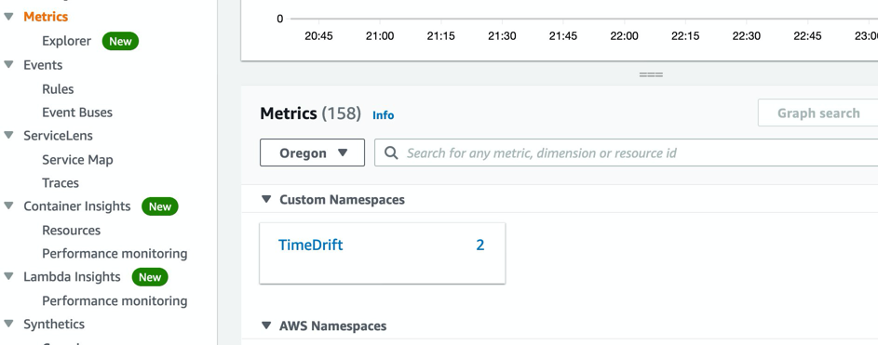
Figure 2: Amazon CloudWatch metrics grouped into namespaces
To view the metric data, choose the TimeDrift link, and then choose the Instance link. Your metrics will be grouped by instance. Figure 3 shows two instances reporting metrics in the TimeDrift custom namespace. To view the data, choose the metrics from the list in Figure 3. The graph displays the ClockErrorBound(?) values in milliseconds over a one-hour time period. In the next step, you will use these metrics to create a CloudWatch alarm.
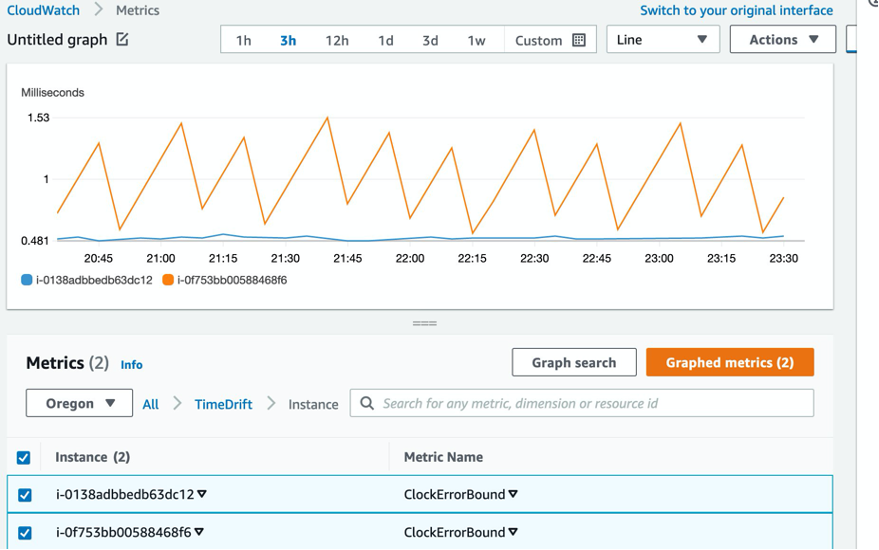
Figure 3: List of metrics available in the TimeDrift namespace
Step 4. Create a ClockErrorBound CloudWatch alarm
Create a CloudWatch alarm to monitor the value of the ClockErrorBound metric created in the previous step and notify a recipient when the value exceeds a threshold. Use a tolerance of 1 ms drift in your example and set an alarm threshold for this value. Your time drift tolerance differs based on your workload, so choose the appropriate value for your environment. When this threshold is exceeded, the alarm is triggered, its state will change from OK to ALARM, and a notification will be sent based on the alarm configuration.
In the Amazon CloudWatch console, choose Alarms, and then choose Create alarm.
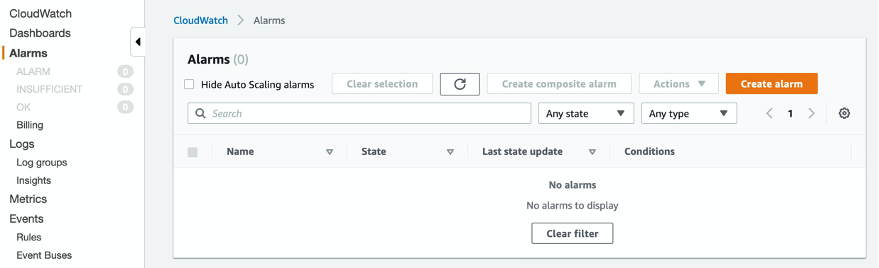
Figure 4: Alarms page in the Amazon CloudWatch console
Choose the TimeDrift metric that your alarm will be based on. The value of this metric will determine the state of the alarm.
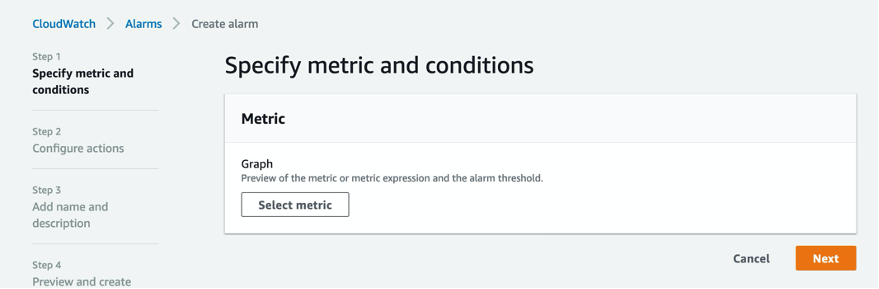
Figure 5: Metric selection is the first step in the alarm creation process
Search for the ClockErrorBound custom metric and view a list of matching metrics available in CloudWatch. You can also navigate the metric tree to display and then choose these metrics. Select the first one in the list for your first alarm.
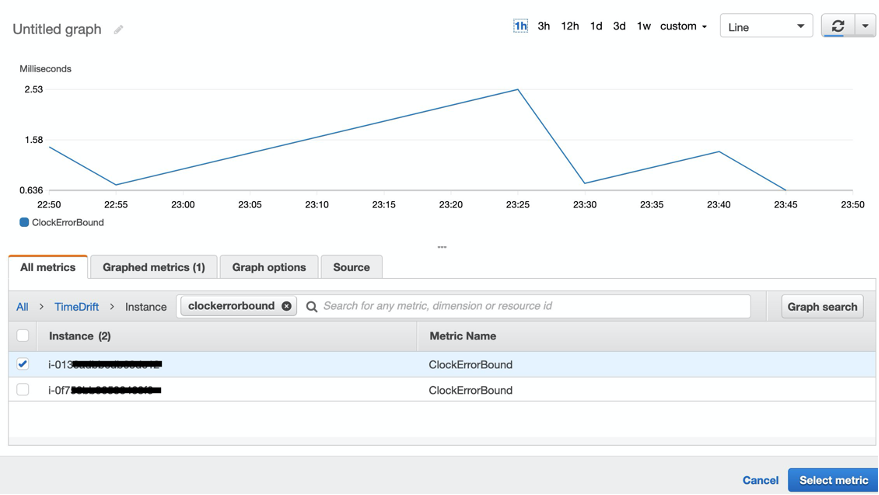
Figure 6: Choosing a metric from a list of all available metrics for the alarm
There are a few different ways to configure the alarm behavior. Metric name and instance values are populated from the metric selected earlier. The Statistic option defines how you want the metric value to be evaluated (Sum, Average, Max, Min, Sample Count, p90). You can use the default (Average) in this case. Set the frequency of alarm evaluation in the Period field. Because the shell script updates the metric every five minutes, you can keep five minutes for the evaluation period, too. A more frequent evaluation does not result in any benefit. Set a static threshold of 1 (ms) and configure the alarm to trigger when the CloudErrorBound value exceeds that threshold.
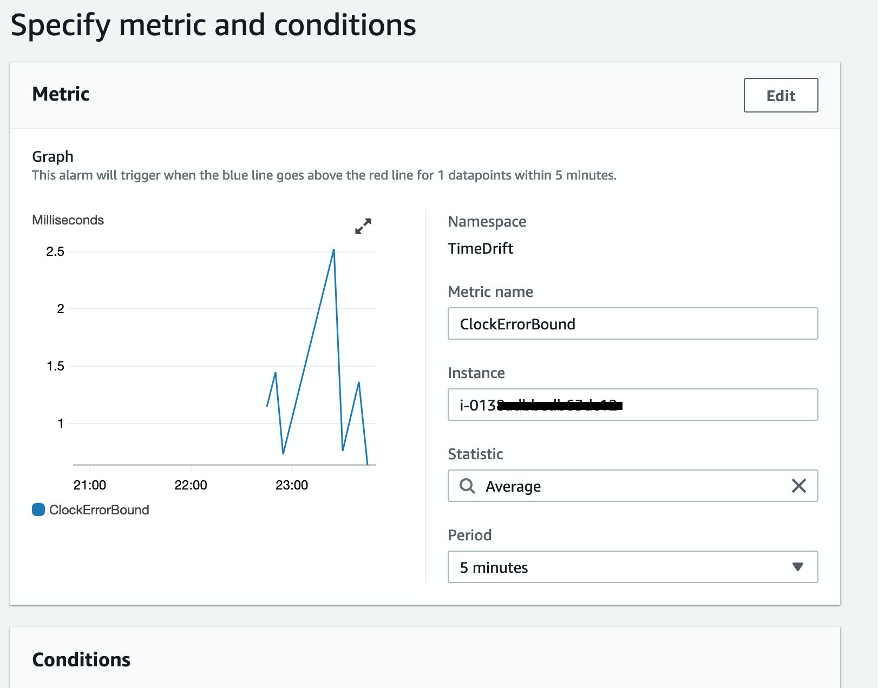
Figure 7: Specify metric conditions for the alarm
Now specify the threshold type and value conditions for the alarm trigger. You can either use a static (hardcoded) or dynamic threshold type. In this case, because we know the specific tolerance for acceptable time drive (1 ms), set the alarm to trigger whenever the value of the CloudErrorBound metric exceeds a static value of 1. In Additional configuration, you can configure options for datapoints in an alarm and missing data treatment.
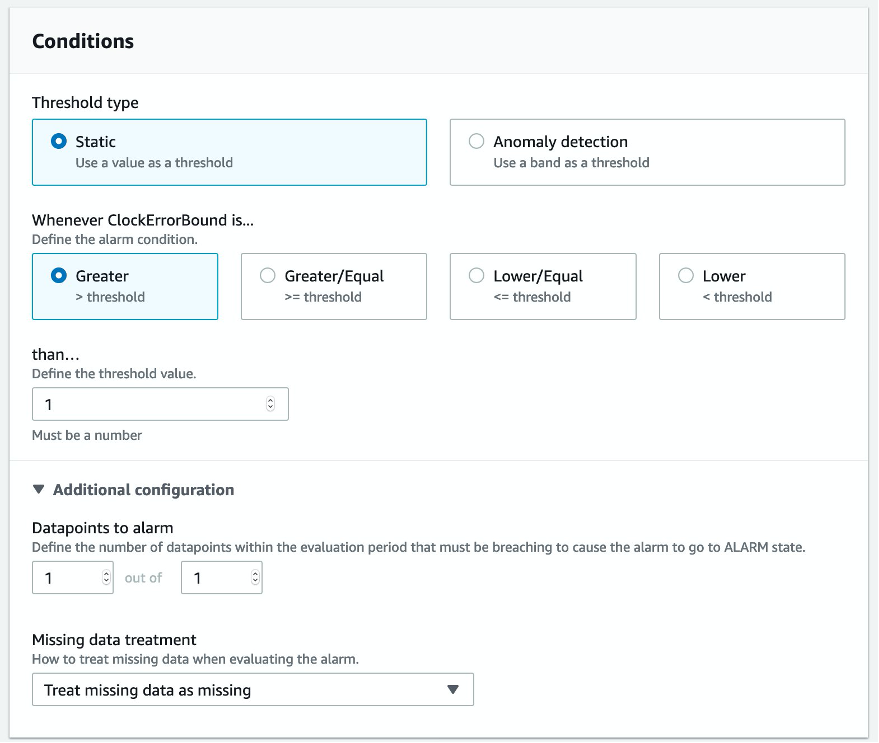
Figure 8: Specify alarm thresholds and other conditions
There are actions associated with alarms. These actions are run when the alarm is triggered. In Amazon CloudWatch, there are five types of actions you can configure in response to an alarm. For example, an action can send an email, message, or mobile push notification through Amazon SNS. You can configure the alarm to send notification to a previously created CW_Alarms SNS topic. (See Prerequisites.) Alarms can be configured to deliver notifications to multiple topics, which are useful if you want to group recipients for your environment.
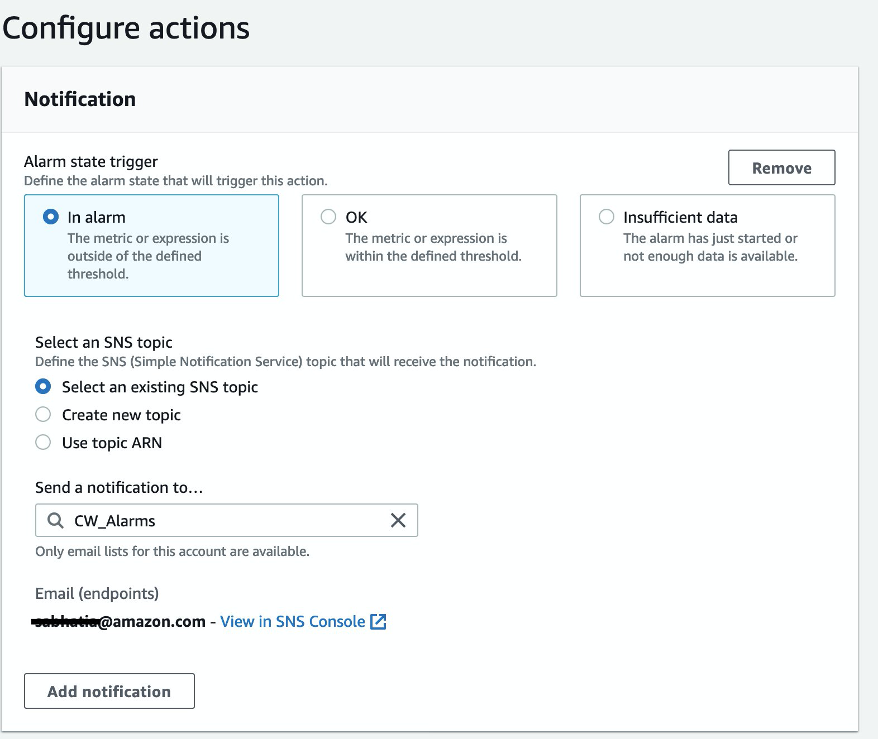
Figure 9: Configure notifications for the alarm
Figure 10 shows the other available actions: Auto Scaling, EC2, Ticket, and Systems Manager OpsCenter. Depending on your use case and environment, these action types help with automation.
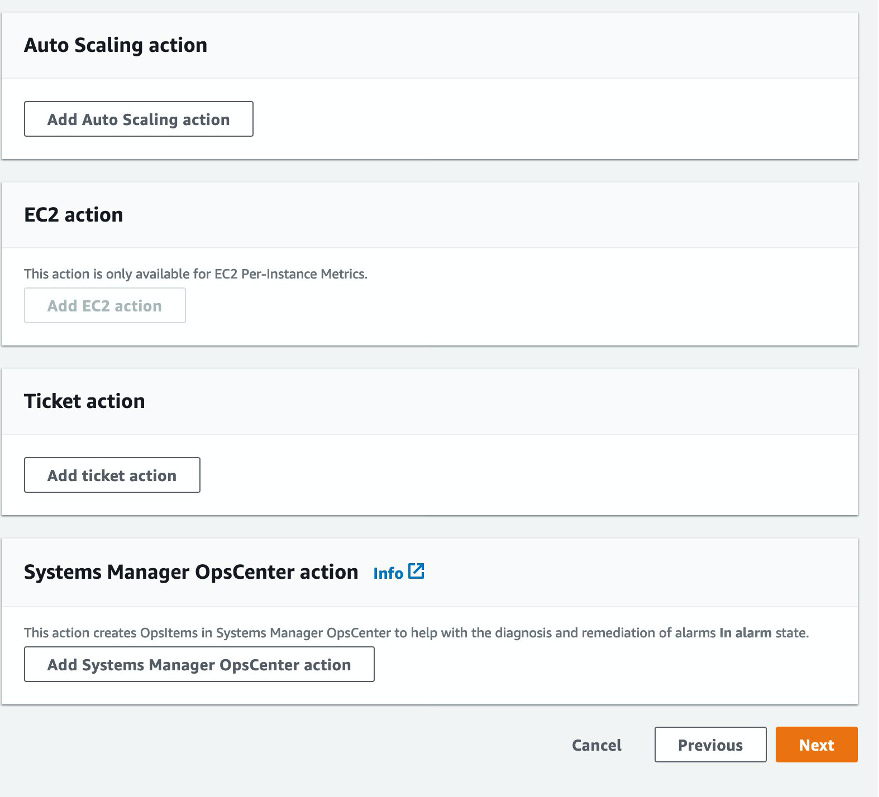
Figure 10: Configure other actions in response to alarm.
Now add a name and description for your alarm. CloudWatch displays the alarm and its configuration in a preview before activating it.
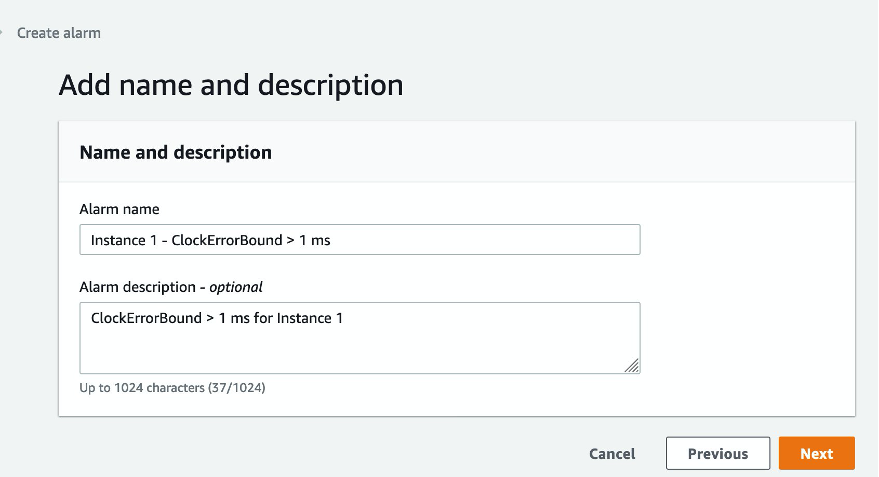
Figure 11: Add a name and description for the alarm
CloudWatch displays a success message and a list of alarms configured for the account.
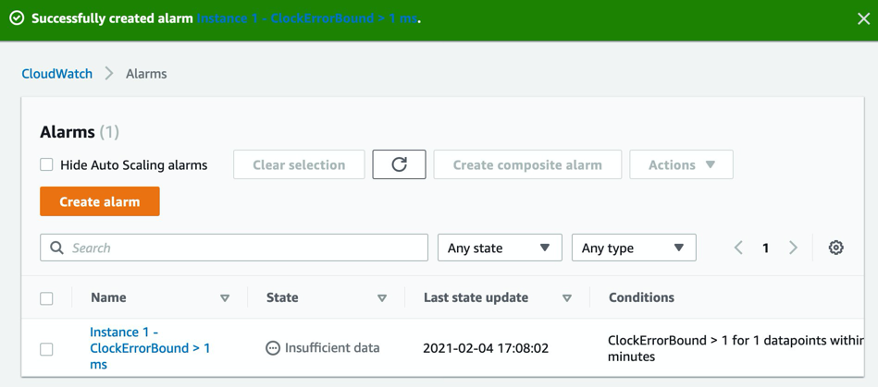
Figure 12: Success banner
You can use the AWS CLI or SDK to automate the alarm creation process. Use the following command to create the alarm used in this example. Replace the SNS topic Amazon Resource Name (ARN) in the --alarm-actions option with the ARN of your SNS topic or action. Each action is specified as an ARN. Use the ID for your instance in InstanceId.
aws cloudwatch put-metric-alarm --alarm-name "Instance 1 - ClockErrorBound > 1 ms" \<br />--alarm-description "CloudErrorBound exceeds 1 ms. for Instance 1" \<br />--metric-name ClockErrorBound --namespace TimeDrift --statistic Average --period 300 \<br />--threshold 1 --comparison-operator GreaterThanThreshold \<br />--dimensions "Name=InstanceId,Value=INSTANCE_ID" --evaluation-periods 1 \<br />--alarm-actions arn:aws:sns:us-west-2:111222333:CW_AlarmsThis example creates an alarm for each instance in your environment. Because customers can get alarm fatigue as their environment grows in size, Amazon CloudWatch offers a composite alarm capability that you can use to aggregate alarms, reduce alarm noise, and increase monitoring efficiency. Composite alarms aggregate multiple alarms into a single, higher-level alarm. You can use them to create logical conditions for the alarm triggers.
Create a CloudErrorBound alarm for at least one other instance in your environment. When you select two or more alarms, you can create a composite alarm based on these metric alarms.
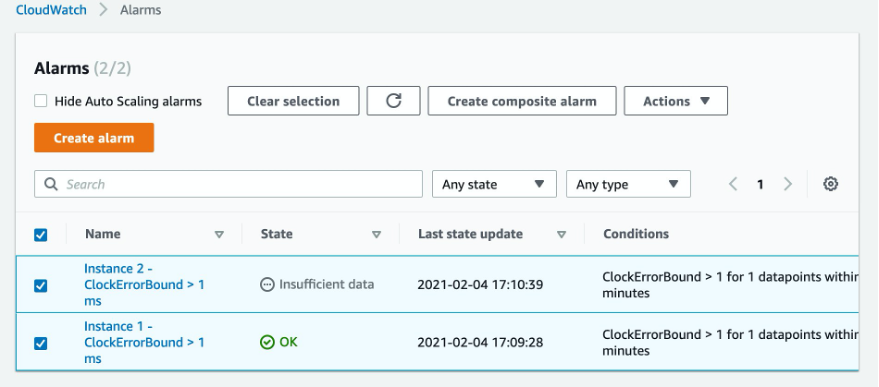
Figure 13: Selecting the group of alarms for a new composite alarm
When you choose Create composite alarm, you can enter the logic for the alarm in an editor. Creating a composite alarm for this use case is helpful because you can create multiple metric alarms with no notifications and manage their notifications in the single composite alarm definition. For more information, see the Improve monitoring efficiency using Amazon CloudWatch composite alarms blog post.
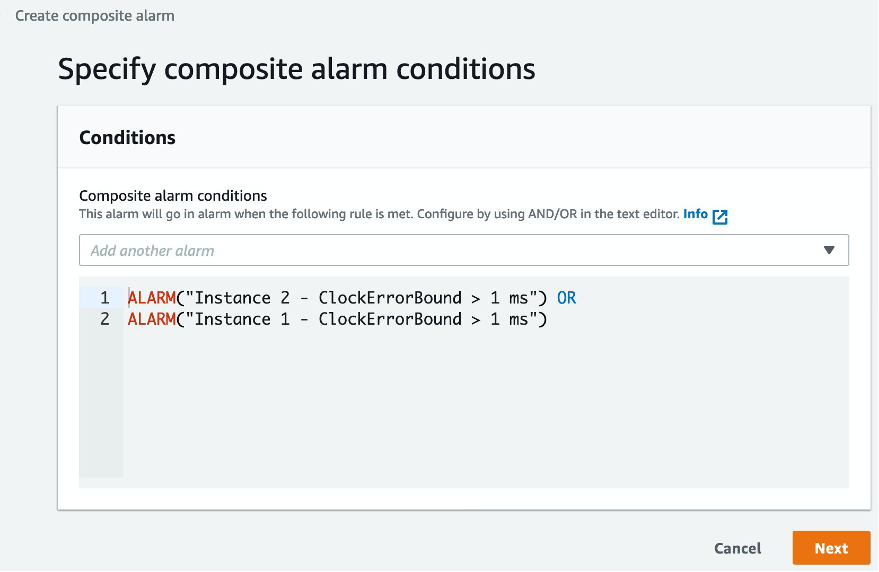
Figure 14: Composite alarm conditions as logical evaluations
The composite alarm notification and action settings are the same as those for the metric alarms you created earlier.
Cleanup
To avoid ongoing charges to your account, delete the resources you created.
- Edit the crontab on your instances and remove the directive to run the
timepublisher.shscript. - Open the Amazon CloudWatch console, navigate to the list of alarms, and delete the three alarms you created. Deleted the composite alarm first and then the two metric alarms.
- In the CloudWatch console, delete the dashboards you created in this exercise.
Conclusion
In this post, I showed how you can use CloudWatch to monitor time drift on EC2 instances. You can use these steps to monitor and alarm on any other system metrics. I installed chrony on an EC2 instance and then used the output of the chronyc client to calculate the value for ClockErrorBound(?). It is a measure of the range in which the system time has drifted from the reference time. I published this value at a five-minute frequency as a CloudWatch metric through cron on my system. Finally, I created a CloudWatch alarm to alert me when the time drift exceeds 1 ms. For further reading, check the following documentation:
AWS CLI Reference for CloudWatch
Amazon CloudWatch user guide, including Creating a Composite Alarm
About the authors
 Sanjay Bhatia is a Principal Technical Account Manager for Strategic Accounts at AWS. Based in the Bay Area, Sanjay works with a global team to help a strategic AWS customer operate their workloads efficiently on AWS. Sanjay has helped a diverse set of customers design and operate a broad variety of workloads using AWS Services and has a keen interest in Performance Management solutions.
 Julien Ridoux is a Senior Software Engineer with AWS, where he focuses on continuously improving the health and availability of EC2. After an academic career and a focus on accurate clock synchronization, Julien now enjoys facing the challenges of building systems at Amazon scale. Outside of work, Julien can be found enjoying the many outdoor activities the Pacific North West region has to offer.