AWS Cloud Operations Blog
Monitor your Databricks Clusters with AWS managed open-source Services
Organizations rely heavily on cloud-based data processing and analytics platforms in today’s data-driven world to unlock valuable insights and make informed decisions. Databricks, a unified analytics platform, has emerged as a popular choice due to its seamless integration with Apache Spark, and its ability to efficiently handle large-scale data processing tasks. Many customers have implemented Databricks on AWS to build an simple to complex analytics platform that addresses variety of use cases such as analytics and AI use cases, such as Extract, Transform and Load (ETL) workloads, Data Quality, and Machine Learning workloads. However, ensuring the seamless execution of Spark workload and optimal performance for Databricks clusters is a key factor.
We can accomplish this by monitoring various aspects of your Databricks clusters such as resource utilization, query performance, and system health. We can proactively identify bottlenecks, troubleshoot issues, and optimize your cluster’s performance. AWS offers a suite of managed open-source services such as Amazon Managed Service for Prometheus, AWS Distro for Open Telemetry (ADOT), and Amazon Managed Grafana that seamless integrate with Databricks, enabling you to gain comprehensive observability and streamline your monitoring efforts.
In this blog post, we’ll explore how you can leverage AWS managed open-source services to monitor your Databricks clusters effectively. We will delve into the key services and techniques that empower you to gain valuable insights into your cluster’s performance, troubleshoot potential issues, and enhance the overall efficiency of your data processing workflows.
Solution Overview
 Figure 1 – Solution Architecture
On a high level, an ADOT Collector will read or scrape metrics from Apache Spark, the engine used by Databricks to run data analytics and machine learning workloads, and a Prometheus Node Exporter at a given interval, and write these metrics into an Amazon Managed Service for Prometheus workspace, in Prometheus compatible format. Spark will be configured to expose metrics, and the Node Exporter will expose node resource metrics, such as CPU and memory, both in Prometheus compatible format. After that, you can visualize the performance metrics in Amazon Managed Grafana.
Solution Details
Pre-requisites
This solution assumes you have:
- An AWS Account. To learn how to create an AWS Account, follow Creating an AWS account.
- A Databricks account. To create a Databricks account, follow these instructions.
- A working Databricks workspace. To deploy a Databricks workspace in AWS, follow Databricks on AWS.
- AWS CloudShell, a browser-based shell, in the same AWS account and region of your Databricks clusters, to run the commands described in this blog. For more information, see Getting started with AWS CloudShell and AWS CloudShell – Command-Line Access to AWS Resources.
Environment Setup
- Navigate to CloudShell. Install the gettext package, that will be used for variables replacements in following steps.
sudo yum -y install gettext
- Let’s setup up few environment variables.
export AWS_ACCOUNT_ID=$(aws sts get-caller-identity --query 'Account' --output text)
export AWS_REGION=us-west-2
export DATABRICKS_AMP_WORKSPACE=databricks-metrics
export DATABRICKS_S3_CONFIG_BUCKET=databricks-metrics-config
export IAM_ROLE=DatabricksAMPRole
export DATABRICKS_WORKSPACE_ID=<DATABRICKS_WORKSPACE_ID>
- Select and configure the region where Databricks clusters are configured. In the example above, we selected
us-west-2; change it to reflect your setup. - The
DATABRICKS_S3_CONFIG_BUCKETwill be used to name a new S3 Bucket, that must be globally unique. Hence, change the variable value fromdatabricks-metrics-configto another. - Replace the value
<DATABRICKS_WORKSPACE_ID>with the ID from the Databricks workspace, following these instructions.
Step 1: Create Amazon Managed Service for Prometheus Workspace
A workspace in Amazon Managed Service for Prometheus is a logical and isolated Prometheus server dedicated to Prometheus resources such as metrics. A workspace supports fine-grained access control for authorizing its management such as update, list, describe, delete, and the ingestion and querying of metrics. Please use the below command to create an AMP workspace.
aws amp create-workspace \
--alias $DATABRICKS_AMP_WORKSPACE \
--region $AWS_REGION
export DATABRICKS_AMP_WORKSPACE_ID= $(aws amp
list-workspaces \
--alias “databricks-metrics” \
--query --query workspaces[0].workspaceId --output text)
Step 2: Prepare Databricks initialization script
To deploy the ADOT collector that will send metrics from the Prometheus Node Exporter and Spark to Amazon Managed Service for Prometheus, you will setup an initialization script. The script performs following steps for each node when it starts:
- Configure Apache Spark’s native Prometheus integration
- Install the Prometheus Node Exporter to measure compute resources
- Download the proper ADOT configuration
- Install and start ADOT as a service
To make both the script and the ADOT configuration files available for the Databricks nodes, you will load it from the Git repository and store it in a Simple Storage Service (S3) bucket. Note that there are two different ADOT configuration files. One of the configuration file is for driver node, responsible for coordinating the execution of workloads in the cluster; while other is for executor/worker nodes, responsible for executing these workloads. The correct configuration file will be automatically selected by the initialization script.
In the following steps, an S3 bucket called databricks-metrics-config is created to store both initialization script and ADOT configuration. You will use a unique name for this S3 bucket. Take note of this S3 bucket name, as it will be used later.
- Create the S3 Bucket
aws s3api create-bucket \
--bucket "$DATABRICKS_S3_CONFIG_BUCKET" \
--create-bucket-configuration LocationConstraint=$AWS_REGION - Clone the git repository
git clone https://github.com/aws-observability/observability-best-practices.git
cd observability-best-practices/sandbox/databricks/ - Upload initialization script and the ADOT configuration files
aws s3 sync . s3://${DATABRICKS_S3_CONFIG_BUCKET}/ \
--exclude 'amp_role/*' --exclude 'grafana-dashboard/*'
Step 3: Create Databricks instance profile
Now, you will authorize Databricks instances to read data from S3 and to write metrics to Amazon Managed Service for Prometheus.
The instances from Databricks cluster will need permission to download the files you uploaded to S3 in Step 2. These instances will also need permission to send metrics to Amazon Managed Service for Prometheus. To grant these permissions, you will create an AWS Identity and Access Management(IAM) role and give Databricks access to use this role.
- Create and Configure IAM role
Run the following commands in CloudShell. It will create and configure an IAM Role to grant the access described above.
ASSUME_ROLE_POLICY_JSON=$(envsubst < ./amp_role/trusted.json)
aws iam create-role --role-name "$IAM_ROLE" \
--assume-role-policy-document "$ASSUME_ROLE_POLICY_JSON"
S3_POLICY_JSON=$(envsubst < ./amp_role/s3.json)
aws iam put-role-policy --role-name "$IAM_ROLE" \
--policy-name "S3Access" --policy-document "$S3_POLICY_JSON"
aws iam attach-role-policy --role-name "$IAM_ROLE" \
--policy-arn "arn:aws:iam::aws:policy/AmazonPrometheusRemoteWriteAccess"
aws iam create-instance-profile --instance-profile-name $IAM_ROLE
aws iam add-role-to-instance-profile \
--instance-profile-name $IAM_ROLE --role-name $IAM_ROLE
- Assign IAM role to Databricks Cluster running the following commands in CloudShell
export CROSS_ACCOUNT_IAM_ROLE=<CROSS_ACCOUNT_IAM_ROLE>
Replace <CROSS_ACCOUNT_IAM_ROLE> in preceding with the cross-account IAM role name. To retrieve this role name, navigate to Databricks Account Console, Workspaces, choose the Databricks Workspace, and take note of the cross-account IAM role name from the ARN Key in Credential as shown in following screenshot.
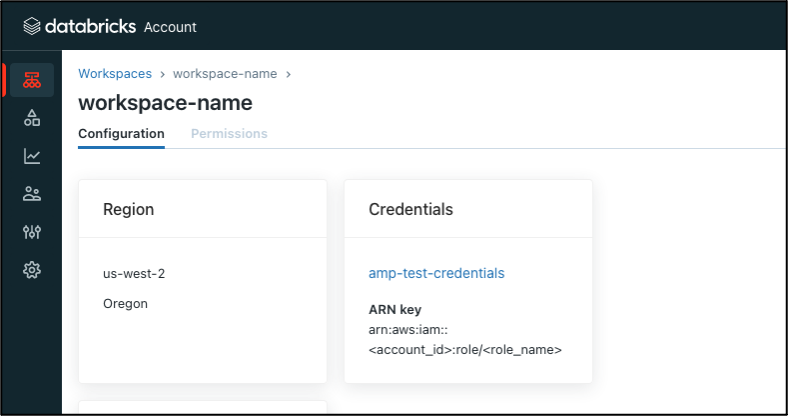
Figure 2 – Databricks Workspace Details
DB_ACCESS_POLICY_JSON=$(envsubst < ./amp_role/pass.json)
aws iam put-role-policy --role-name $CROSS_ACCOUNT_IAM_ROLE \
--policy-name "DatabricksAccess" \
--policy-document "$DB_ACCESS_POLICY_JSON"
- Create the instance profile in Databricks workspace
Retrieve the instance profile ARN running the following command in CloudShell:
aws iam get-instance-profile --instance-profile-name $IAM_ROLE \
--query InstanceProfile.Arn --output text
Navigate to Databricks Workspace Admin settings > Instance profiles > Add instance profile. Update the Instance Profile ARN, adjust for your AWS account ID in the yellow highlighted selection, as shown in the following screenshot.
 Figure 3 – Instance Profile Configure
Step 4: Update Databricks cluster configuration
- Navigate to the Databricks cluster in Compute and select Edit
- Select the instance profile created in previous step.
- In Advanced options > Spark, add the following to Spark config:
spark.ui.prometheus.enabled true - In Advanced options > Spark, add the following to Environment variables:
AMP_REMOTE_WRITE_ENDPOINT=<AMP_ENDPOINT>/api/v1/remote_write
AMP_REGION=<AMP_REGION>
ADOT_INIT_SCRIPT_BUCKET=<S3_BUCKET>
ADOT_DRIVER_CONFIG=adot_config_driver.yaml
ADOT_EXECUTOR_CONFIG=adot_config_executor.yaml
- Replace
<AMP_ENDPOINT>with the remote endpoint of the Amazon Managed Service for Prometheus workspace. You can find it by running following command in Cloudshell:aws amp describe-workspace --workspace-id \ $DATABRICKS_AMP_WORKSPACE_ID \
--query workspace.prometheusEndpoint –output text - Replace
<AMP_REGION>with the region where you created the AMP workspace - Replace
<S3_BUCKET>with the S3 bucket hosting the configuration - The final result should be similar to results show in following screenshot.
 Figure 4 – Databricks Advanced Options Config Set Up
5. In Advanced options, Init Scripts, configure the init-script, replacing <S3_BUCKET> with the S3 bucket hosting the configuration:
6. Select Confirm and restart to apply the changes to the cluster.
Step 5: Setup Amazon Managed Grafana Workspace
Amazon Managed Grafana is a fully managed, scalable, secure and highly available data visualization service that enables customers to instantly query, correlate, and visualize operational metrics, logs, and traces for their applications from multiple data sources. Refer to Amazon Managed Grafana – Getting Started for information on how to configure and setup Amazon Managed Grafana. Amazon Managed Grafana lets you to configure user access through AWS IAM Identity Center or other SAML based Identity Providers (IdP). In this post, we’re using the AWS IAM Identity Center option with Amazon Managed Grafana. To set up Authentication and Authorization, follow the instructions in the Amazon Managed Grafana User Guide for enabling AWS IAM Identity Center.
Finally, add the Amazon Managed Service for Prometheus Workspace as an Amazon Managed Grafana datasource, following the instructions.
Step 6: Visualizing Grafana dashboard
To import the Databricks Performance Dashboard for Grafana, you can download the JSON file content from this location in your local computer:
curl -S https://github.com/aws-observability/observability-best-practices/raw/main/sandbox/databricks/grafana-dashboard/DataBricksAMGDashboard.json -o DataBricksAMGDashboard.json
Now, import the JSON file content into Amazon Managed Grafana. Navigate to the Amazon Managed Grafana console, and select the + and import button on the left ribbon panel. Paste the copied JSON file content in the import via panel json text box, and choose the Amazon Managed Service for Prometheus Data Source from the drop down. Then, choose the import button to see the Databricks dashboard.
You should see different panels of the dashboard such as Driver CPU, Driver Memory, Executor Memory, Executors Running, similar to the following dashboard. You can filter by AMP workspace, and Databricks Cluster ID.


 Figure 5 – Databricks Dashboards in Amazon Managed Grafana
Clean-up
You will continue to incur cost until deleting the infrastructure that you created for this post.
- Remove the scripts from the S3 bucket, and then delete the S3 bucket.
aws s3 rm s3://${DATABRICKS_S3_CONFIG_BUCKET} –recursive
aws s3 rb s3://${DATABRICKS_S3_CONFIG_BUCKET}
- In Databricks, remove the initialization script configuration, the Environment Variables and the Spark configuration. You can also remove the instance profile and the inline policy from the cross-account an IAM role.
- Run the following commands in CloudShell to delete the Amazon Managed Service for Prometheus workspace:
aws amp delete-workspace $DATABRICKS_AMP_WORKSPACE_ID
Conclusion
Effectively monitoring your Databricks clusters in AWS is essential for maintaining a high-performing and reliable data infrastructure. In this blog post, we showed how by leveraging AWS managed open-source observability services, you can gain comprehensive observability, enabling you to monitor key metrics, troubleshoot issues, and optimize the performance of your Databricks clusters.
To learn more on how to observe Databricks cluster and workloads using AWS Native Services such as Amazon CloudWatch, see How to monitor Databricks with Amazon CloudWatch. To get hands-on experience on AWS services for Observability, including Amazon Managed Service for Prometheus, Amazon Managed Grafana, and AWS Distro for OpenTelemetry, check out the One Observability Workshop. To learn more about monitoring best practices for Databricks in AWS, check the AWS Observability Best Practices guide.
About the authors: