AWS Cloud Operations Blog
Observe your Azure and AWS workloads simultaneously with Amazon CloudWatch
Overview
Effective operation of cloud applications and services demands a strong focus on monitoring and observability. It’s critical for your teams to define, capture, and analyze metrics, ensuring operational visibility and extracting actionable insights from logs.
In many companies, technical teams share integrated systems to monitor the services or infrastructure they manage. Shared observability systems consolidate performance and availability data for an organization. They enable teams to visualize connections between services and components. Teams collaborate with real-time data and swiftly identify the source of performance, availability or security issues.
In multicloud environments when workloads run on different clouds, creating a centralized observability solution can result in siloed approaches that adds complexity, and both direct and indirect costs. Having a holistic view and unified approach for monitoring becomes very important for customers who run workloads in multicloud environments.
AWS provides several services that help improve your monitoring and observability posture in hybrid and multicloud environments. One of these services is Amazon CloudWatch that helps you to monitor the health of your resources and applications on AWS, on premises and other clouds.
Today we will show you how to monitor workloads in multicloud environments using a feature of Amazon CloudWatch: querying metric data from Azure Monitor.
This feature helps you to gain visibility on workloads that run in hybrid and multicloud environments, as well as your own custom data sources. You can query and visualize data such as CPU utilization coming from both Amazon EC2 instances and Azure Virtual Machines on the same dashboard and create alarms from this data.

Figure 1: feature overview
CloudWatch data sources are powered by AWS Lambda, which executes metric queries. Storage of remote credentials, such as client secrets and Azure subscription IDs, are managed by AWS Secrets Manager. AWS CloudFormation creates this as a stack on your behalf. This approach creates an extensible solution. It builds upon the same framework in metrics data sources. This framework enables inclusion of data from CSV files in Amazon S3, or metrics from Amazon Managed Service for Prometheus, within the CloudWatch experience. For additional details on other data sources, refer to our feature documentation.
Prerequisites
- An AWS account
- An Azure account subscription with Owner permissions
Step one: create the app registration in Microsoft Entra ID portal
Integration of Azure metric data to Amazon CloudWatch requires the creation of an app registration from the Azure tenant. We will explain this process in simple terms, but we won’t go into details related to Azure role-based access control (Azure RBAC) or your specific security and governance needs in this post.
Before implementing the process outlined here, make sure to review it to ensure that it meets your security requirements. Please note, this configuration will allow monitoring reader access to all resources within the subscription to Amazon CloudWatch.
- Sign in to the Microsoft Entra admin center as at least a Cloud Application Administrator.
- Select the Identity menu option, followed by Applications, then select App registrations.
- Select New registration.
- Give your registration a name, (e.g. Amazon CloudWatch) and select the tenant option that meets your use case. Leave this on the default “Accounts in this organizational directory only (Default Directory only – Single tenant)” setting.
- Select Register.
- Select the Certificates & secrets menu option, then select New client secret.
- Provide a description and an expiration time.
- Note that you must update this secret on the AWS-side prior to expiration.
- Then select Add.
- Copy the Value and keep it safe. This is a sensitive string similar to a password or other access tokens.
- Copy the following fields from the Overview menu option:
- Application (client) ID
- Directory (tenant) ID
With the app registration created, we will now need to grant permission for it to read data from your Azure subscription in Step two below.
Alternative: use the Azure CLI to create the app registration
This command creates a single tenant app registration:
az ad app create --display-name 'Amazon CloudWatch' \
--sign-in-audience 'AzureADMyOrg'
Replace the id returned from the previous command in the argument below:
az ad sp create --id 'ID'Replace the id in the argument with the id from the first command in the argument below.
az ad app credential reset --id 'ID'Note the password displayed in the output as this will be used to configure Amazon CloudWatch.
Alternative: use Azure PowerShell to create the app registration
This command creates a single tenant app registration:
New-AzADApplication -DisplayName "Amazon CloudWatch" -SignInAudience "AzureADMyOrg"Replace the App_ID returned from the previous command in the argument below:
New-AzADServicePrincipal -ApplicationId "App_ID"Replace the ID returned from the first command in the argument below:
New-AzADAppCredential -ObjectId "ID" | Format-ListNote the secret value as this will be used to configure Amazon CloudWatch.
Step two: grant permissions to the Azure subscription in the portal
- Sign in to the Microsoft Azure Portal, search for Subscriptions in the global search box
- In the Subscriptions blade, select the subscription you wish to integrate with Amazon CloudWatch.
- Select Access control (IAM) from the menu, then Add then select Add role assignment.
- Select Monitoring Reader from the list and then select Next.
- Choose Select members and then type the name of your app registration.
- Note that the name may not appear in the list until entered. Select the app registration name, and then click Select.
- Finally, select Next, then Review and assign.
You can validate these permissions are applied by reviewing other resources in your subscription, such as virtual machines from their IAM pages.
Alternative: use the Azure CLI to grant permissions to the Azure subscription
Replace the Subscription_ID in the command below with your subscription and replace the app_ID with the output from the az command used above.
az role assignment create --role 'Monitoring Reader' \
--scope '/subscriptions/Subscription_ID' --assignee 'app_ID'
Alternative: use Azure PowerShell to grant permissions to the Azure subscription
Replace the ID returned from the New-AzADServicePrincipal command in the argument below and replace Subscription_ID with your subscription.
New-AzRoleAssignment -ObjectId "Id" -Scope "/subscriptions/Subscription_ID" -RoleDefinitionName "Monitoring Reader"Step three: configure CloudWatch to read metric data from Azure
First, in the CloudWatch console, select Settings on the left-side navigation, and then select Metric data sources.
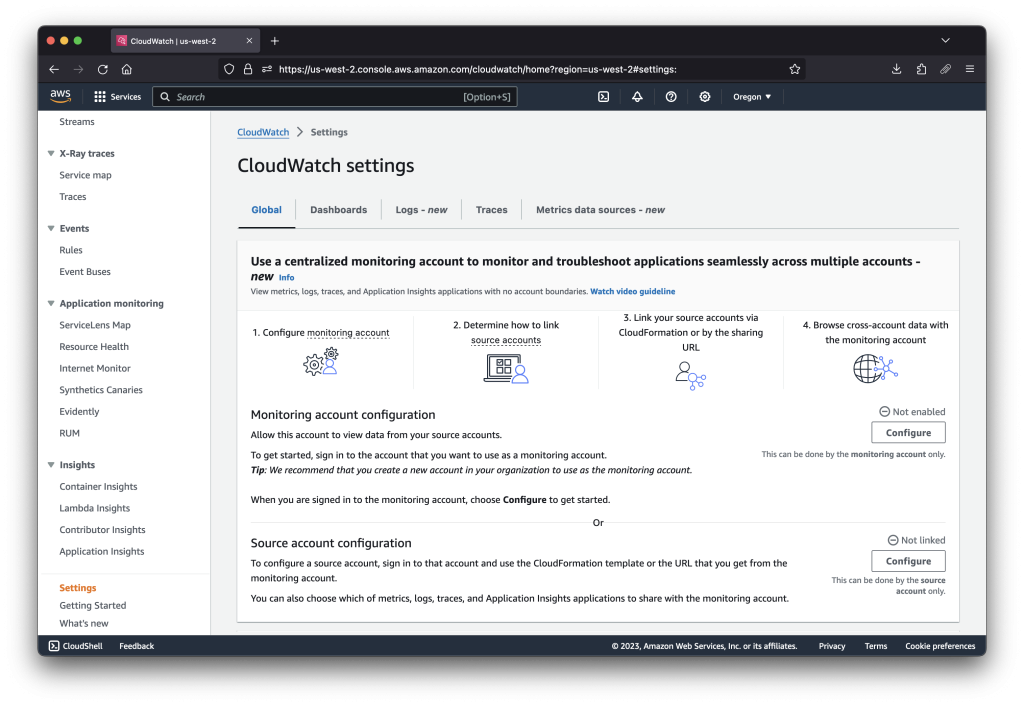
Figure 2: the settings page for the CloudWatch service
Next, select Create data source, Azure Monitor, and then Next.
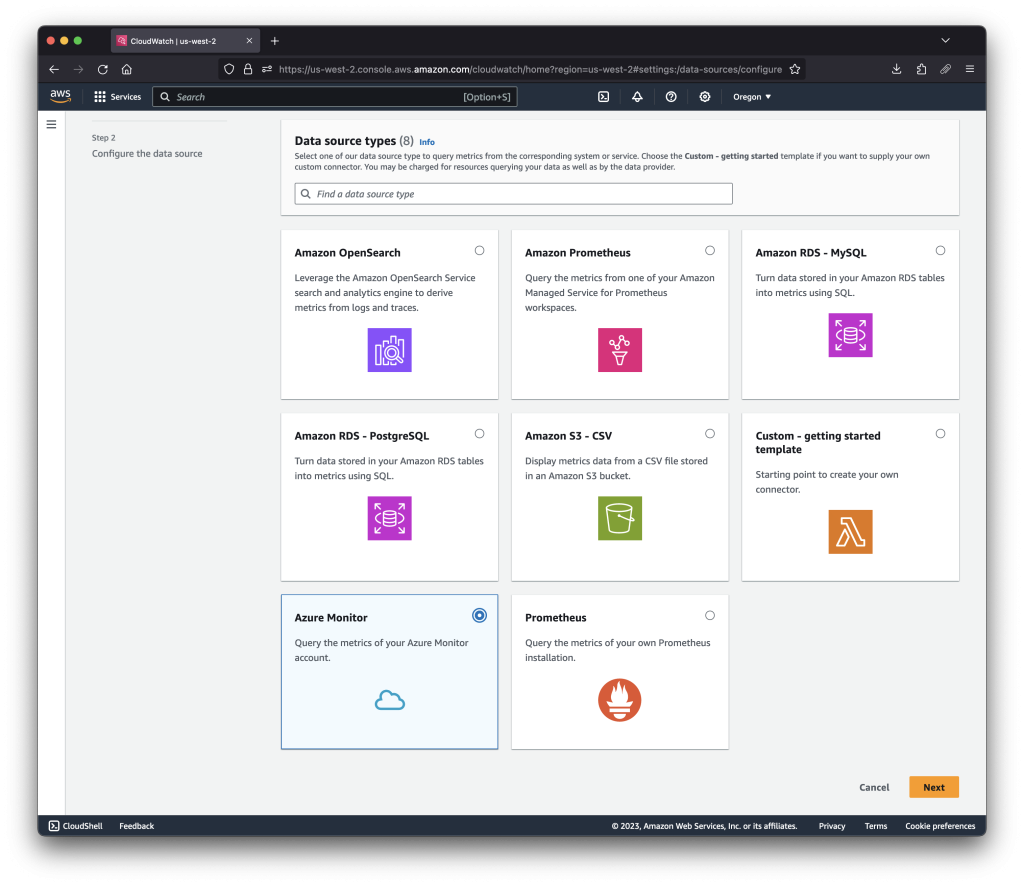
Figure 3: selecting Azure Monitor from the list of metric data sources
Give the data source a name. Note that this name will appear as the name of the CloudFormation stack that is created. Enter the Directory (tenant) ID, Application (client) ID, and secret data, and then select Create data source.
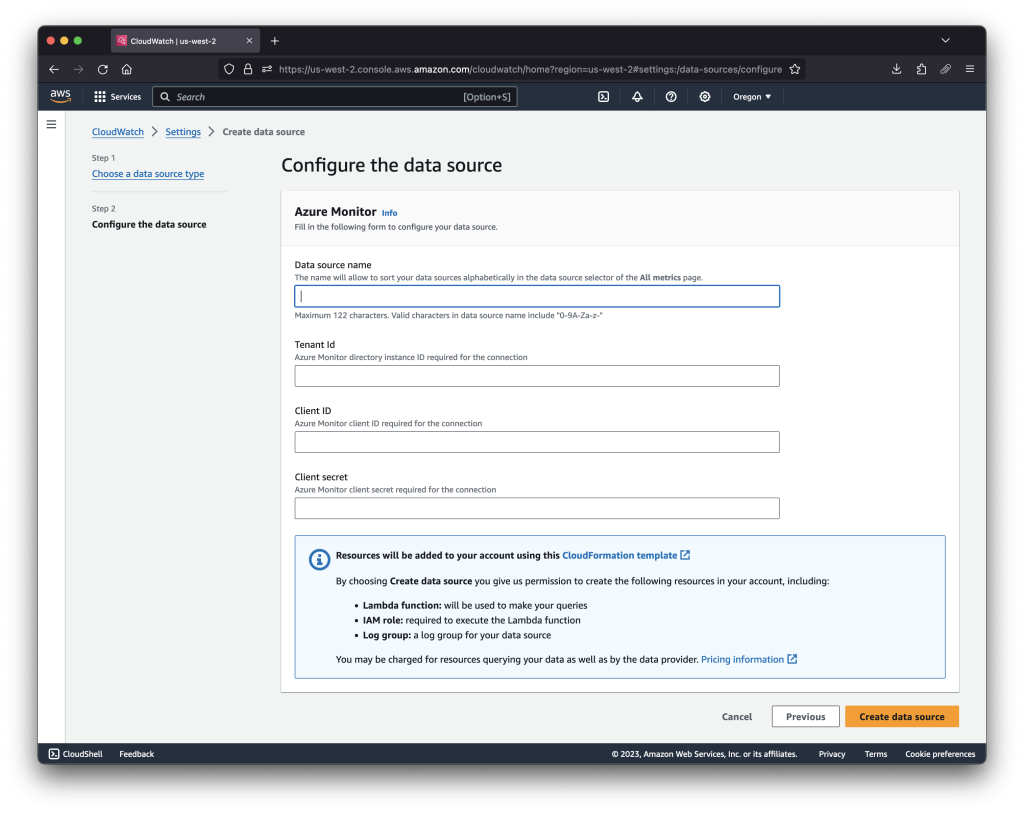
Figure 4: configuring the new data source with your Azure app credentials
You can optionally follow the progress of the stack by following the link to CloudFormation. Typically, we see this process completed in less than two minutes. Note that for other metric data sources, such as Prometheus or Amazon RDS, you can optionally create the Lambda function within a VPC, which may add an extra minute or two to the provisioning time. When you see this screen, your integration is complete.
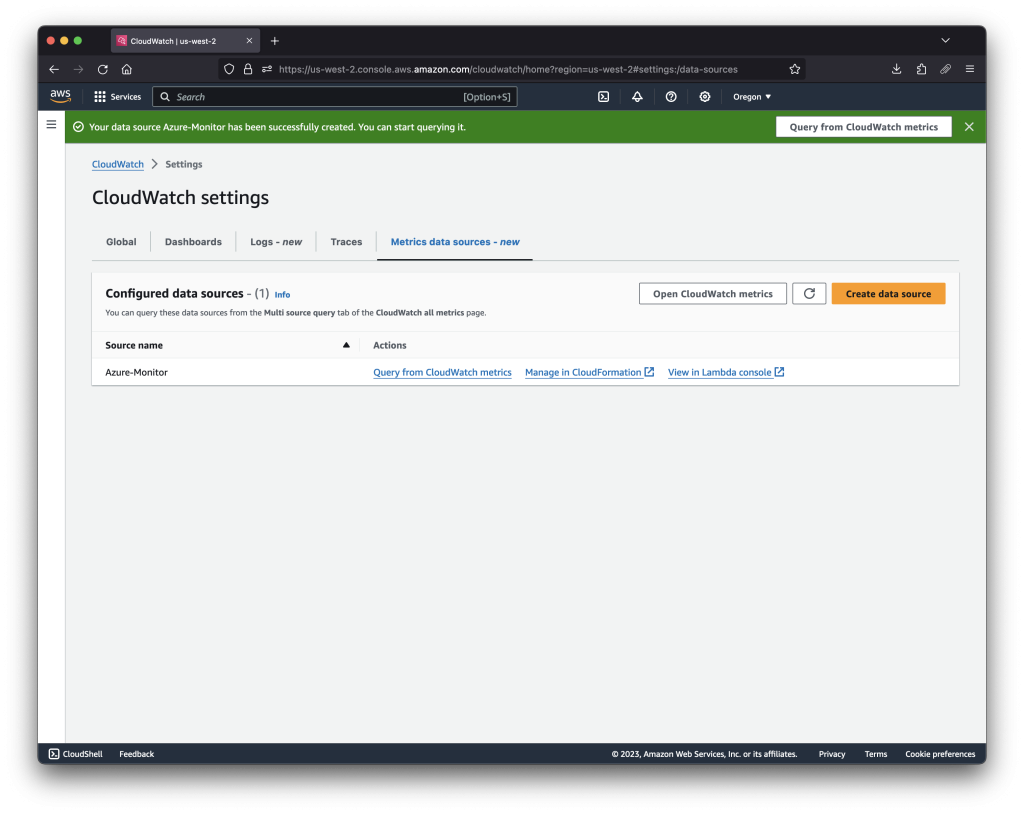
Figure 5: the completed integration page in CloudWatch
Step four: visualize data from your Azure environment
Now you can query Azure Monitor for metric data using CloudWatch. Either click on the Open CloudWatch metrics button, or browse to All metrics in the left navigation menu, then Multi source query, and then select your data source name in the drop-down.
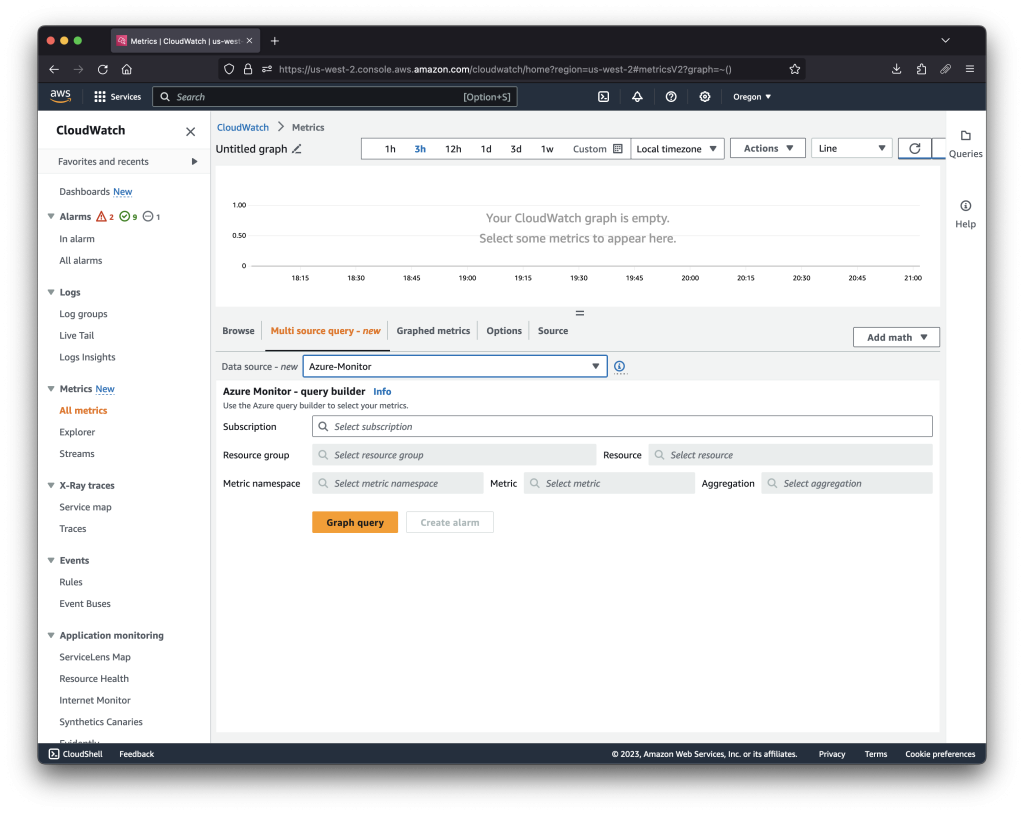
Figure 6: a view of the multi source query console
Select your subscription, resource group, and other fields. CloudWatch is now monitoring your Azure subscription, just as it does your AWS account.
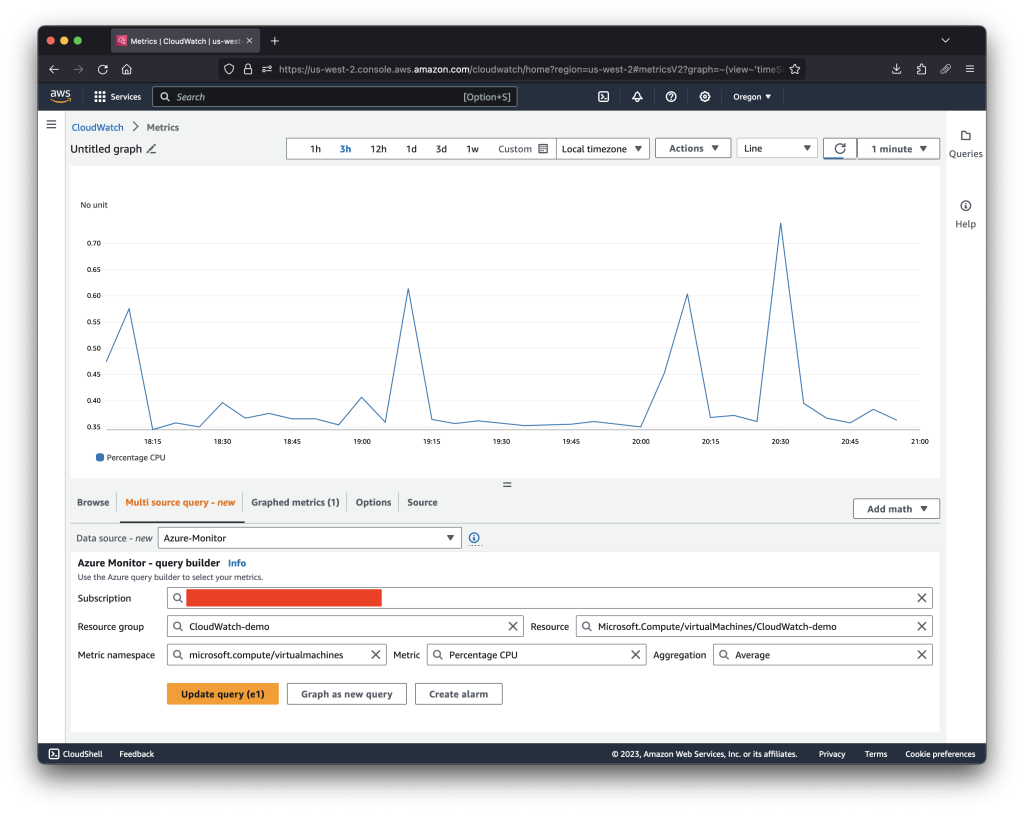
Figure 7: visualizing CPU from an Azure VM using CloudWatch
A word about how this integration functions: Azure Monitor (similar to other metric data source types in CloudWatch) are not persisted in CloudWatch. Therefore, CloudWatch will query Azure on-demand as you access its data. This remains true for CloudWatch alarms, which will likewise query enough datapoints per alarm evaluation to see if alert conditions are met. You can see details of every query from the log group corresponding to your metric Lambda.
Troubleshooting common issues
Lambda is employed to execute queries for the metric data source integration and logs are stored in CloudWatch Logs. The log group is the place to find errors in configuration.
These are the most common issues we see, and notes on how to resolve them:
Error message:
INFO Sending response: { Data: [], SubscriptionIds: [] }
This shows that Azure IAM has not applied the grants, and the Lambda cannot enumerate the subscriptions from Azure. Ensure that the step two has been completed on the correct subscription.
Error message:
INFO An error occurred: RestError: Commonly allowed time grains:...
Not all metric data source types support this feature. This can happen if trying to view data that aggregates infrequently into Azure Monitor, such as storage account usage metrics. This is expected behaviour for metrics that are infrequently populated. Check the Azure Monitor API documentation for further details.
Error message:
INFO An error occurred: AuthenticationRequiredError: invalid_client ensure your credentials are correct
This is usually from the wrong credentials being stored in AWS Secrets Manager. Double-check that your tenant ID, application ID, and secret value are correct. You can change these values directly in AWS Secrets Manager without recreating the CloudFormation stack.
Taking integration to the next level
A hybrid and multicloud monitoring and observability solution is a powerful mechanism to watch your cloud operations. You can add value using CloudWatch as a central component of your solution using features that automate and extend these capabilities. One of the most powerful is creating alarms based on metric data from within your Azure environment. A CloudWatch alarm can trigger any automated workflow you can imagine – page administrators, create JIRA tickets, restart servers, or begin failover operations.
You can create composite alarms with CloudWatch that can alert when issues arise in one or more cloud environments. Consider a workload that operates in both Azure and AWS, and a deployment to both providers that creates an outage. Use a composite alarm based on the aggregate count of HTTP errors in your entire cloud landscape, and trigger actions, all based on cloud-native metrics created by both Azure and AWS. For some use cases, this may be a better fit than separate alarms for each environment.
Cost and tear-down
There is no added cost for the use of external metric data sources in CloudWatch, though you will incur standard charges from the use of Lambda, Secrets Manager, CloudWatch logs, and CloudWatch alarms. See the Azure documentation for pricing details for pulling data from the Azure Monitor API.
You can tear-down the integration by simply deleting the CloudFormation stack that was created in step three. This will remove the Lambda function and secrets from Secrets Manager.
Summary
Creating a multicloud observability solution with CloudWatch enables you to visualize and take action on metrics from across many different environments. Using the features of CloudWatch, such as alarms, dashboards, and metric math, you can create advanced queries that unlock siloed operational data, and help reduce the time it takes to address the complexity of using more than one cloud provider. Using this feature, you can access and take action on metric data from outside of AWS, making CloudWatch a center point for how you operationalize your metric data.