AWS Cloud Operations Blog
Operationalizing CloudWatch Anomaly Detection
In this post, you’ll explore Amazon CloudWatch anomaly detection and set it up using the AWS Console, the AWS Command Line Interface (AWS CLI), and AWS CloudFormation. We also review some best practices when using CloudWatch anomaly detection.
CloudWatch alarms allow you to watch CloudWatch metrics and receive notifications when the metrics fall outside of the levels (high or low thresholds) that you configure. CloudWatch anomaly detection optimizes this capability by avoiding manual configuration while providing the ability to adjust and recalibrate the operations thresholds.
CloudWatch anomaly detection applies statistical and machine learning (ML) algorithms to CloudWatch metrics, calculates normal baselines and minimizes surface anomalies with minimal user intervention. Consider the example of a FinTech company. The company expects to receive high traffic during market hours, which maps to high CPU utilization. They would not expect that behavior late at night. Cloudwatch anomaly detection learns these patterns and intelligently raises actionable alerts that your team cares about. This capability helps the operations team avoid noise from CloudWatch alarms and gives confidence that the alarm is actionable. The FinTech company can also send metrics like the number of credit card transactions per week to CloudWatch anomaly detection. It will learn the weekly thresholds and automatically detect an unusual spike in the number of transactions.
This post details how to analyze network firewall logs and detect anomalies to create alarms based on abnormal network activity.
Enabling anomaly detection
CloudWatch anomaly detection is available with any AWS service metric or custom CloudWatch metric that has a discernible trend or pattern. It analyzes the historical values for the chosen metric for predictable patterns that repeat over time to create a baseline. This baseline model is updated when a new metric data is observed, thus reducing the need for frequent manual intervention. Furthermore, it’ll periodically assess the model’s performance and retrain it to adjust to changing business metrics.
To set up anomaly detection, you can use the CloudWatch console, the AWS CLI, or the CloudFormation/AWS Cloud Development Kit (AWS CDK). Each of these is described as follows.
Console
Anomaly detection can be enabled with one click through the CloudWatch console, thus reducing the effort needed to enable the capability. On the CloudWatch Metrics page, you can enable anomaly detection by selecting the Pulse icon.
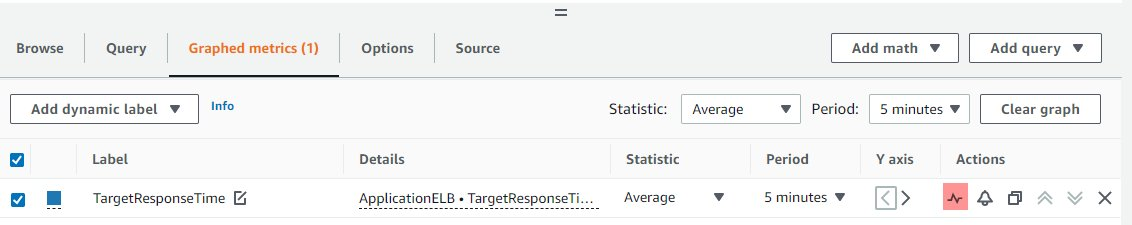
Figure 1: This image shows how to enable anomaly detection by selecting the Pulse icon
Selecting the Pulse icon enables anomaly detection on the TargetResponseTime metric, as shown in the following image. The expected values display in the grey band, and the anomalous values are red.
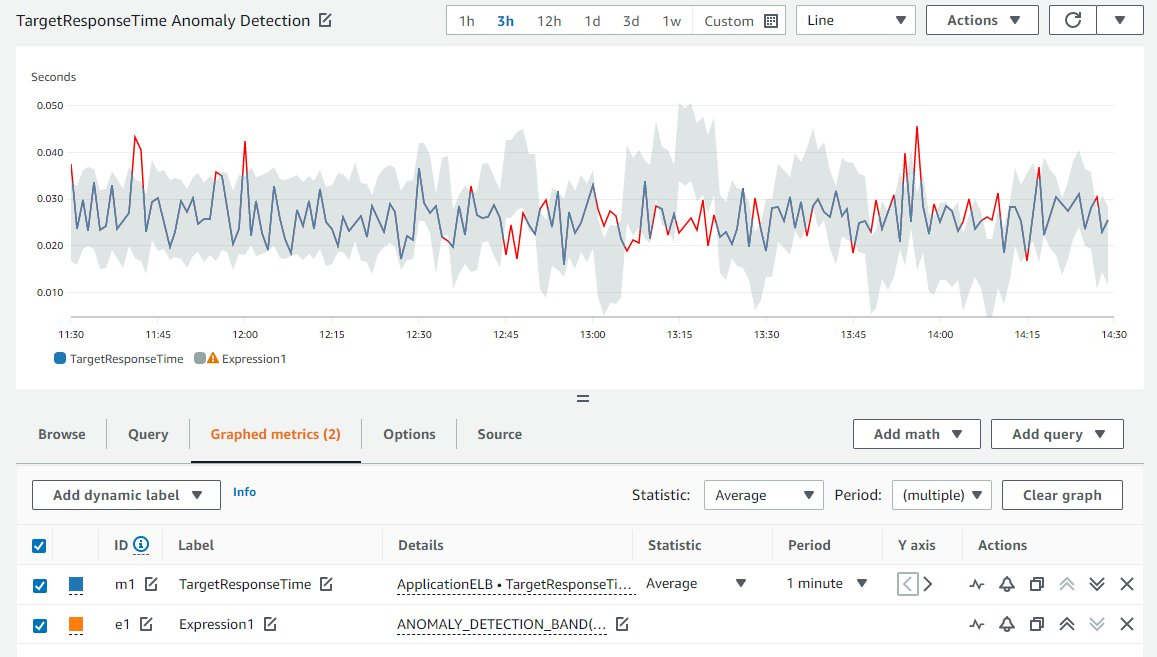
Figure 2. This image shows anomaly detection enabled on the TargetResponseTime metric, including the gray band that illustrates the expected range of values and the anomaly in red.
Furthermore, you can adjust the anomaly detection by setting the sensitivity to adjust the bandwidth if needed. The larger the sensitivity value, the wider the bands, which increases the range of expected values. This option is done via a metric math expression using the ANOMALY_DETECTION_BAND function. This function creates anomaly detection bands (the grey area around the metric time-series bounded by High and Low bands).
It takes the following two parameters:
- The first argument is the metric name (m1 in the following image), which identifies the metrics to enable anomaly detection.
- The second argument is the number of standard deviations for the band. Higher standard deviations will increase the band’s width. You can tune the sensitivity of your anomaly detection band by modifying the second argument of the anomaly detection model.
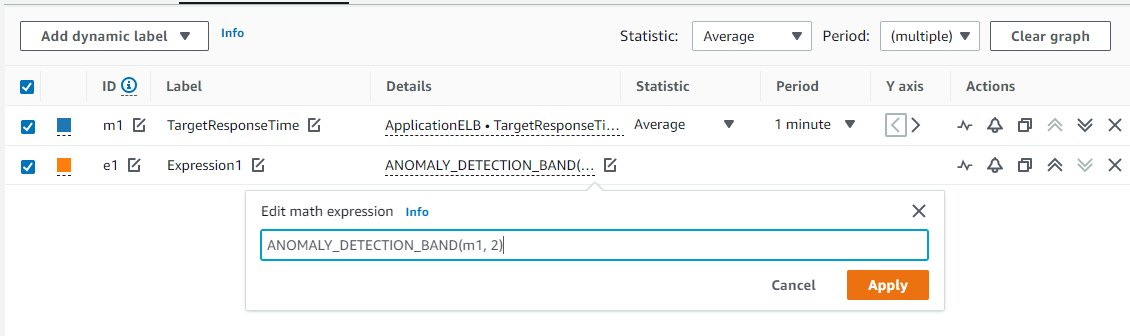
Figure 3: This image describes how to adjust the anomaly detection using the ANOMALY_DETECTION_BAND metric math function.
Select Apply to save the updated function.
AWS CLI
You can create the anomaly detector by calling PutAnomalyDetector. Here is a sample request:
You can also call the DescribeAnomalyDetector API to view your active anomaly detectors and use the DeleteAnomalyDetector API to delete an anomaly detector.
CloudFormation and AWS CDK Templates
You can also create an anomaly detector via CloudFormation/AWS CDK templates. You can create a stack and add the following scripts to create an anomaly detector and alarm:
Anomaly detection model
The anomaly detection model adjusts itself with metric trends, and performance metrics demonstrate consistency in everyday operations. Anomaly detection can adapt itself to such a slow, long-term trend so that it is unnecessary to adjust alarm thresholds manually.
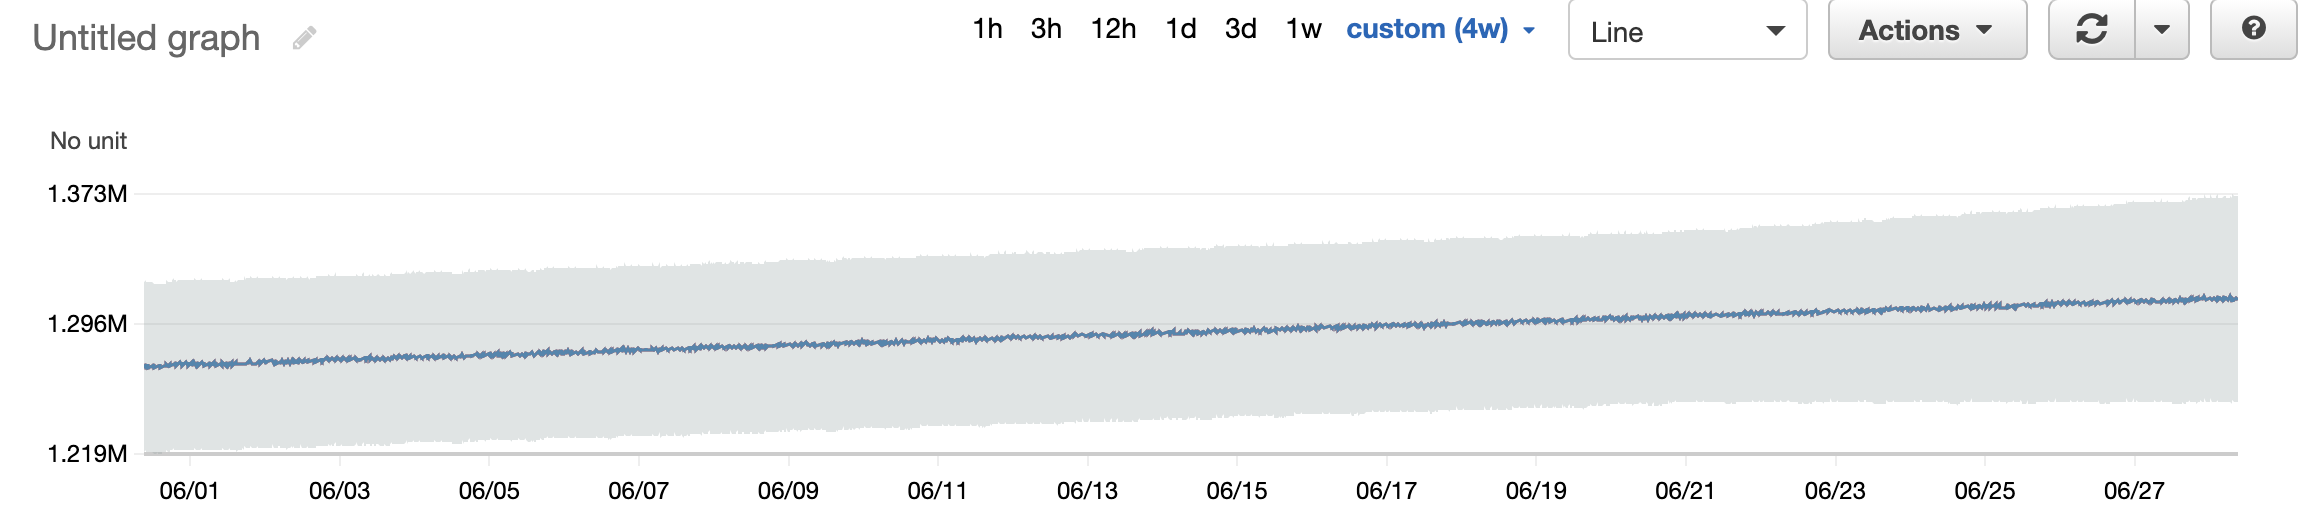
Figure 4: This image shows anomaly detection adjusting itself over time with changes to resource utilization.
Anomaly detection identifies the patterns of the metrics, from hourly, daily, or weekly. It incorporates the identified patterns in the model to generate bands. The CloudWatch anomaly detection algorithm trains on up to two weeks of metric data. However, it can be enabled on a metric even if it doesn’t have a full two weeks of data. The following is an example of anomaly detection bands for metrics having one day periods. Anomaly detection doesn’t extend beyond two weeks now and can’t model one-time events like Black Friday. Furthermore, it can’t iterate on data of more than two weeks.
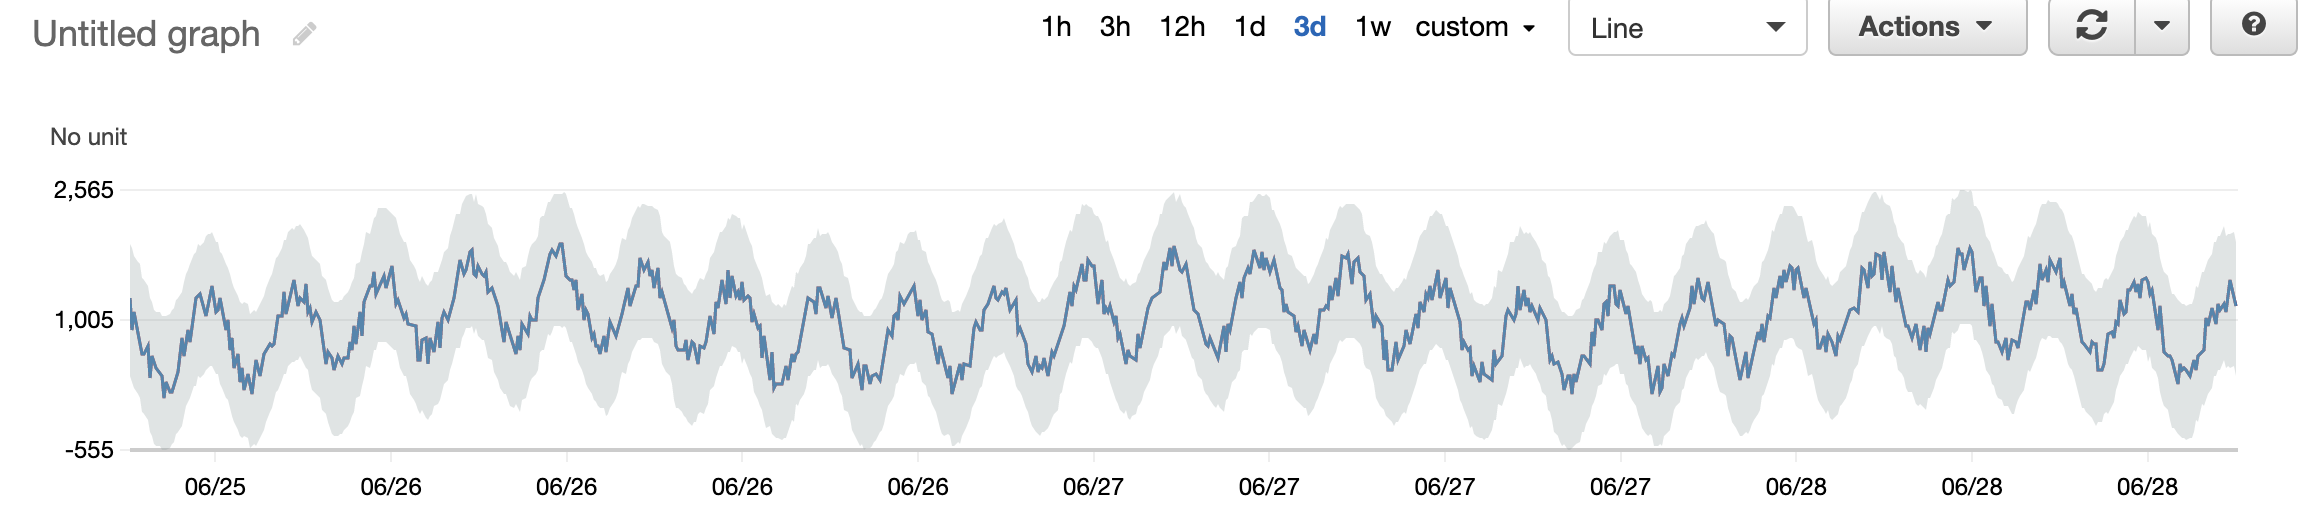
Figure 5: This image demonstrates how anomaly detection accounts for seasonality and trends in metrics.
You can exclude time ranges when training the model. This feature enables the model to be trained without unusual metric values.
There are typically only two ways to adjust anomaly detection bands:
- Modify sensitivity to change the band’s width without retraining the model.
- Delete and recreate a new anomaly detector to manually retrain the model.
Suppose a sudden metric pattern change, such as the average measured value jumps from 1 to 1,000 occurs. In that case, it will take time for the anomaly detection bands to adapt to the new level, usually several hours. During this period, it could keep reporting anomalies and cause false alarms.
Using Anomaly Detection with CloudWatch Alarms and CloudWatch Dashboards
CloudWatch dashboards are a valuable resource for creating a central repository of the most critical metrics for your organization. Work as a team to identify essential metrics that make sense for your applications. Once you have enabled anomaly detection, you can create application-specific dashboards that leverage widgets so that each application has its available metrics. CloudWatch dashboards can be shared with users outside of your AWS account, thus giving your support teams quick access to any plotted metric.
To ensure that no abnormal spikes are missed in your anomaly detection, setting up alerts for the most critical metrics is crucial. You can set appropriate alerts in CloudWatch using CloudWatch Alarms. You can also combine multiple alarms and create composite alarms that result in lesser and more effective notifications. You can use metric math to create custom aggregate metrics. Using anomaly detection in combination with metric math lets you define an acceptable range for these custom metrics. Combining metric math, anomaly detection, and alarms lets you create dynamic alerts based on composite metrics vs. relying on a single metric.Using CloudWatch alarms lets you customize the actions that can get triggered if an alarm goes through CloudWatch Events rule. Moreover, you can trigger remediation through a Lambda function.
Conclusion
Anomaly detection provides visibility into operational metrics that enable you to identify the normal utilization of AWS resources and the associated metrics. It lets you identify a metric that could be an outlier. The dynamic model enables you to define a range that helps avoid false alarms when a metric may change in response to expected behaviors.
Customers are using CloudWatch anomaly detection today on a wide range of metrics. For example, we often see customers using the feature to monitor AWS Lambda duration, invocation, and throttle metrics. Amazon Elastic Compute Cloud (Amazon EC2) customers are monitoring CPUUtilization, EBSIOBalance%; EBSByteBalance%, NetworkIn, and NetworkOut metrics. Amazon Relational Database Service (Amazon RDS) customers are monitoring DatabaseConnections, CPUUtilization, and FreeStorageSpace metrics.
Anomaly detection is generally available, and you can start using it today through the AWS Console, AWS CLI, or CloudFormation/AWS CDK.
About the authors: