AWS Cloud Operations Blog
Visualize application costs using AWS Service Catalog AppRegistry and Amazon QuickSight
In a previous blog post, we discussed how AWS Service Catalog AppRegistry lets you create a repository of your applications and associated resources. Then, you can define and manage your application metadata. This lets you understand the context of your applications and resources across your environments. This post will demonstrate how to utilize your application metadata to get a better understanding of your application costs. You will be able to track the cost over time, provide insights about their trends, and make better investment decisions.
Solution overview
Amazon EventBridge is a serverless event bus service that makes it easy to connect your applications with data from various sources. In EventBridge, create rules that define a schedule so that this is a rule triggered regularly on the schedule you specify. This is a great fit for frequently retrieving application metadata, which lets you visualize data and see how it changes over time.
Before data can be visualized, it usually undergoes a transformation process where data can be enriched and structured into a format that is optimal for a visualization tool. AWS Step Functions lets you create and coordinate individual tasks into a flexible workflow. Step Functions include built-in error handling, parameter passing, recommended security settings, and state management. This reduces the amount of code you must write and maintain.
After the data is transformed and uploaded into a data store, it can be visualized. Amazon QuickSight is a cloud-scale business intelligence (BI) service that you can utilize to deliver easy-to-understand insights. QuickSight connects to your data in the cloud and combines data from many different sources. In a single data dashboard, QuickSight can include AWS data, third-party data, big data, spreadsheet data, SaaS data, B2B data, and more. As a fully managed cloud-based service, Amazon QuickSight provides enterprise-grade security, global availability, and built-in redundancy. Furthermore, it provides the user-management tools you need to scale, all without any infrastructure to deploy or manage.
Figure 1 illustrates the flow for retrieving the metadata from your applications, processing it, and visualizing it in QuickSight.
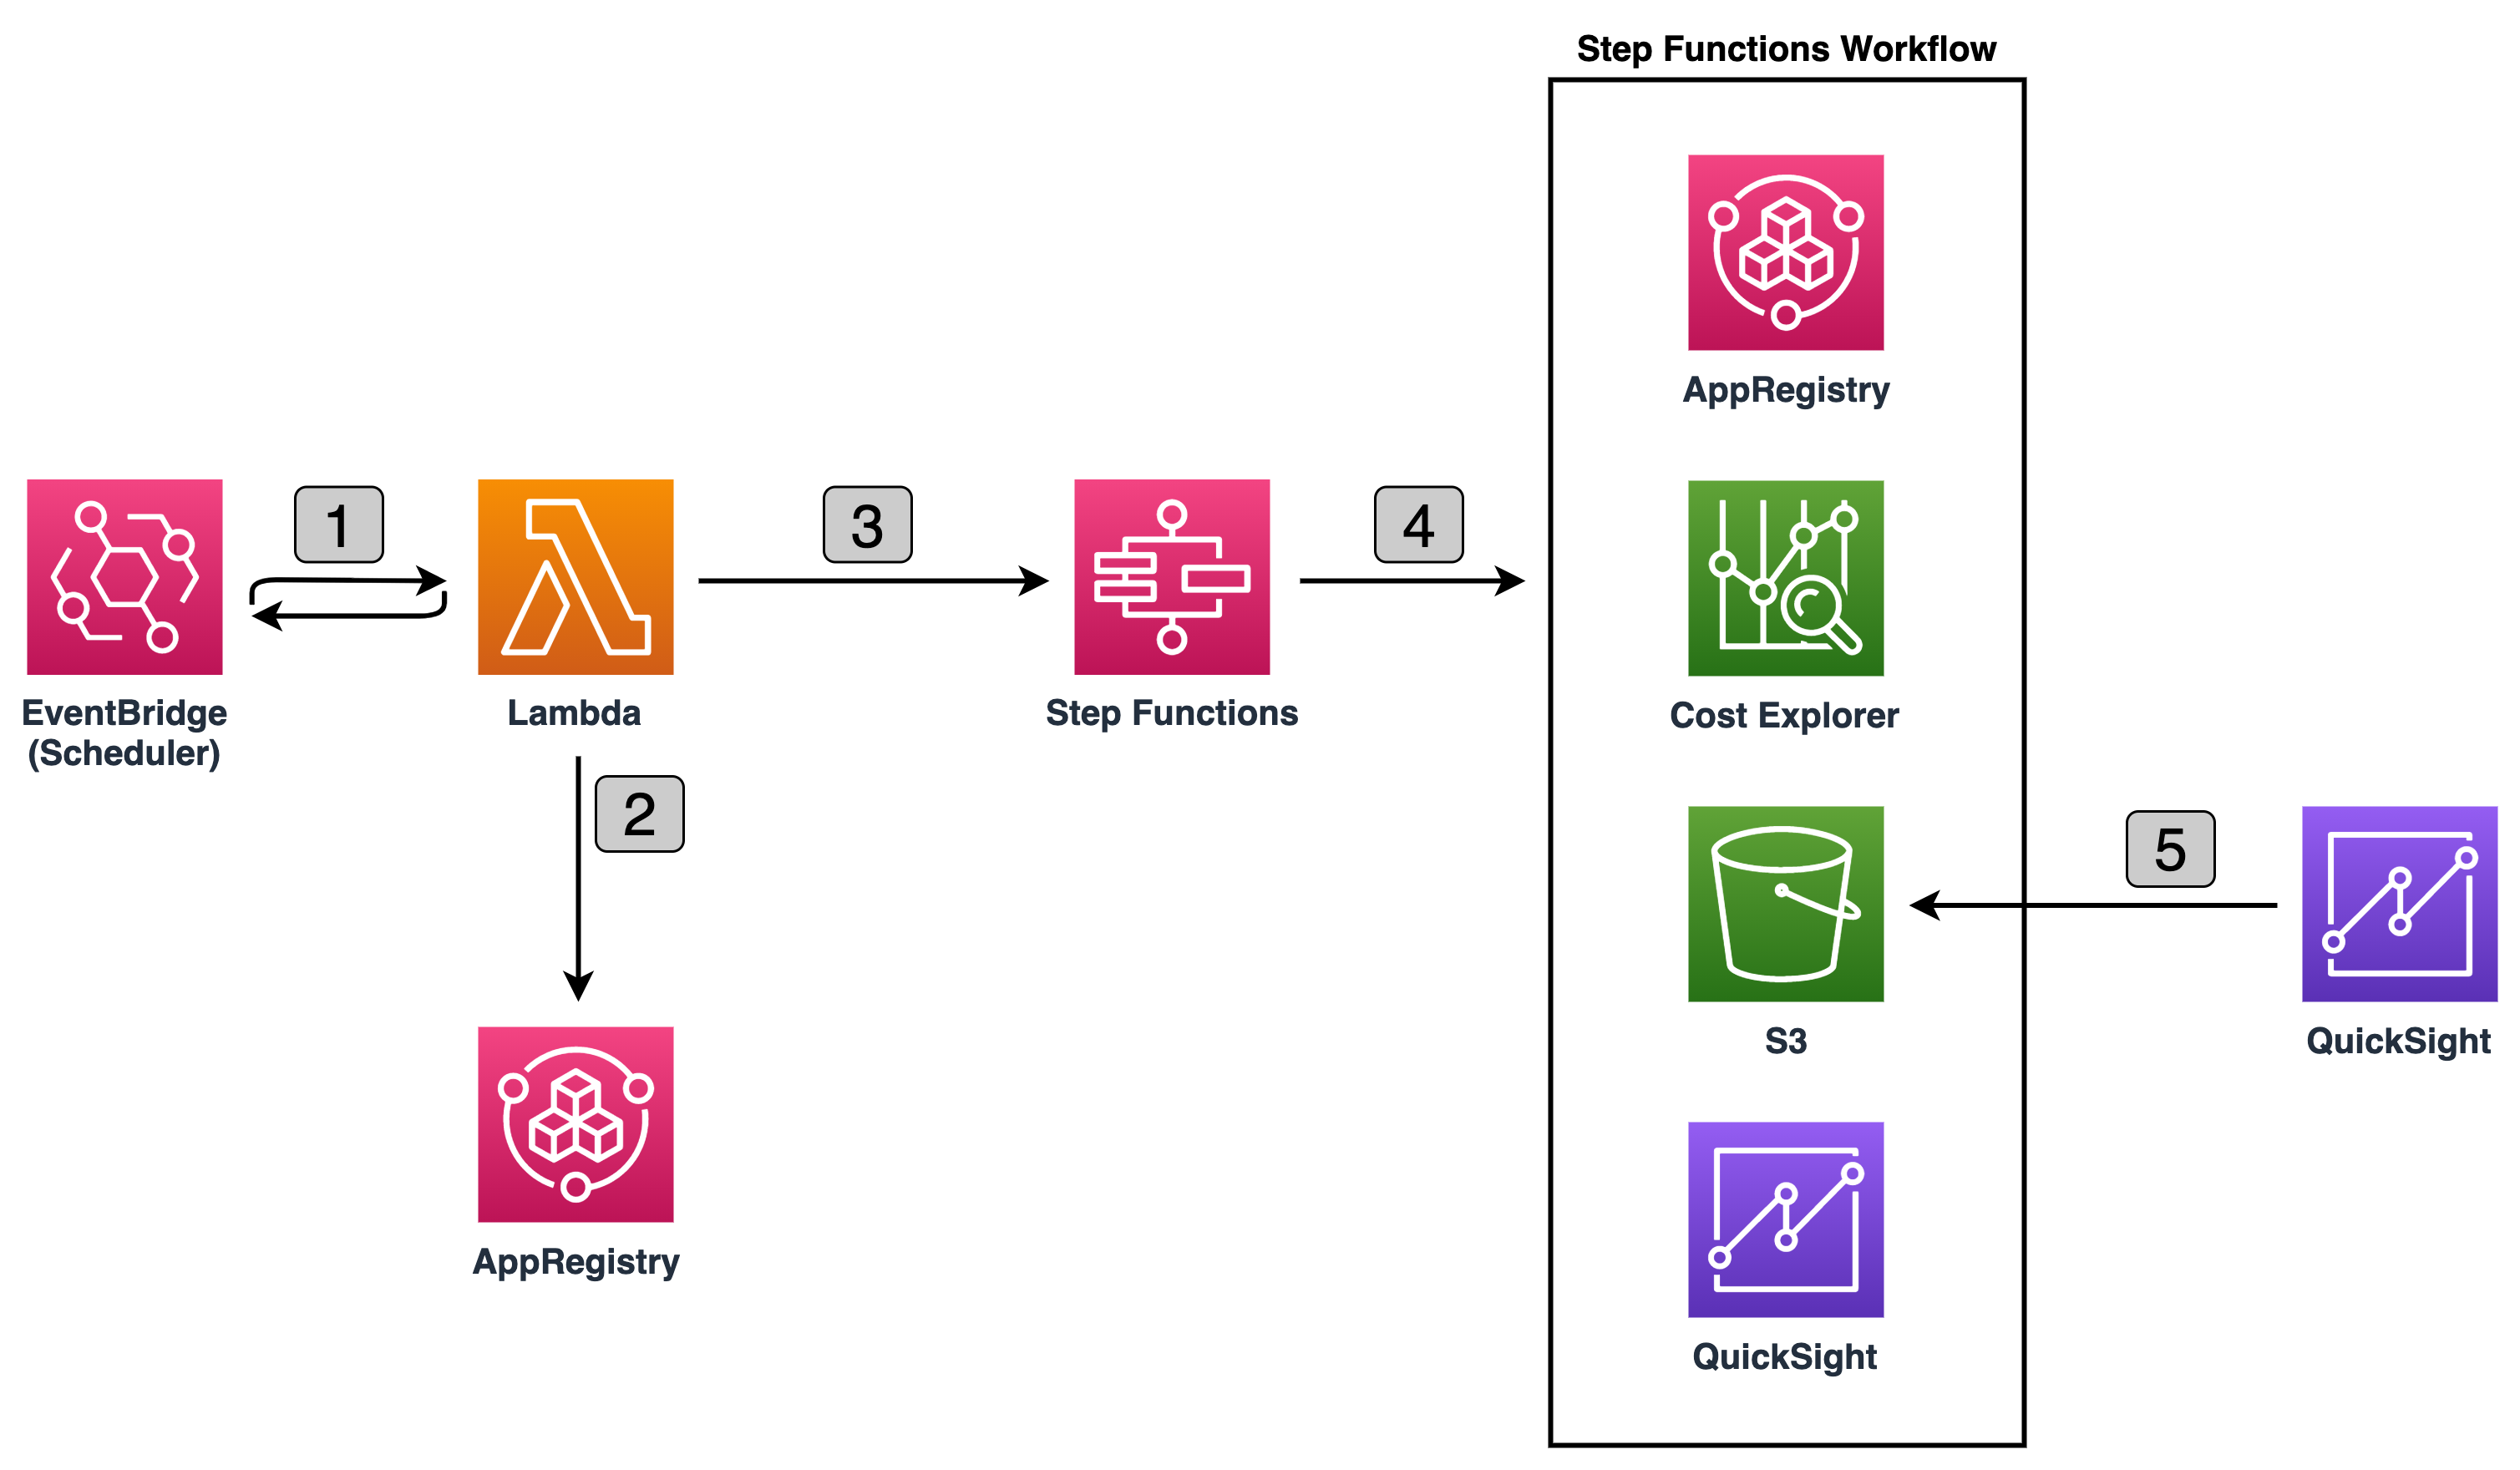
Figure 1: Retrieving, processing, and visualizing application metadata
Let’s go through the flow to understand what happens at each step, as shown in Figure 1:
- On a defined scheduled interval, EventBridge invokes AWS Lambda Function.
- Lambda Function retrieves all existing applications and corresponding associated AWS CloudFormation resources and attribute groups names, and invokes the Step Function passing this data as input.
- Step Function Workflow processes each applications metadata one at a time. It utilizes AWS Cost Explorer to retrieve costs for each CloudFormation stack associated with the application. Next, it retrieves metadata information from each attribute group. Then, it formats the data and uploads it to an Amazon Simple Storage Service (Amazon S3) bucket. Lastly, it notifies QuickSight to pull the latest data from Amazon S3.
- QuickSight refreshes the dataset and updates the dashboards.
Visualizing the AppRegistry applications
Let’s assume the scheduler in EventBridge is configured to trigger the Lambda function daily, and you have one AppRegistry application with one CloudFormation stack and one attribute group associated with the application. Let’s also assume that the attribute group stores the following metadata:
When the Step Functions Workflow starts the execution, it collects the information about the application, as well as:
- queries the Cost Explorer to identify the daily cost of the CloudFormation Stack,
- queries the attribute group to identify other costs associated with this application that run outside the AWS environment,
- and uploads the identified information to S3, then QuickSight pulls new data and uploads to the Dashboard.
This process is repeated every day, and your dashboards begin building up over time. As time progresses and you continue to utilize AppRegistry as the repository of your applications and associated resources, you can start to answer some of the most common question about your application costs, such as:
- What are the total costs of all of my applications over the past six months?
- How did the costs of my applications change over the last six months?
- What are the costs of specific applications over last three months, and which application component is most expensive?
A QuickSight dashboard is a read-only snapshot of an analysis that you can share with other Amazon QuickSight users. A dashboard preserves the analysis configuration at the time that you publish it, including things such as filtering, parameters, controls, and sort order.
To answer the first question, create a Donut chart, grouping by application name and costs, and filtering by time period. Figure 2 illustrates an example Donut chart.
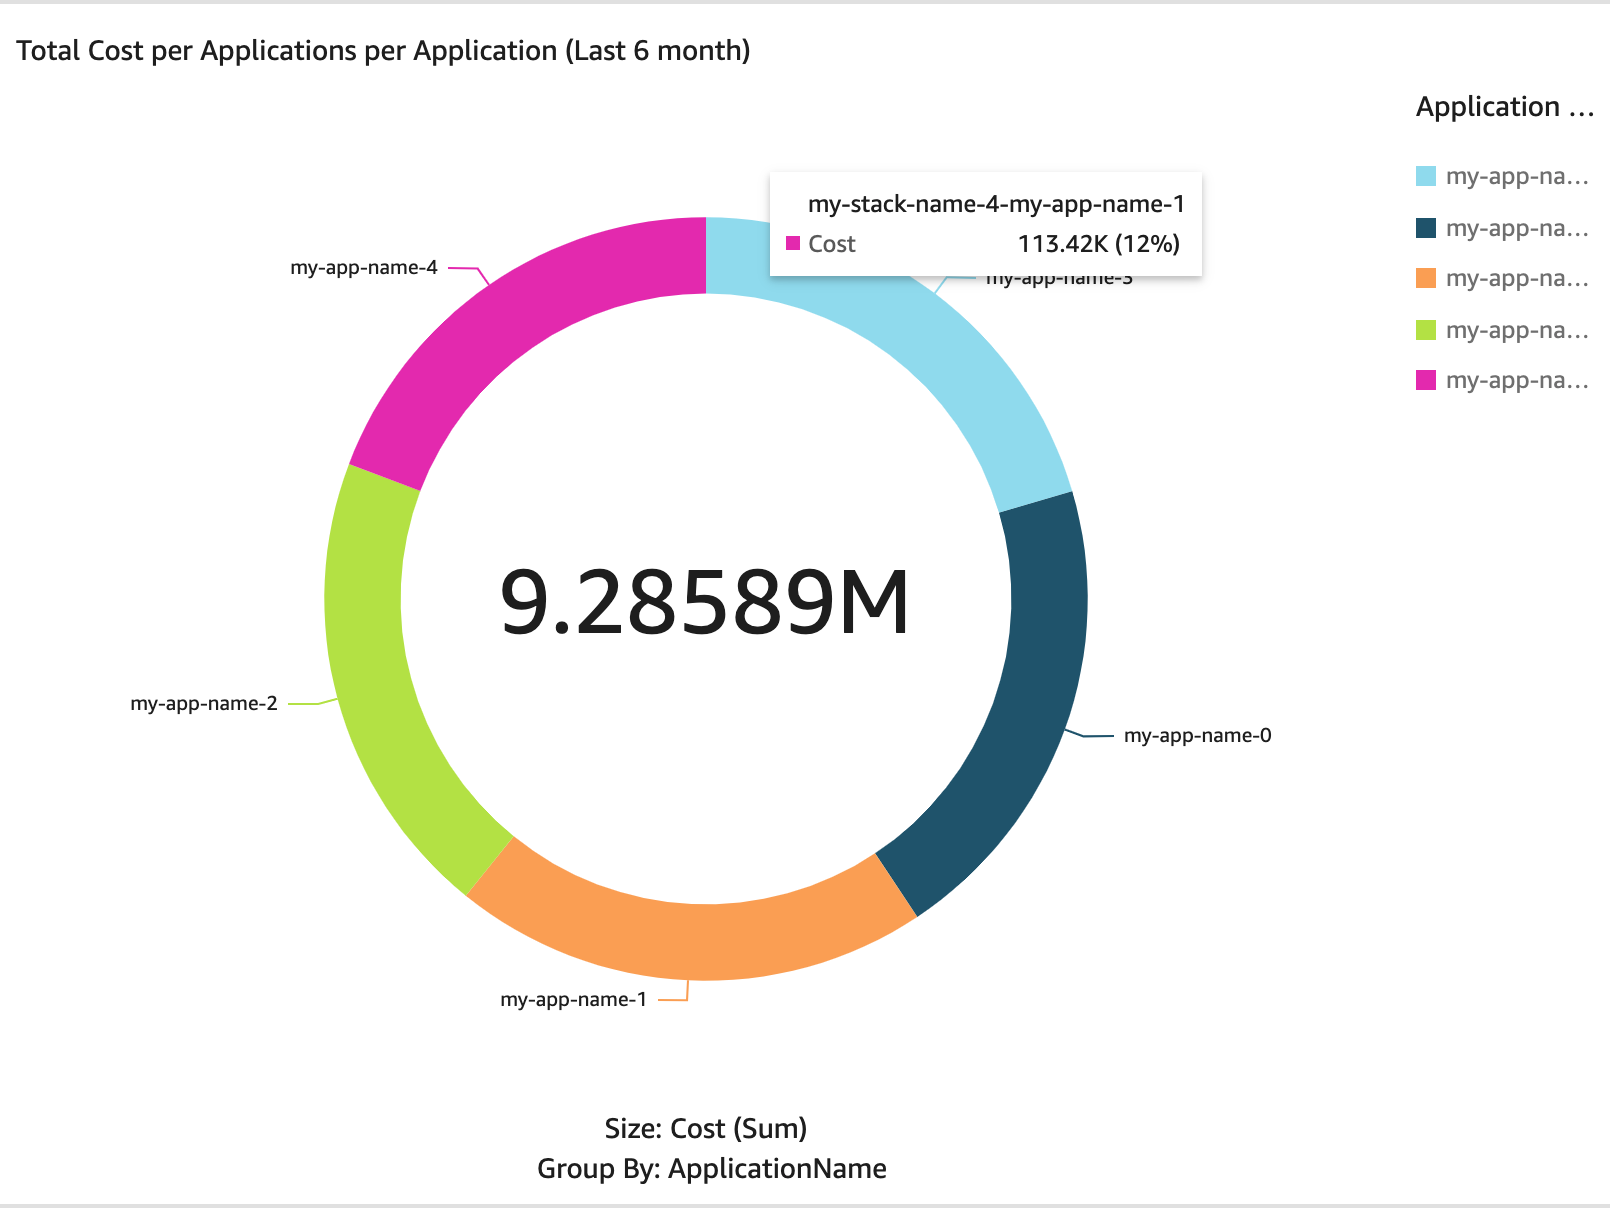
Figure 2: Donut chart – total costs of all applications per application over last six months
To answer the second question, create an Area line chart, grouping by costs and date and filtering by time period. Figure 3 illustrates an example Area line chart.
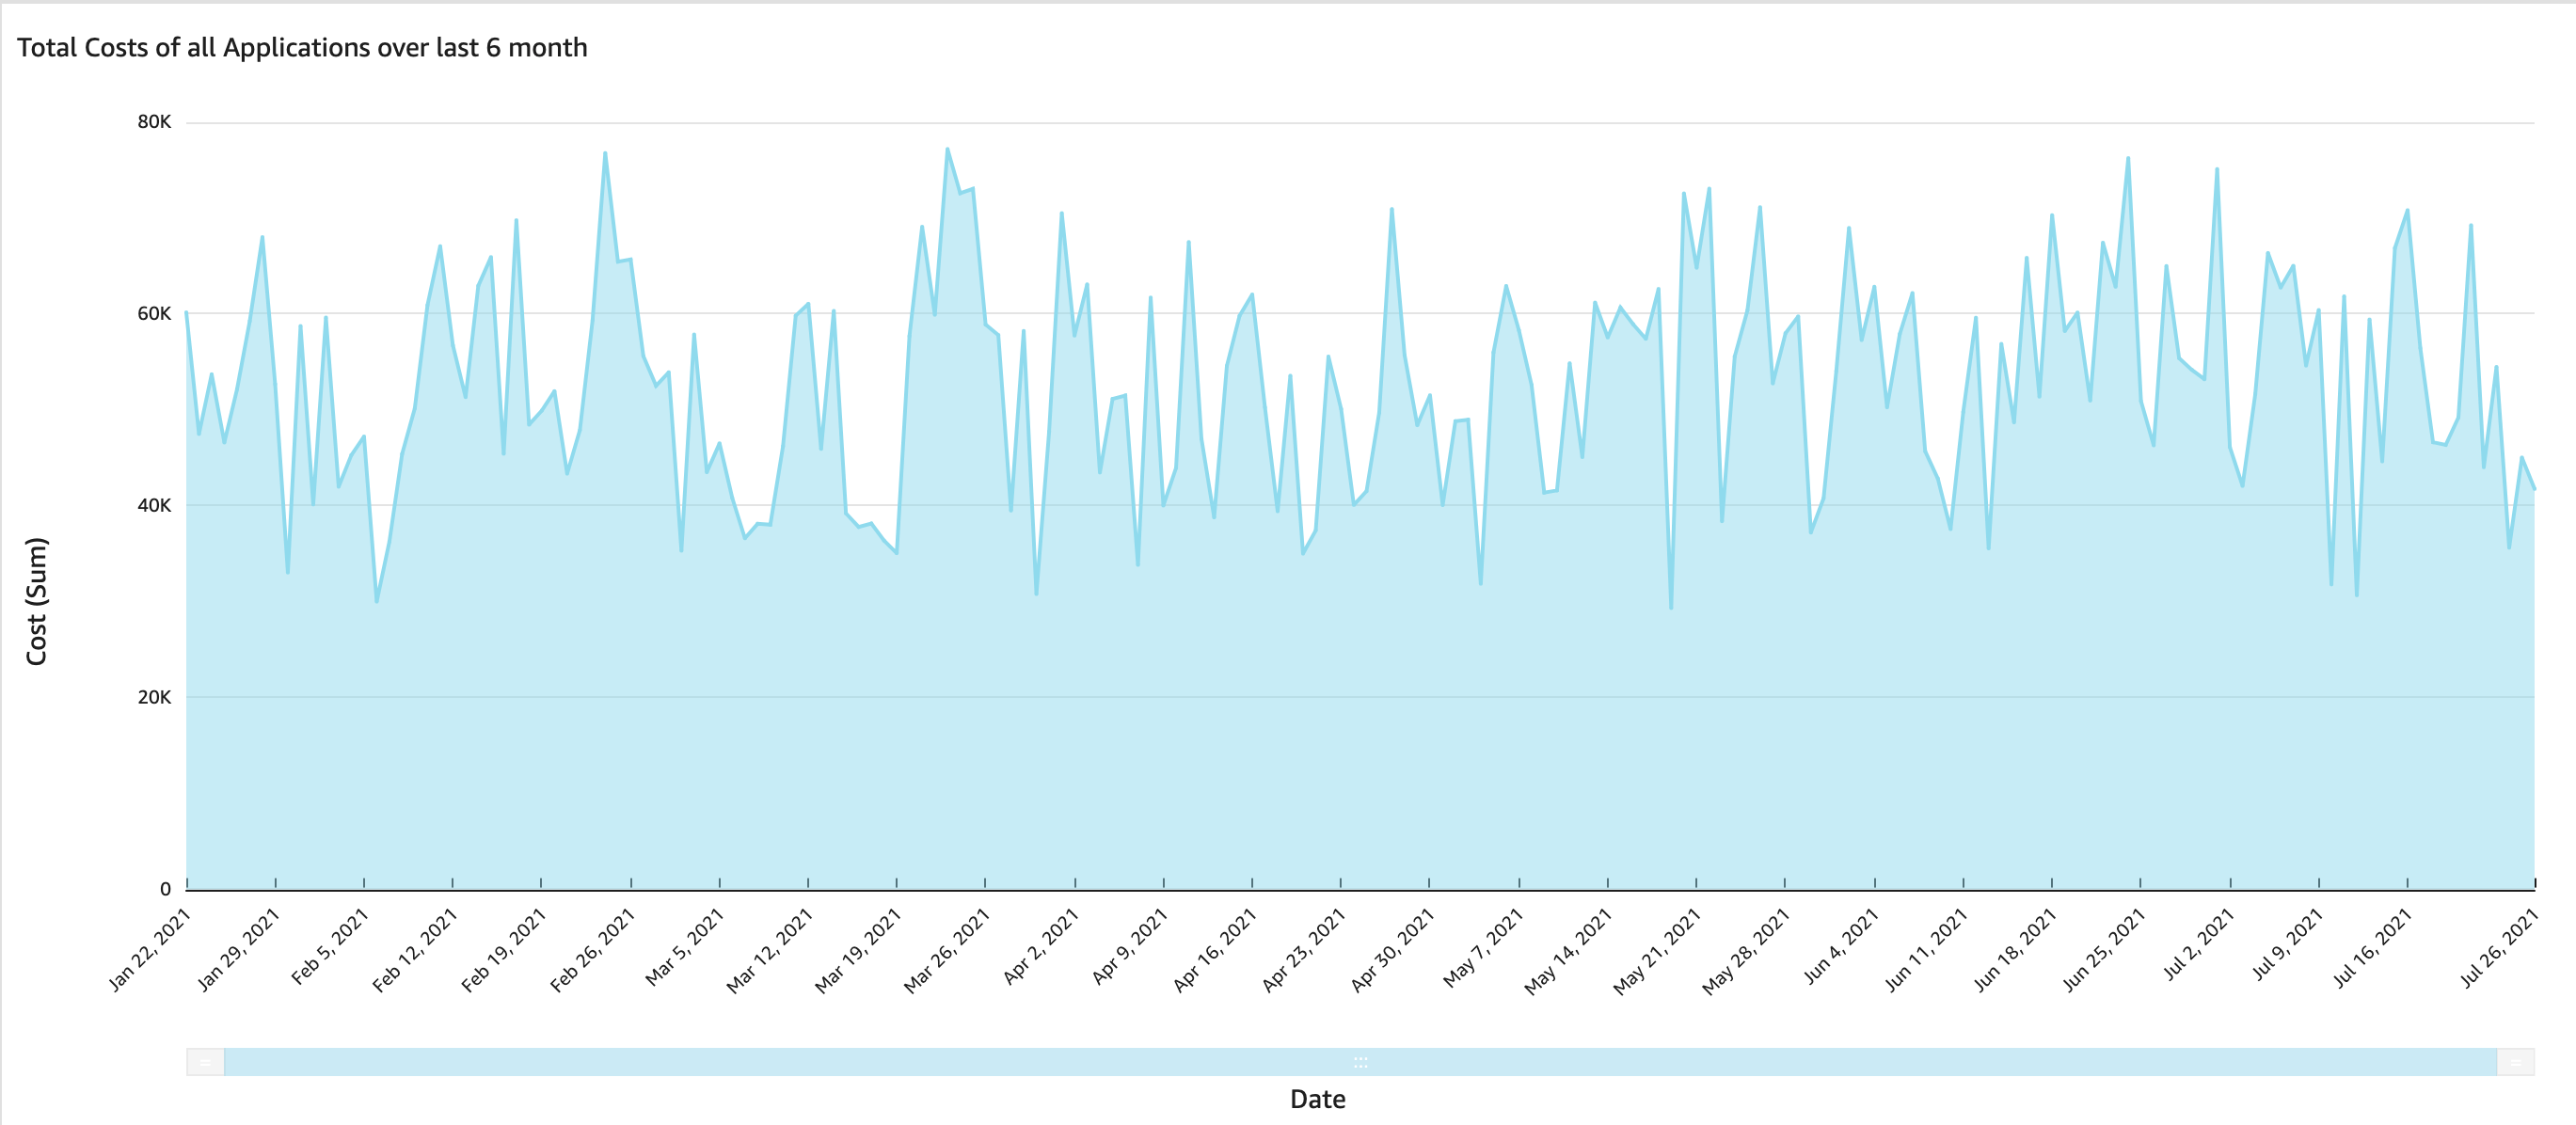
Figure 3: Area line chart – total costs of all applications over last six months
To answer the third question, create a Pie chart, grouping by resource and costs and filtering by time period. Figure 4 illustrates an example Pie chart.
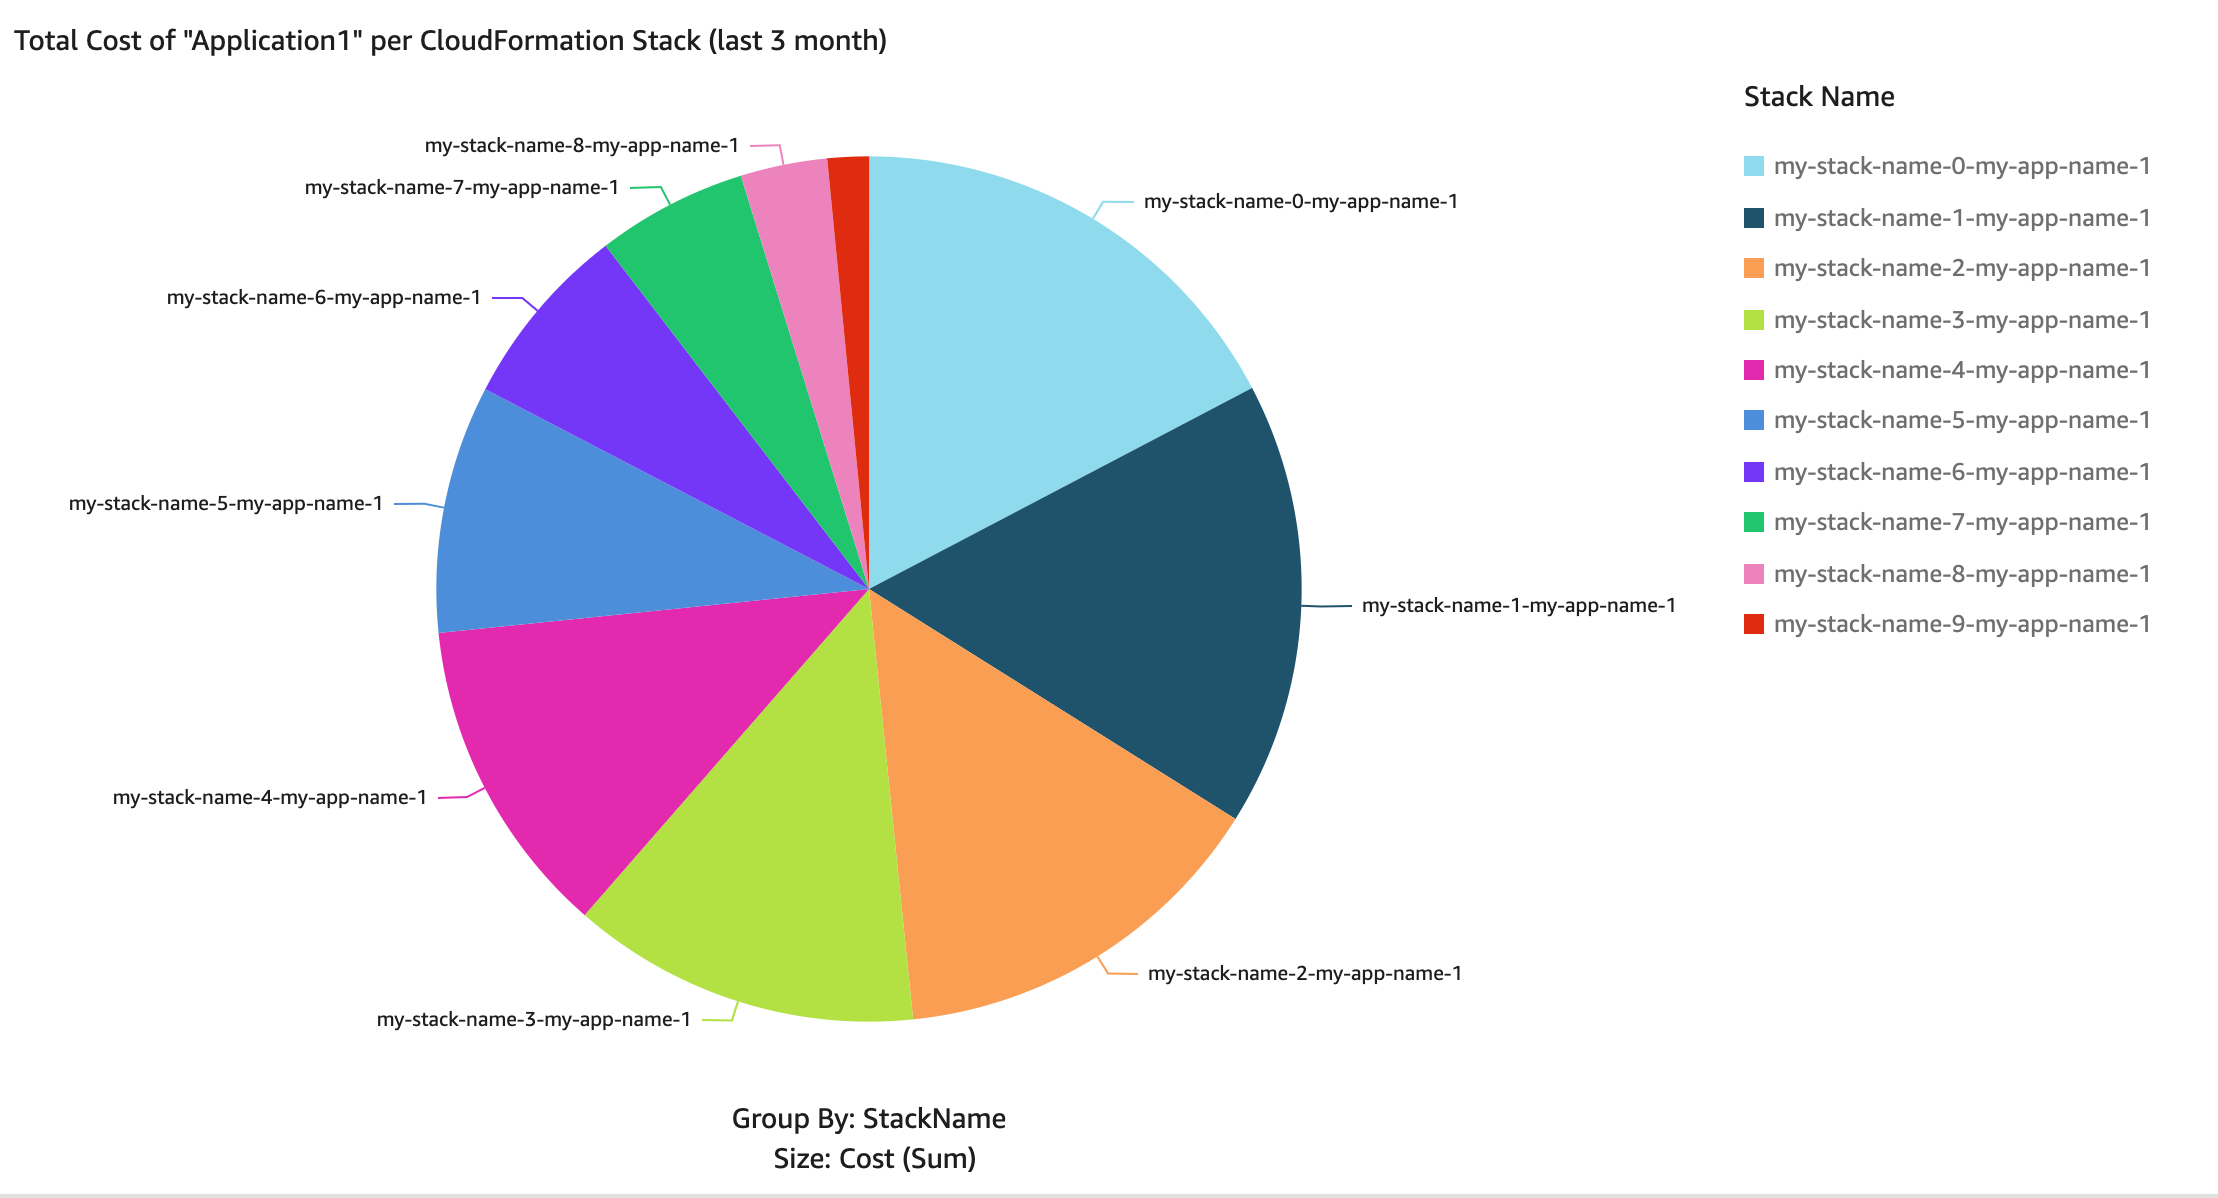
Figure 4: Pie chart – total costs of Applications per Resource over the last three months
Prerequisites
For this solution, you need the following prerequisites:
- Cost Explorer cost allocation tag
aws:cloudformation:stack-idis activated in the Root account. To active this tag, follow the guide Activating the AWS-Generated Cost Allocation Tags.
Note: It can take up to 24 hours for tags to activate. - An existing S3 bucket where data will be stored and utilized by QuickSight to upload data and be used by visuals.
- You’re signed up for a QuickSight Standard or Enterprise subscription. To sign up, follow the guide Signing Up for an Amazon QuickSight Subscription.
- QuickSight has read permissions to the S3 bucket that is the data source. To grant QuickSight with read permissions to the S3 bucket, follow the guide authorize Amazon QuickSight to access your Amazon S3 bucket.
- Free SPICE capacity in the Region where QuickSight resources are deployed. To learn more about your current SPICE capacity, and how to add additional capacity, see Viewing SPICE Capacity and Usage in an AWS Region and Purchasing SPICE Capacity in an AWS Region.
- AWS Region in which QuickSight is offered. To find out which Regions offer QuickSight, see AWS Regional Services List.
Implementation and deployment details
In this section, you create a CloudFormation stack that creates AWS resources for this solution. Next, you create a QuickSight analysis and publish the QuickSight dashboard, To start the deployment process, select the following Launch Stack button.
Note: If your AWS account has a QuickSight enterprise subscription, then you can skip the steps below to create an analysis and publish the dashboard, which are created as part of the CloudFormation stack deployment.
![]()
.
You also can download the CloudFormation template if you want to modify the code before the deployment.
The template in Figure 3 takes several parameters. Let’s go over the key parameters.
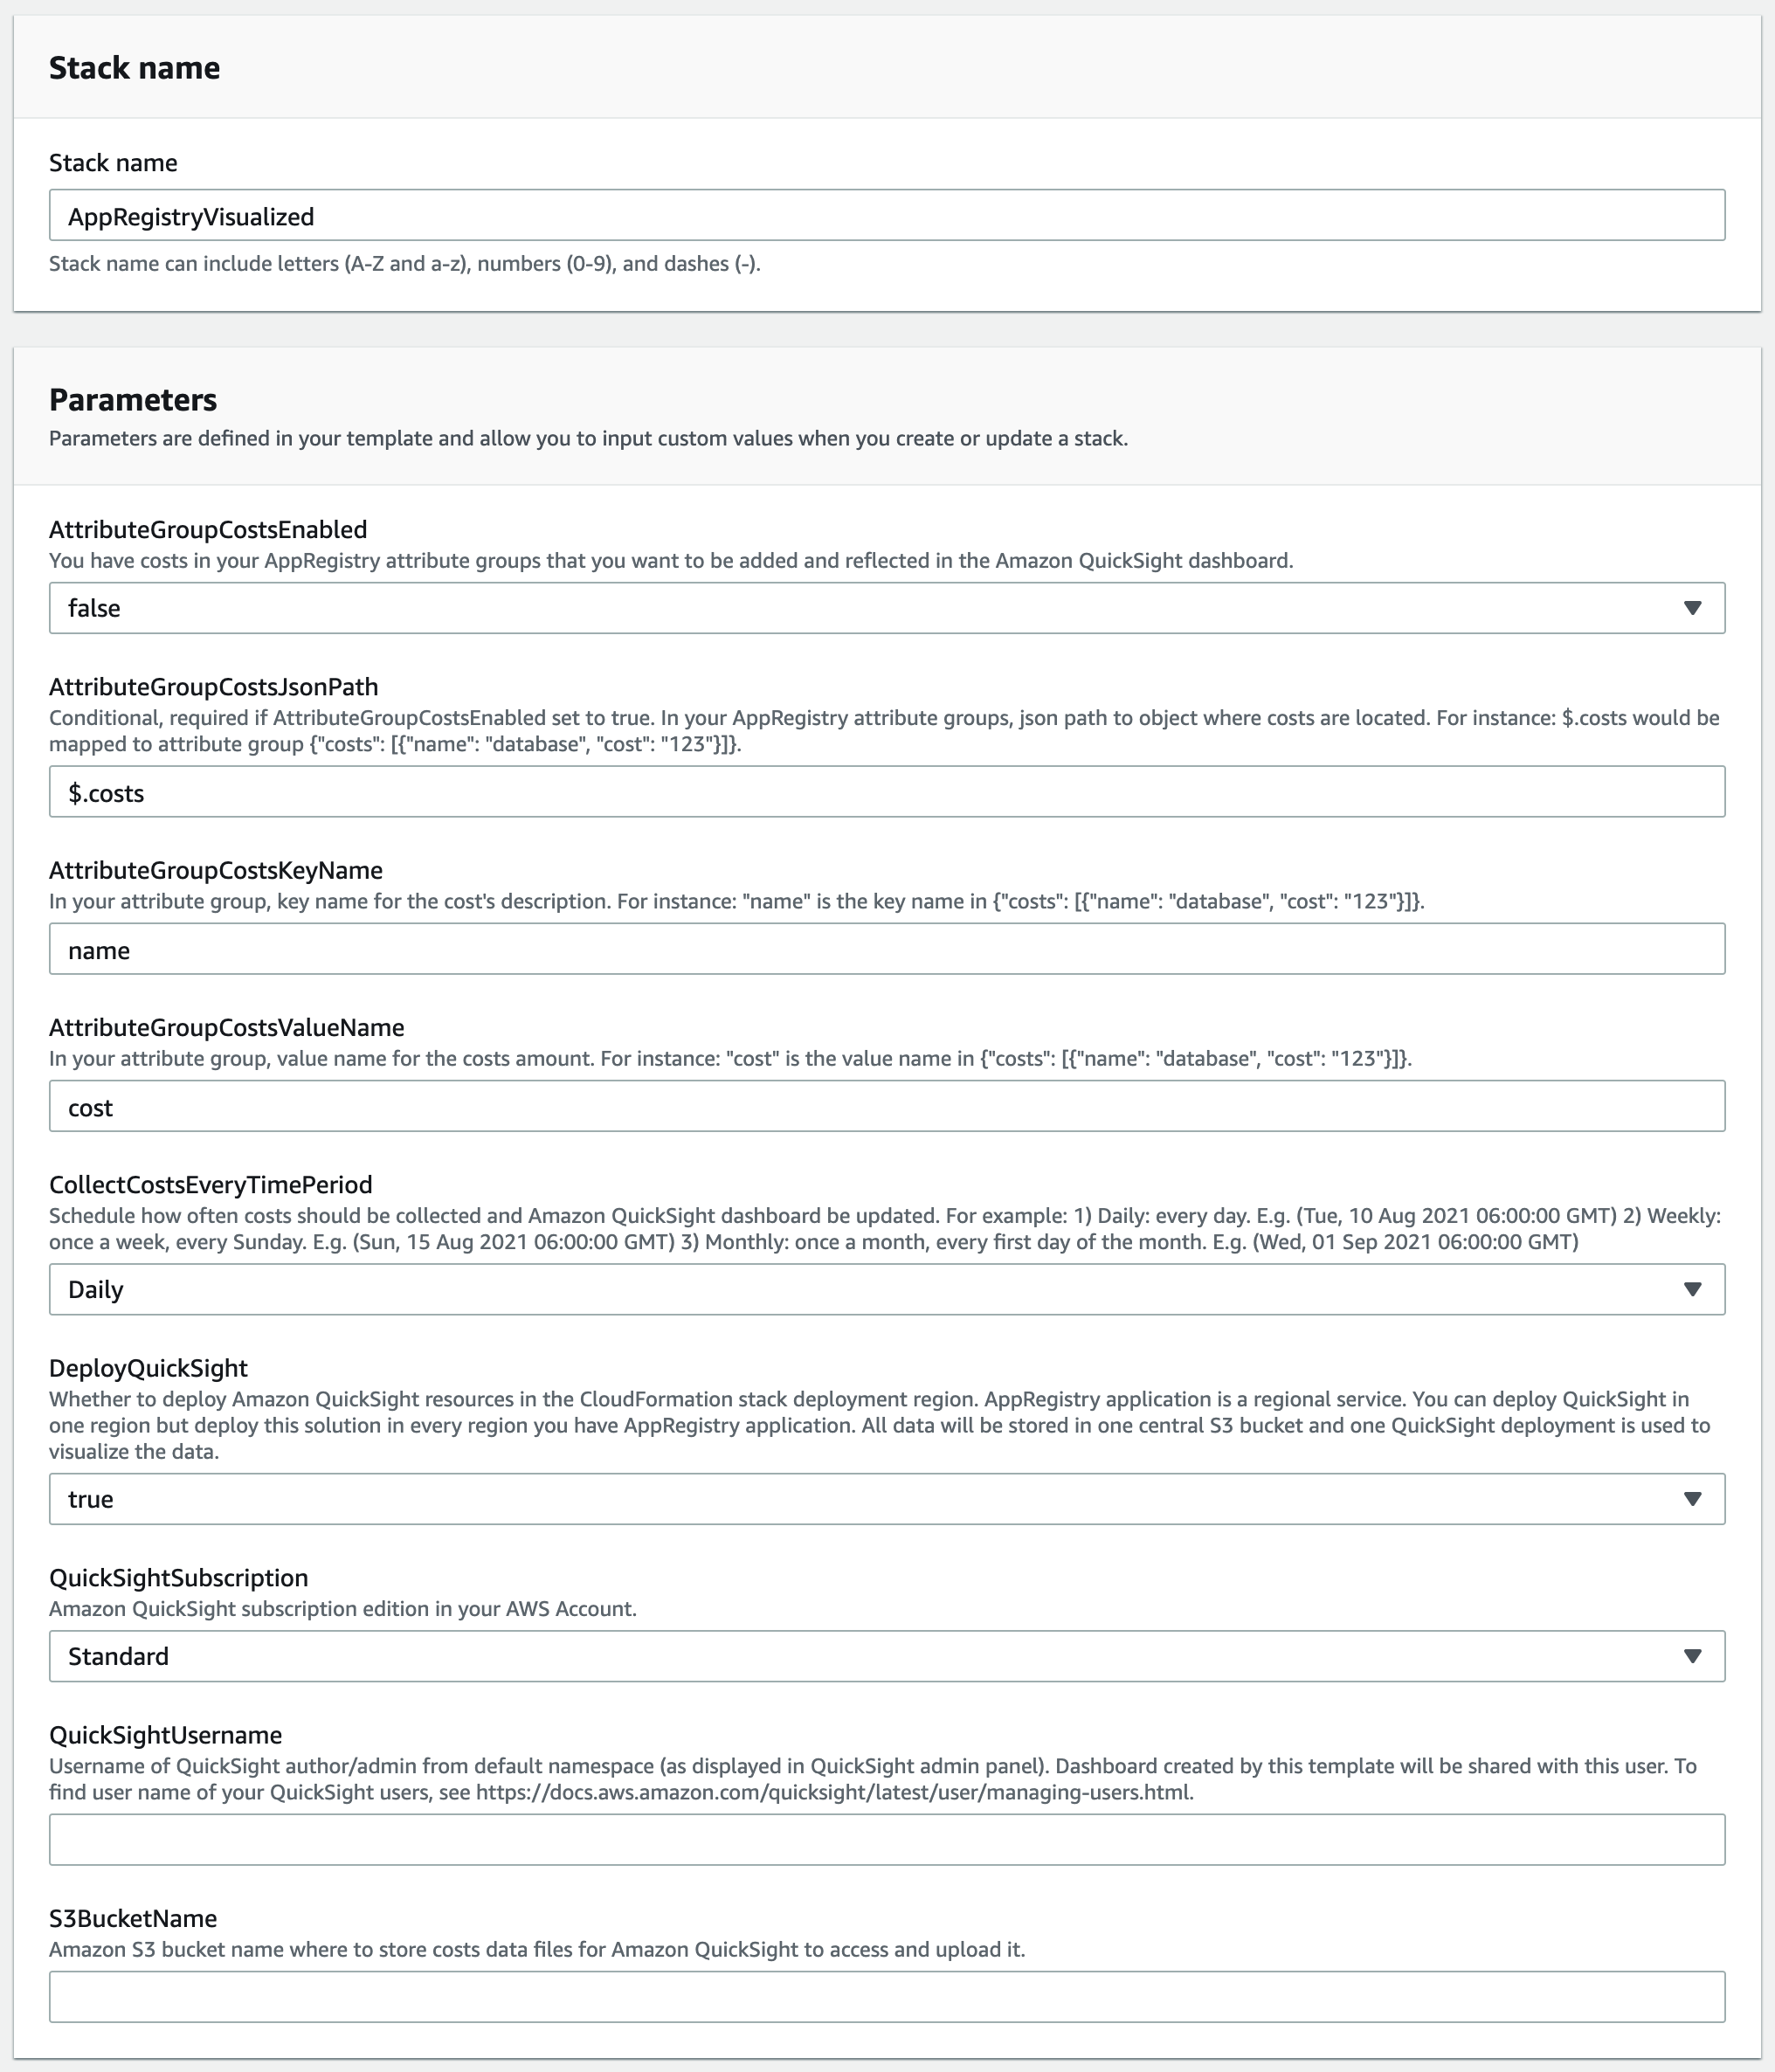
Figure 5: CloudFormation stack parameters
The key parameters are:
- AttributeGroupCostsEnabled: You have costs in your AppRegistry attribute groups that you want to be added and reflected in the Amazon QuickSight dashboard.
- DeployQuickSight: Whether or not to deploy Amazon QuickSight resources in the CloudFormation stack deployment Region. AppRegistry application is a Regional service. You can deploy QuickSight in one Region but deploy this solution in every Region where you have the AppRegistry application. All data will be stored in one central S3 bucket and one QuickSight deployment is utilized to visualize the data.
- QuickSightSubscription: Amazon QuickSight subscription edition in your AWS Account.
- QuickSightUsername: User name of QuickSight author/admin from default namespace (as displayed in QuickSight admin panel). Dashboard created by this template will be shared with this user. To find the user names of your QuickSight users, see Managing User Access Inside Amazon QuickSight.
- S3BucketName: Amazon S3 bucket name where to store costs data files for Amazon QuickSight to access and upload it.
All other input fields have default values that you can either accept or override. Once you provide the parameter input values and reach the final screen, choose Create stack to deploy the CloudFormation stack.
This template creates several resources in your AWS account, as follows:
- EventBridge rule that triggers Lambda function to collect information about current AppRegistry applications.
- Lambda functions to collect, process, and store AppRegistry applications information and associated costs, as well as store this information in an S3 bucket.
- Step Function Workflow that starts the flow of processing the information by using Lambda functions.
- QuickSight resources connecting to the S3 bucket that you specified in the S3BucketName CloudFormation Template parameter as the data source.
Creating QuickSight analysis
Now that the CloudFormation stack is successfully deployed, create an analysis where you create the charts. Follow the steps to create a new analysis:
- Navigate to the QuickSight analysis view, and click New analysis.
- Select the AppRegistryVisualizedS3 dataset
- Click the Create analysis button
Next, create the three visuals as shown above in Figures 2, 3, and 4. If you don’t have any AppRegistry applications at this point, then those visuals don’t show any data, as shown in Figure 6 below. However, overtime every time the scheduler is triggered, QuickSight will pull new data and start showing data in your visuals.
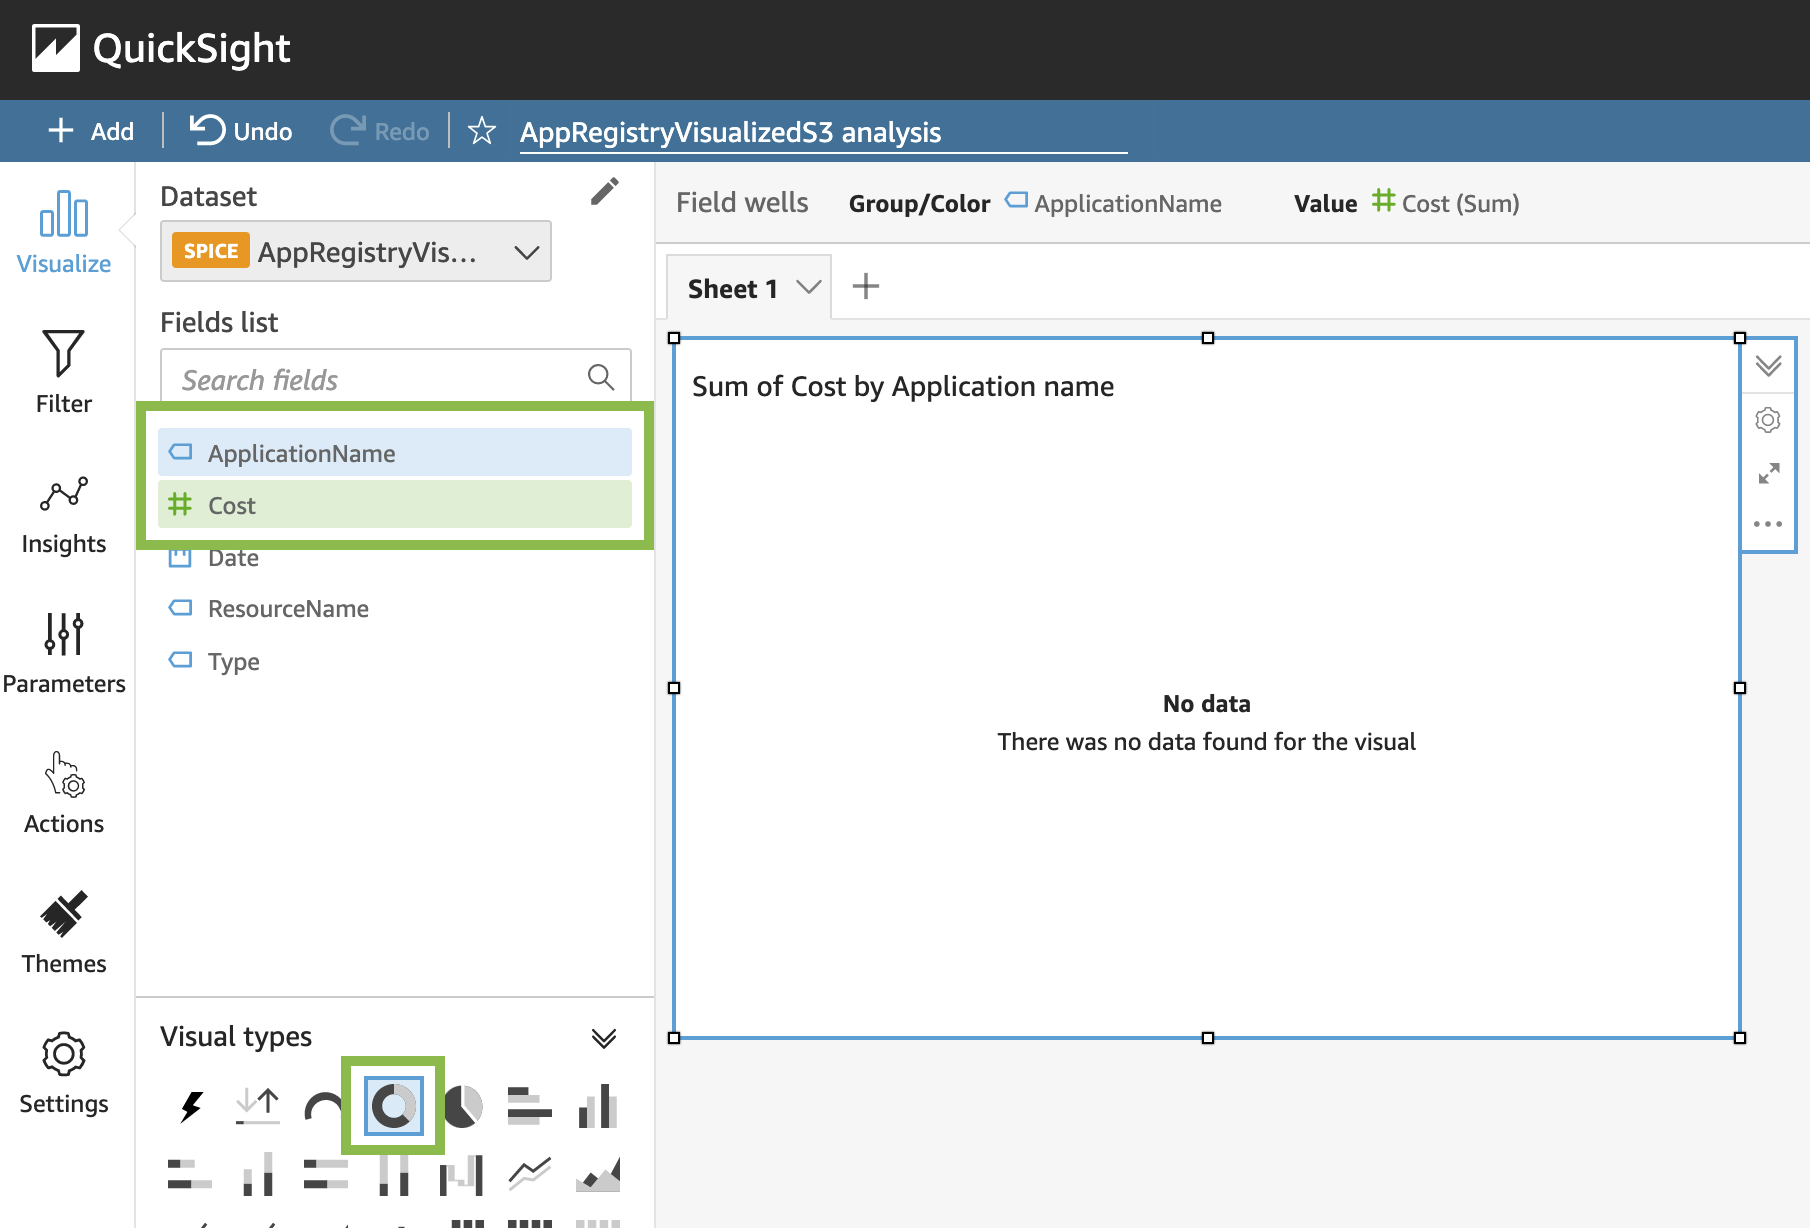
Figure 6: Creating donut chart – total costs of all applications per application
To create a visual showing the total costs of all AppRegistry applications per application:
- In Fields list, select ApplicationName and Cost
- In Visual types, select Donut chart
To create a visual showing the total costs of all applications over time, first click the empty sheet area to deselect the current visual, then:
- In Fields list, select Cost and Date
- In Visual types, select Area line chart
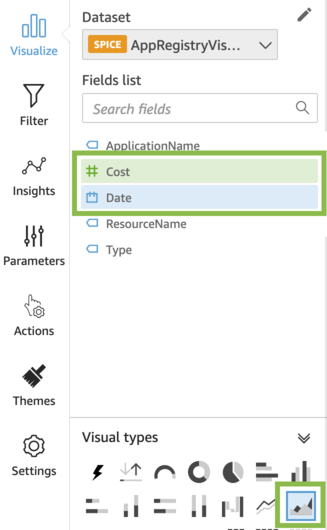
Figure 7: Creating area line chart – total costs of all applications over time
To create a visual showing the total costs of a specific application per resource, deselect the current visual and:
- In Fields list, select Cost and ResourceName
- In Visual types, select Pie chart
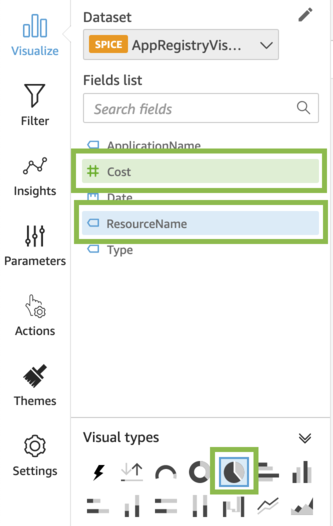
Figure 8: Creating pie chart – total costs of all applications per resource
Publishing QuickSight dashboard
In your QuickSight analysis, you now have three visuals. As a final step, publish a dashboard from this analysis. To publish a dashboard:
- Click Share, and select Publish dashboard
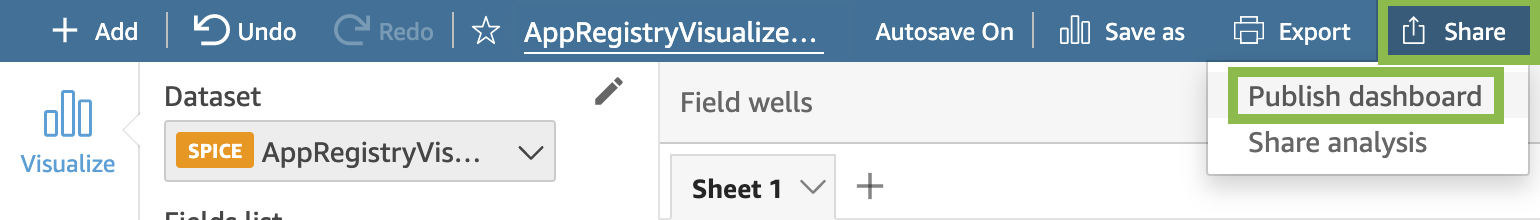
Figure 9: Analysis view – Publish QuickSight dashboard
- In Publish new dashboard as, enter a name for your dashboard
- Click Publish dashboard
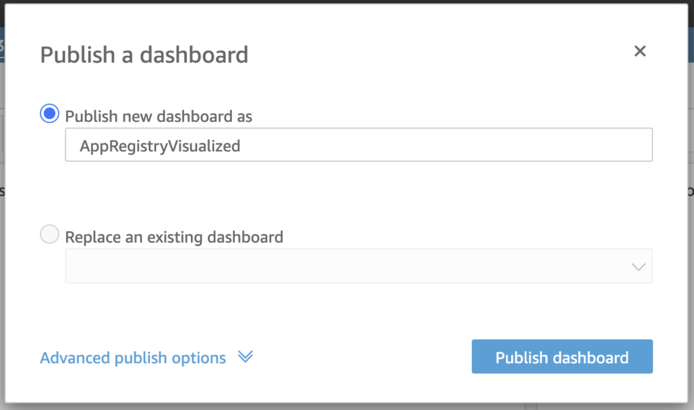
Figure 10: Publishing QuickSight dashboard
- (Optional) Share the dashboard with specific users or everyone in your account
Every time the scheduler triggers the process, a new AppRegistry applications data is collected, stored in an S3 bucket, and the QuickSight dashboard is automatically refreshed and reflects the latest data. When you share a dashboard, you specify which users have access to it. Users who are dashboard viewers can view and filter the dashboard data. Any selections to filters, controls, or sorting that users apply while viewing the dashboard exist only while the user is viewing the dashboard. These aren’t saved once it’s closed. Users who are dashboard owners can edit and share the dashboard. To learn more about QuickSight dashboards, see Working with Dashboards.
Applying filters to QuickSight visuals
Utilize filters to refine the data displayed in a visual. By default, a filter applies only to the item selected when the filter was created. Set the scope of a filter to one or more visualizations. If you need to, you can change the scope of a filter after you create it.
By using filters, you can create visuals that will, for example, show the costs over the last N month, or filter the overall costs to costs of a specific AppRegistry application. To learn more about how to create and manage filters, see Filtering Data.
Clean up
To avoid incurring future charges, make sure to remove the resources you created when you’re done using them.
Conclusion
This post demonstrated how to visualize your applications in AWS using AppRegisty, helping you track applications costs over time, understand the context of your applications and resources across your environments. EventBridge helped you schedule the data collection and QuickSight created the dashboard with several analyses. You can use QuickSight or any other data visualization dashboard to track cost and make decisions on logical groups of AWS services, driving better control and visibility across your organization.