AWS Open Source Blog
Getting started with open source graph notebook for graph visualization
When building connected data applications, such as knowledge graphs, identity graphs, or fraud graphs, developers often need to visualize how the data is connected to be able to communicate insights gained from highly connected datasets. Customers need an easy way to get started with their graph database, insert data, and view the results.
We launched the Amazon Neptune Workbench at re:Invent 2019, and in 2020, we added graph visualization capabilities to the Workbench. We heard from customers that they wanted to use the Neptune Workbench features in other ways, such as to enable fast and easy setup for local testing or to demo a graph problem quickly to stakeholders. AWS is excited to open source Amazon Neptune’s Jupyter Notebook components to help address these needs for the graph community. In this blog post, we’ll provide a brief overview of how to get started with graph notebook.
Graph notebook is now available on GitHub as an open source Python package under the Apache 2.0 license. Developers can deploy graph notebook on a local Jupyter server, Amazon Elastic Compute Cloud (Amazon EC2), or Amazon EMR, in addition to using the Neptune Workbench on Amazon SageMaker. You can get started with the lightweight graph notebook in minutes using the quickstart guides on GitHub. Graph notebook connects to any database that supports either the RDF open standard or the open source Apache TinkerPop framework. This makes graph notebook accessible to open sourced graph databases that provide a SPARQL 1.1 endpoint or a TinkerPop-enabled graph hosted inside Gremlin Server.
Seasoned graph technologists and new developers in the graph space can benefit from the graph notebook. Graph notebook is installed with a “Getting Started” folder of notebooks that guide new graph developers on using SPARQL or Gremlin query languages through magic commands like %%sparql or %%gremlin. Query results can be shown as graph objects with nodes and edges, or as a list of values. For evaluating query performance, the SPARQL and Gremlin query magics can also be used for viewing a query plan or benchmarking a specific execution of a query. Refer to the graph notebook GitHub page for a full list of supported magics and features.
Quickstart
To get started with graph notebook, you will need:
- Python 3.6.1-3.6.12. (Although the versions are not officially tested, graph notebook has worked with Python 3.7 and 3.8 in practice.)
- Jupyter Notebook 5.7.10.
- Tornado 4.5.3.
- A graph database that provides a SPARQL 1.1 endpoint or a Gremlin Server. (If you do not have a graph database, check the graph notebook guide for setting up one quickly.)
Next, open Terminal on macOS or Command Prompt on Windows and run the following commands to install graph notebook locally. We recommend using a Python virtual environment such as virtualenv or venv to isolate the specific dependencies.
# pin specific versions of dependencies
pip install notebook==5.7.10
pip install tornado==4.5.3
pip install gremlinpython==3.4.10

# install the package
pip install graph-notebook

# install and enable the visualization widget
jupyter nbextension install --py --sys-prefix graph_notebook.widgets
jupyter nbextension enable  --py --sys-prefix graph_notebook.widgets

# copy static html resources
python -m graph_notebook.static_resources.install
python -m graph_notebook.nbextensions.install

# copy premade starter notebooks
python -m graph_notebook.notebooks.install --destination ~/notebook/destination/dir

# start jupyter
jupyter notebook ~/notebook/destination/dir
Once Jupyter is up and running, start with the 01-Getting-Started series.

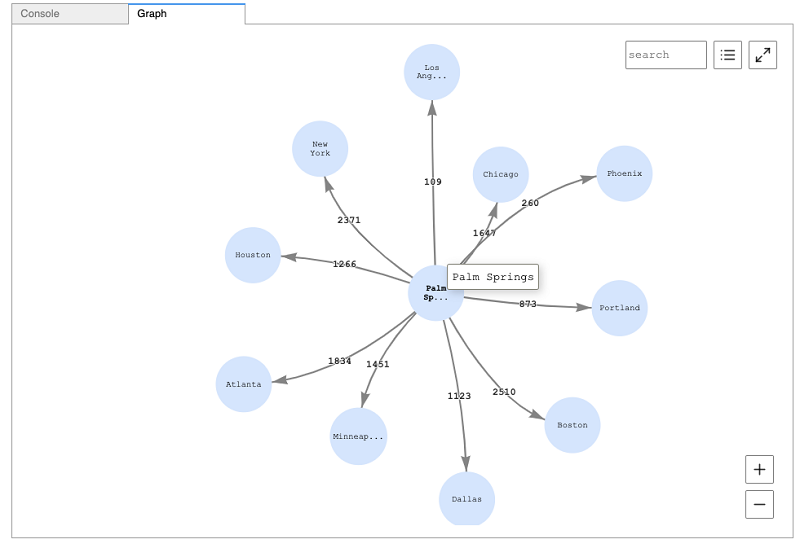
For an in-depth tutorial of Gremlin and SPARQL commands in practice, the blog post “Visualize query results using the Amazon Neptune workbench” provides an excellent walkthrough using air route data and examples. For a hands-on experience, follow along with all the exercises from the article in the Blog Workbench Visualization open sourced Jupyter notebook as well.
Working with Gremlin
Aside from the Gremlin Console, which is a read–eval–print loop (REPL)-style environment, Apache TinkerPop does not provide any advanced analysis or visualization tools for working with Gremlin. Although the Gremlin Console is quite powerful and suits a wide variety of use cases, having a more robust user interface to work with is often helpful. TinkerPop largely relies on third-party community projects to provide such features, and the addition of Jupyter Notebook support for Gremlin offers graph developers and analysts a well-known and proven interface to examine any TinkerPop-enabled graph database hosted in Gremlin Server.
Directions for using the graph notebook with Gremlin Server can be found on the GitHub page and describe a pair of configurations to perform on an out-of-the-box Gremlin Server instance to allow the graph notebook to work with it. Under this configuration, the graph notebook will interface with TinkerGraph, which is a lightweight, in-memory graph database that is part of the TinkerPop project. Confirming that the graph notebook can interface with this minimal configuration is a good way to get started. Success to this point means that simply configuring additional graphs in Gremlin Server is all that is needed to make them accessible to the graph notebook.
Working with SPARQL
Graph notebook can connect to SPARQL 1.1 endpoints, with similar approaches as described above for working with Gremlin Server. Differences in connecting with different SPARQL-capable RDF stores lie with the “endpoint URL,” which can be customized via the %%graph_notebook_config cell magic. Assuming your SPARQL endpoint URL is http://localhost:8888/foo/bar, the configuration would look like this:
%%graph_notebook_config
{
  "host": "localhost",
  "port": 8888,
  "auth_mode": "DEFAULT",
  "iam_credentials_provider_type": "ROLE",
  "load_from_s3_arn": "",
  "ssl": false,
  "aws_region": "us-east-1",
  "sparql": {
    "path": "/foo/bar"
}
If you don’t specify the exact path to the endpoint, it defaults to /sparql. Once this is configured, you can send SPARQL queries to the endpoint via the %%sparql cell magic.
Next steps
Building on open source (Apache TinkerPop) and open standards (W3C’s RDF and SPARQL) is core to growing the graph community. Open sourcing the graph notebook capabilities is just the beginning in creating more opportunities for developers to learn about and interact with graphs. Here are a few ways to get started with graph notebook:
- Download the latest binaries from GitHub. Check out the contributing guidelines.
- Refer to the current list of enhancements and issues and add your feedback.
- If you don’t find a notebook for your use case, build your own sample notebook.
- Share how graph notebook is helping you. Use the hashtag #AmazonNeptune on Twitter.