AWS Storage Blog
Disaster recovery insights with CloudEndure Disaster Recovery Factory
IT disasters can not only disrupt your business, but also cause data loss, impact your revenue, and damage your reputation. CloudEndure Disaster Recovery, offered by AWS, minimizes downtime and data loss by providing fast, reliable recovery of physical, virtual, and cloud-based servers into AWS Cloud. The CloudEndure console gives you granular control over individual machines at a project level. For decision-making purposes, a higher-level overview is required to answer bigger questions. How many machines are replicating at the moment across all projects? What percentage of those machines are in a healthy state? A healthy state means they will launch successfully on AWS with a minimal Recovery Point Objective (RPO) and Recovery Time Objective (RTO).
This blog post introduces a supplementary tool to CloudEndure Disaster Recovery, called the CloudEndure Disaster Recovery Factory. The Factory is a structured collection of additional tooling and functionality designed to take your CloudEndure Disaster Recovery experience even further by delivering broader disaster recovery (DR) intelligence.
What is CloudEndure Disaster Recovery?
CloudEndure Disaster Recovery uses a continuous, asynchronous mechanism to replicate block device data from your source machines, into a staging area within AWS. In an outage, you can have your recovery servers launched and ready for failover within minutes. CloudEndure Disaster Recovery is a cost-effective and scalable solution, with an intuitive interface to allow for simple administration. The RESTful APIs can be leveraged to automate functionality, or provide additional functionality.
To reach a healthy state, the machine’s data must be completely replicated, and the continuous data synchronization must be up to date. CloudEndure refers to this as Continuous Data Protection (CDP). Being healthy requires successfully testing the machine launch at least once. Doing this for one machine is fairly simple, and managing this is also rudimentary. When you have tens of machines, it becomes a little more difficult to control. When you scale to a few hundred or even thousands of machines over several projects, errors are bound to happen. CloudEndure Disaster Recovery Factory sheds light on the areas that are difficult to manage.
Who should use this?
The information gathered by this tool will be useful at multiple levels within your organization. This includes those involved in the DR process, from C-Level executives requesting an overview of the DR plan, to the administrators managing the various stages. External parties, such as auditors looking for evidence of compliance, will also find value in information derived from this tool.
Architecture of CloudEndure Disaster Recovery Factory
CloudEndure Disaster Recovery Factory is deployed solely in your AWS account, as a single AWS CloudFormation stack. It implements Amazon CloudWatch Events to schedule the triggering of an AWS Lambda function. This Lambda function will connect to your CloudEndure Disaster Recovery account, using the CloudEndure APIs. To do this, it needs access to credentials, as a CloudEndure API token, which is stored in AWS Secrets Manager. The Lambda function will retrieve this token and authenticate it with CloudEndure Disaster Recovery. It will then make a series of API calls to gather the data needed. It stores the gathered data in a CSV file, which is stored in an encrypted Amazon S3 bucket. The bucket is stored within your account. Only the Lambda functions involved in this solution, and Amazon QuickSight, are able to access the data in this bucket. Finally, the Lambda function will start an ingestion of the freshly created data by QuickSight.
All elements involved in this solution are restricted by IAM policies, ensuring minimum privilege and access.

Once the data is ingested by QuickSight, it is presented as a QuickSight dashboard.

Prerequisites
To deploy the CloudEndure Disaster Recovery Factory, you must have:
- An AWS account, preferably with administrator permissions.
- A CloudEndure Disaster Recovery account.
- A subscription to Amazon QuickSight Enterprise Edition.
- A QuickSight user with administrator permissions.
- QuickSight access to Amazon S3 must be configured.
- An API token for CloudEndure Disaster Recovery (if you are not an administrator, the data pulled from CloudEndure will only show projects that you have permissions to see).
How to deploy
Details on how to deploy the solution can be found in the documentation.
Dashboard walkthrough
Once the solution is deployed, you can view the data that has been gathered. The data is presented via QuickSight. Once you have loaded your QuickSight console, you will find a dashboard called CloudEndure under the Dashboards section. The dashboard is broken into three sheets.
- Replication Health and Testing
- Recovery Resource Analysis
- Help (briefly covered in section preceding conclusion)
Replication Health and Testing
This sheet graphically presents important data at a glance. I detail each component contained within the sheet, so that you are able to understand its value.
There is a simple Data Collection Time.
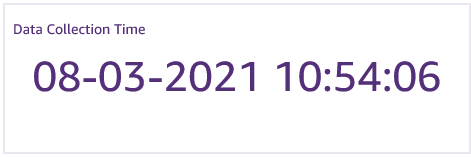
This will give you a quick indication as to when this data was collected. If the data is older than it should be, it could indicate that something has gone wrong in the collection process. You may need to investigate further.
Following this simple component is the Total Machines in CDP.

This expresses the total of all of the machines in the account, alongside the number of those machines in the CDP state. This is then expressed as a percentage as well.
Next to these are two pie charts.
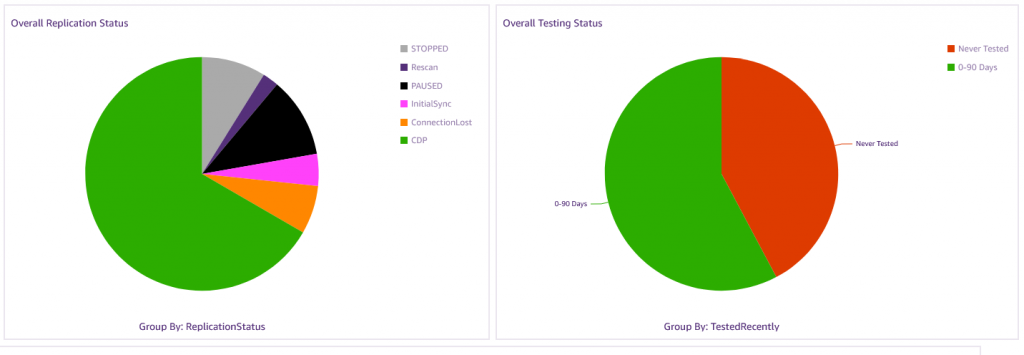
The first pie indicates the Overall Replication Status of the machines in the account, grouped by status. The status includes CDP, Lag, Initial Sync, and others. The ideal scenario is a perfectly green pie, indicating all machines are in CDP.
The second pie indicates the Overall Testing Status. This shows how many machines have been tested in specific time frames. This data is grouped in the following ways:
- Tested in the last three months
- Tested more than three months ago, but in the last year
- Tested more than a year ago
- Never tested
Edit the timeframes to suit your particular business case. For example, you might run testing every six months, as opposed to three. I discuss customizations later.
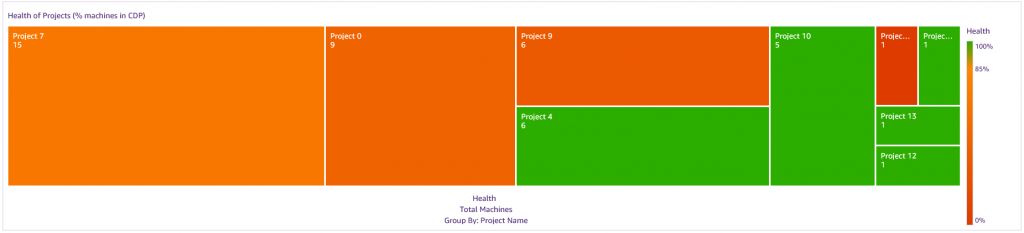
The following screenshot displays a heatmap, which shows each project’s health. The bigger the block, the more machines contained in the project. The color coding indicates what percentage of the machines are in CDP. Green is good, orange is not great, and red is bad. Projects in a green state are in a good position for recovery. You can drill down into each project to see what is happening at the replication status level and the testing level.
Following the heatmap, there are two bar graphs, which help identify which projects need work. . The first bar graph graphically displays a Replication Status Breakdown, grouped by project.
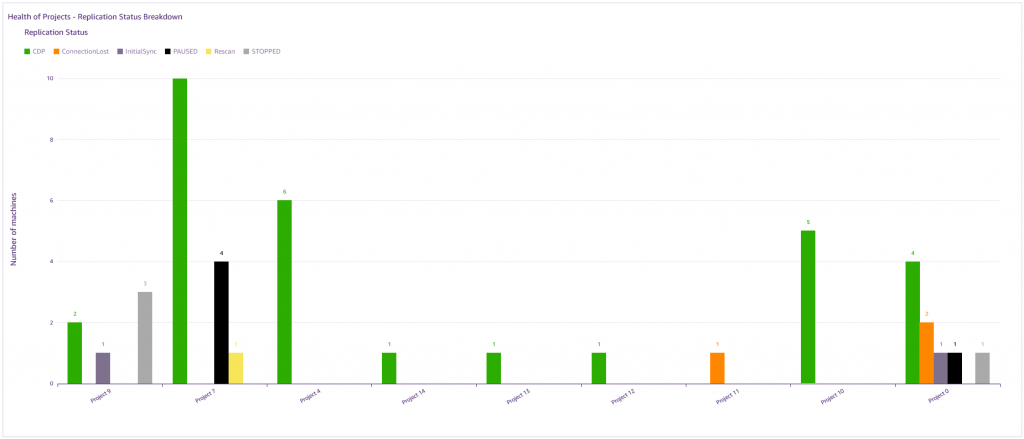
The second graph graphically displays a Testing Status Breadown, grouped by project.

Following the bar graphs is a table, which lists machines that are likely to cause an RPO violation.
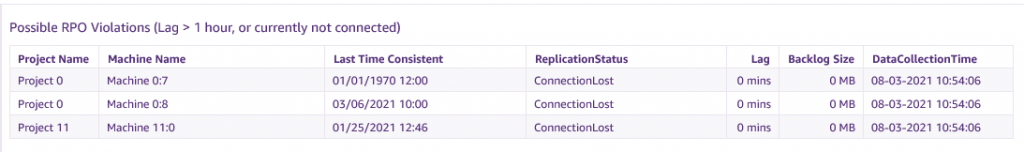
This includes machines with a connection problem, indicating networking errors, or those in a lag state for more than 60 minutes. A lag state means that the machine has not been in a CDP state for a given period of time. If you have a lag of 30 minutes, it means it has been 30 minutes since the machine was last consistent. That means the earliest you can recover to, with data consistency, is from 30 minutes ago. The table includes the machine name, the project it is found in, when it was last consistent, what its current replication status is. It also indicates what the lag is, in terms of time, and how much data it must copy to get back to a consistent state.
The last table lists machines that require testing. This is for all machines that have either never been tested, or were tested more than a year ago. Again, this is customizable to suit your business needs.

The two tables are intended to creation actionable lists, to pass on to the relevant teams for remediation. You can export each table into either a CSV or Excel file.
Recovery Resource Analysis
Having your source machines in a healthy state is great. However, there is still the possibility of delays when failing over into AWS. For example, Amazon EC2 instance limits may be a considerable factor. If you must launch 30 c5.4xlarge instances, and the account has a limit of 20, then 10 of your machines are not going to launch. You would be delayed while you request a limit increase, and the limit increase request itself may be delayed.
The Recovery Resource Analysis sheet gives you a breakdown of the following resources, by Region and per project:
- EC2 instances, by type
- EBS volumes, by type, including sizes, and Provisioned IOPS (where applicable).
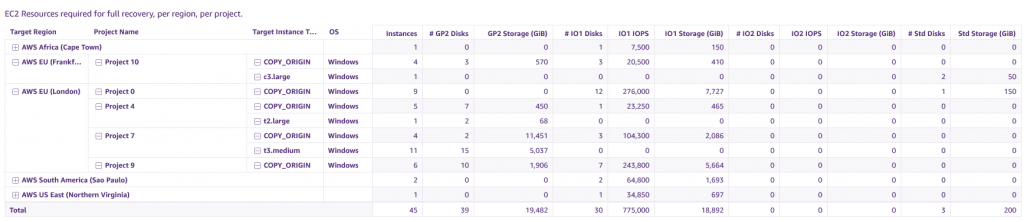
This allows you to get accurate requirements regarding your limits. You can view existing limits, and adjust them if necessary using either Service Quotas or the EC2 limits console.
You can also use this data to get accurate resources requirements from a cost perspective, when failing over. Knowing how much a failover is going to cost you per hour is a great insight when it comes to budgeting for outages.
Cost of running CloudEndure Disaster Recovery Factory
Running this solution, like CloudEndure Disaster Recovery, is inexpensive. Many of the components have variable costing, but the costs tend to be minimal. The following is an example of the costing for a hypothetical environment. It contains 300 source machines, and the data is collected every two hours and published.
| Service | Costing Factors | Cost |
| Amazon QuickSight | Enterprise subscription | $23.00 |
| Amazon QuickSight SPICE * | 1-GiB extra SPICE capacity | $ 0.38 |
| AWS Lambda | Function invocations | $ 0.08 |
| Amazon CloudWatch Events | Scheduled events | $ 0.00 |
| AWS Secrets Manager | 1 Secret | $ 0.40 |
| AWS Systems Manager Parameter Store | 2 parameters | $ 0.40 |
| Amazon S3 | Storage, data transfer, API calls | $ 0.01 |
| Total | $23.87 |
* The additional SPICE capacity is only needed if deploying in a Region that is not the home Region for QuickSight, or your SPICE Capacity is consumed by other datasets.
If the data gathered by CloudEndure Disaster Recovery Factory were obtained manually, it would take several hours. This comes with its own hidden costs, in addition to a predisposition to being error prone.
Additional configuration options
As a tool, CloudEndure Disaster Recovery Factory resides in your AWS account, in totality. None of the elements are visible to AWS. This also means that you can tweak the product, to some extent. This includes downloading and altering the CloudFormation Template to include any extra elements you desire. For example, you may want to alter the bucket policy to include your finance departments IAM group. Or you may add an allowed pattern to the Amazon S3 bucket name, to ensure it complies with your naming conventions. You can use the Lambda functions provided, and add your own functionality.
You can also alter the QuickSight dashboard. For example, you can change the timeframe for what is considered lag to be critical for RPO. Or even alter the colors to suit your branding. To do this, you must create an Analysis from the dashboard.
- Click on the Share button, on the top right of the dashboard.
- Choose Share dashboard.
- On the dialog window, select the Manage dashboard access
- Go to your Admin user, and find the column for Save as.
- Check the dialog box.
- Close the dialog box, and refresh your browser page.
You will see an additional button appear on the top right, called Save as. When you click this button, it asks you what you want to name your new analysis. Once the analysis is created, you can modify the layout, in addition to the fields. You will notice a third sheet on your dashboard called Help. On this sheet is a documentation link with a list of all of the calculated fields you can modify. Once you have finished your modifications, you can publish a new version of the dashboard, or override the old one. Note that overriding the original dashboard is not recommended. An update operation on the Factory CloudFormation stack regenerates the original dashboard, which will override your changes.
Conclusion
CloudEndure Disaster Recovery, backed by the right expertise, makes disaster recovery far less daunting. Using CloudEndure Disaster Recovery Factory allows you to make clearer, data-based decisions, regarding various aspects of your DR and business continuity plans. Visit the CloudEndure Disaster Recovery page to learn how to get started. Additional information regarding the CloudEndure Disaster Recovery Factory can be found in the official CloudEndure documentation.
If you have questions or comments, let us know in the comments section, or you can reach out directly.