Networking & Content Delivery
QoS Observability for OTT Streaming using Amazon CloudFront
About QoS in OTT World and its importance
In today’s digital era, the widespread availability of high-speed internet and an expanding range of streaming devices have made over-the-top (OTT) content an integral part of our daily lives. However, making sure of quality of service (QoS) for OTT content is a significant challenge for both content providers and consumers due to the abundance of choices. The International Telecommunication Union (ITU) distinguishes between QoS, which focuses on network management and guarantees, and Quality of Experience (QoE), which assesses subjective user satisfaction. Achieving an excellent quality experience involves the consideration of a broader set of factors beyond network performance. To manage QoS and QoE effectively, operators must monitor key industry-level metrics, such as rebuffering and video playback failures for QoE and HTTP error codes, latency, and cache hit rate for QoS. This ongoing effort aims to improve observability and enhance the QoS aspect of OTT delivery, with Amazon CloudFront being a focal point of exploration.
In our previous posts, we discuss improving QoE visibility with a solution for CMCD. Continuing our effort to improve observability to our customers, in this post we delve deeper into the QoS aspect of OTT delivery with CloudFront.
About this post
In this post we walk you through deploying a real-time Dashboard that improves your Media Observability in your asset delivery during large scale events or for 24*7 linear streams. Using the CloudFront real-time logging capability, this solution offers near to real-time visibility into the delivery performance indicators. This can be utilized to expand your observability into different aspects of video delivery components.
The CloudFront Video Asset Delivery Dashboard captures metrics related to streaming resolution and video assets. The dashboard takes into account the most commonly used video resolutions. By analyzing the data for each resolution, the dashboard can help you identify performance trends and make data-driven decisions that can improve the overall quality of viewers’ asset delivery. With this information, customers can optimize their streaming infrastructure to provide the best possible viewing experience for the audience.
We have also further partitioned these metrics into manifests and segments, where the logic built into the workflow is considering two common video formats: HLS and MPEG-DASH.
Architecture
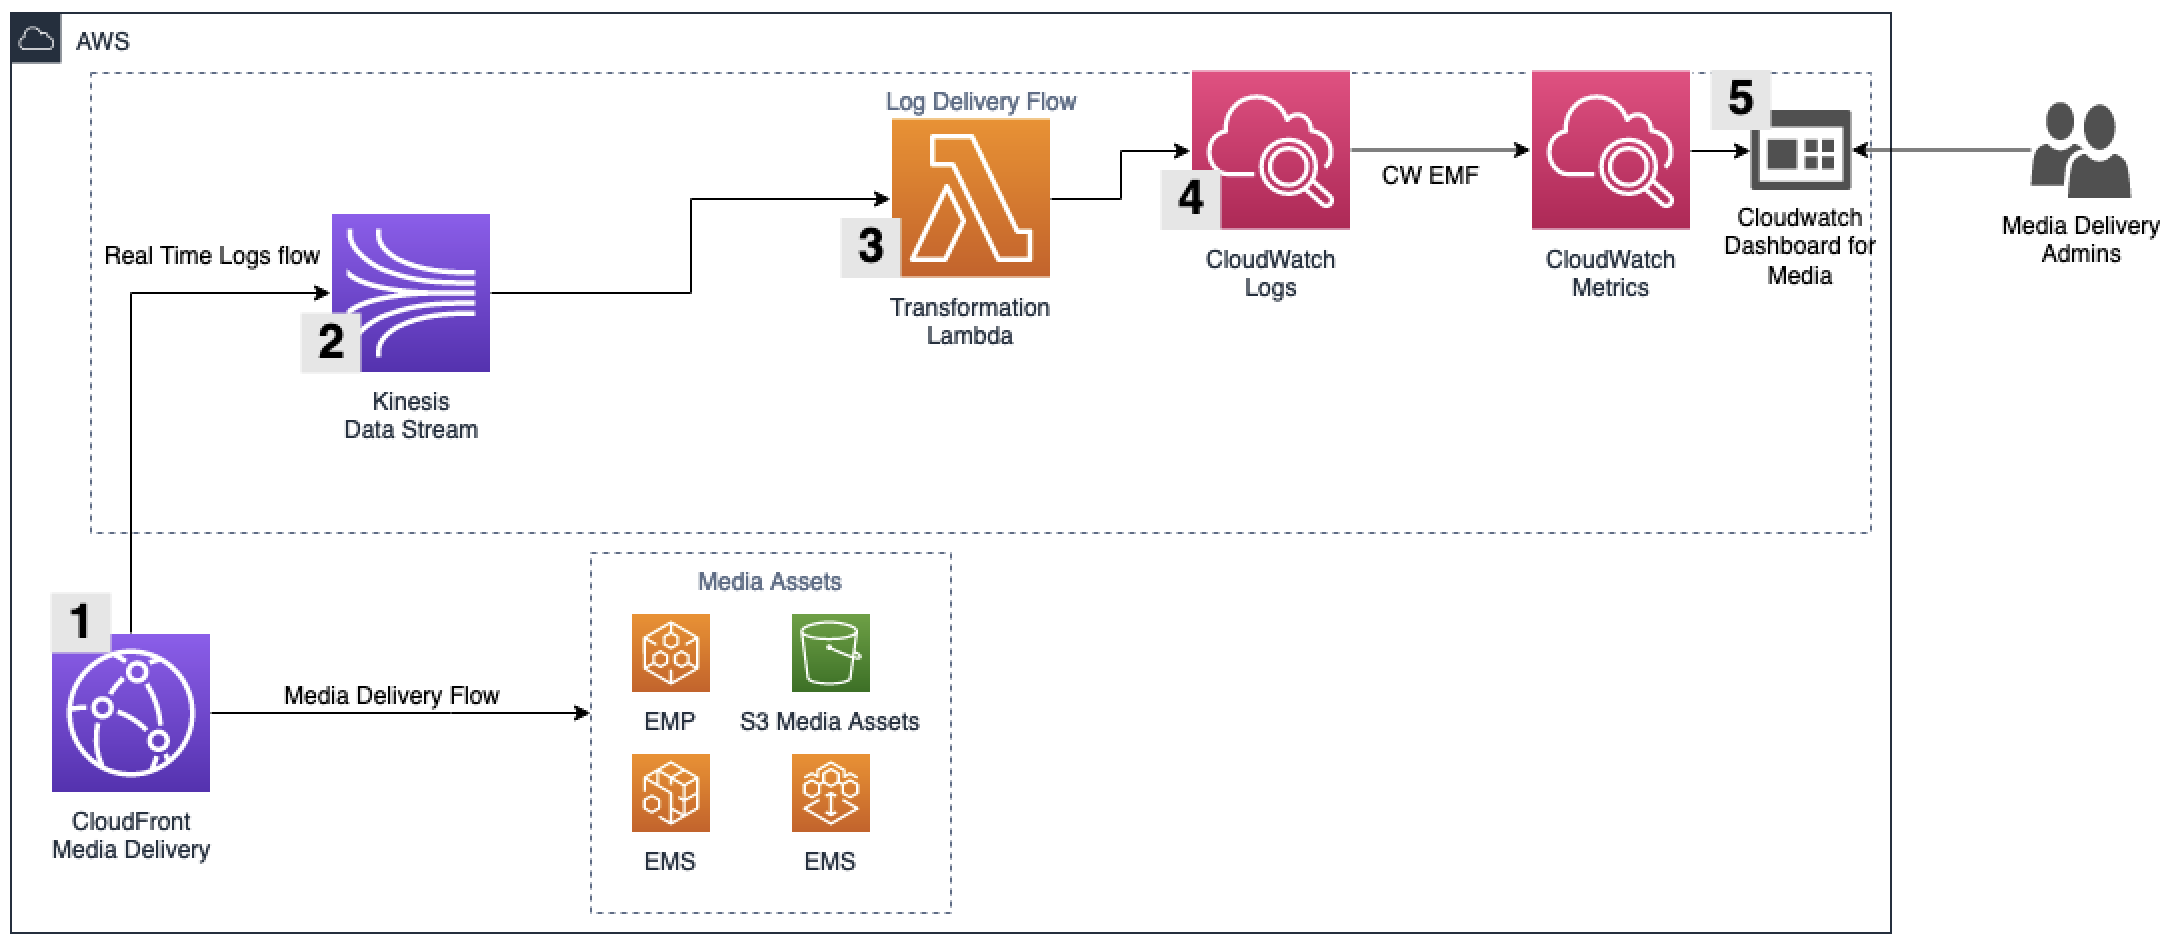
The following architecture is used to deliver the metrics that are required to build the CloudFront Video Asset Delivery Dashboard, as shown in this image:

Figure 1: Overall Solution Architecture
Customers streaming video content already have a CloudFront Distribution delivering video assets to users. With that in mind, the dashboard can be plugged into the current media delivery flow, and metrics start to populate to the Dashboard. Components of the architecture to build the Dashboard are described as follows:
1- CloudFront real-time logs: This is the real-time logs configuration, which is required for CloudFront to provide details about each request in near real-time. To reduce the amount of data generated, which helps control costs and performance, the fields on this configuration have been specifically chosen to provide just the required information to populate the Dashboard. If further information is required for troubleshooting or other use cases, then we recommend leveraging CloudFront Standard Logs. Moreover, if fields must be added to the real-time log configuration, then customization of the code in the AWS Lambda function would be required to handle the extra fields. The fields currently being used are as follows:
- timestamp
- sc-bytes
- sc-status
- cs-uri-stem
- time-taken
- x-edge-result-type
- asn
For more details about the information each field adds to the logs, refer to this CloudFront documentation.
2- Amazon Kinesis Data Streams: This is the initial service into which CloudFront pushes logs. The real-time logs configuration on CloudFront has been set up with the fields that are required for the Dashboard to be built and with the Kinesis Data Streams as the destination.
3- Transformation Lambda: Data is received from Amazon Kinesis in batches and this Lambda runs the code, which breaks the data from the real-time logs apart and creates the metrics required by the Dashboard.
4- CloudWatch Logs/Metrics: To make this more cost-effective, the flow uses CloudWatch Embedded Metric Format (EMF) to publish the metrics. The usage of EMF provides savings because we avoid making PutMetric API Calls. The log group to which metrics are sent should keep data for up to 30 days.
5- CloudWatch Dashboard for Media: Here is where the Media Delivery Administrators and operations team monitoring the media delivery can analyze and review the metrics for their media assets delivery.
Prerequisites
The following prerequisites are required before continuing.
- Users using this solution should have a unique identifier per asset type (HD/UHD/nonHD) integrated into the URL for each asset type. In most cases, customers create a file structure for their video assets based on their resolution. Furthermore, they apply the same structure in their HTTP URLs. For example, if they are streaming Ultra-High Definition (UHD) content, they may use a unique identifier, such as ‘soccer_match_uhd’ or the resolution itself, ‘3840×2160,’ as part of the URL. Note that this solution is based on URL parser and any identifiers in Query String won’t work with this solution.
- This solution is designed to seamlessly integrate with the customer’s existing video workflow. The user should be utilizing a CloudFront distribution to deliver their assets as part of their video workflow.
Solution metrics deep dive
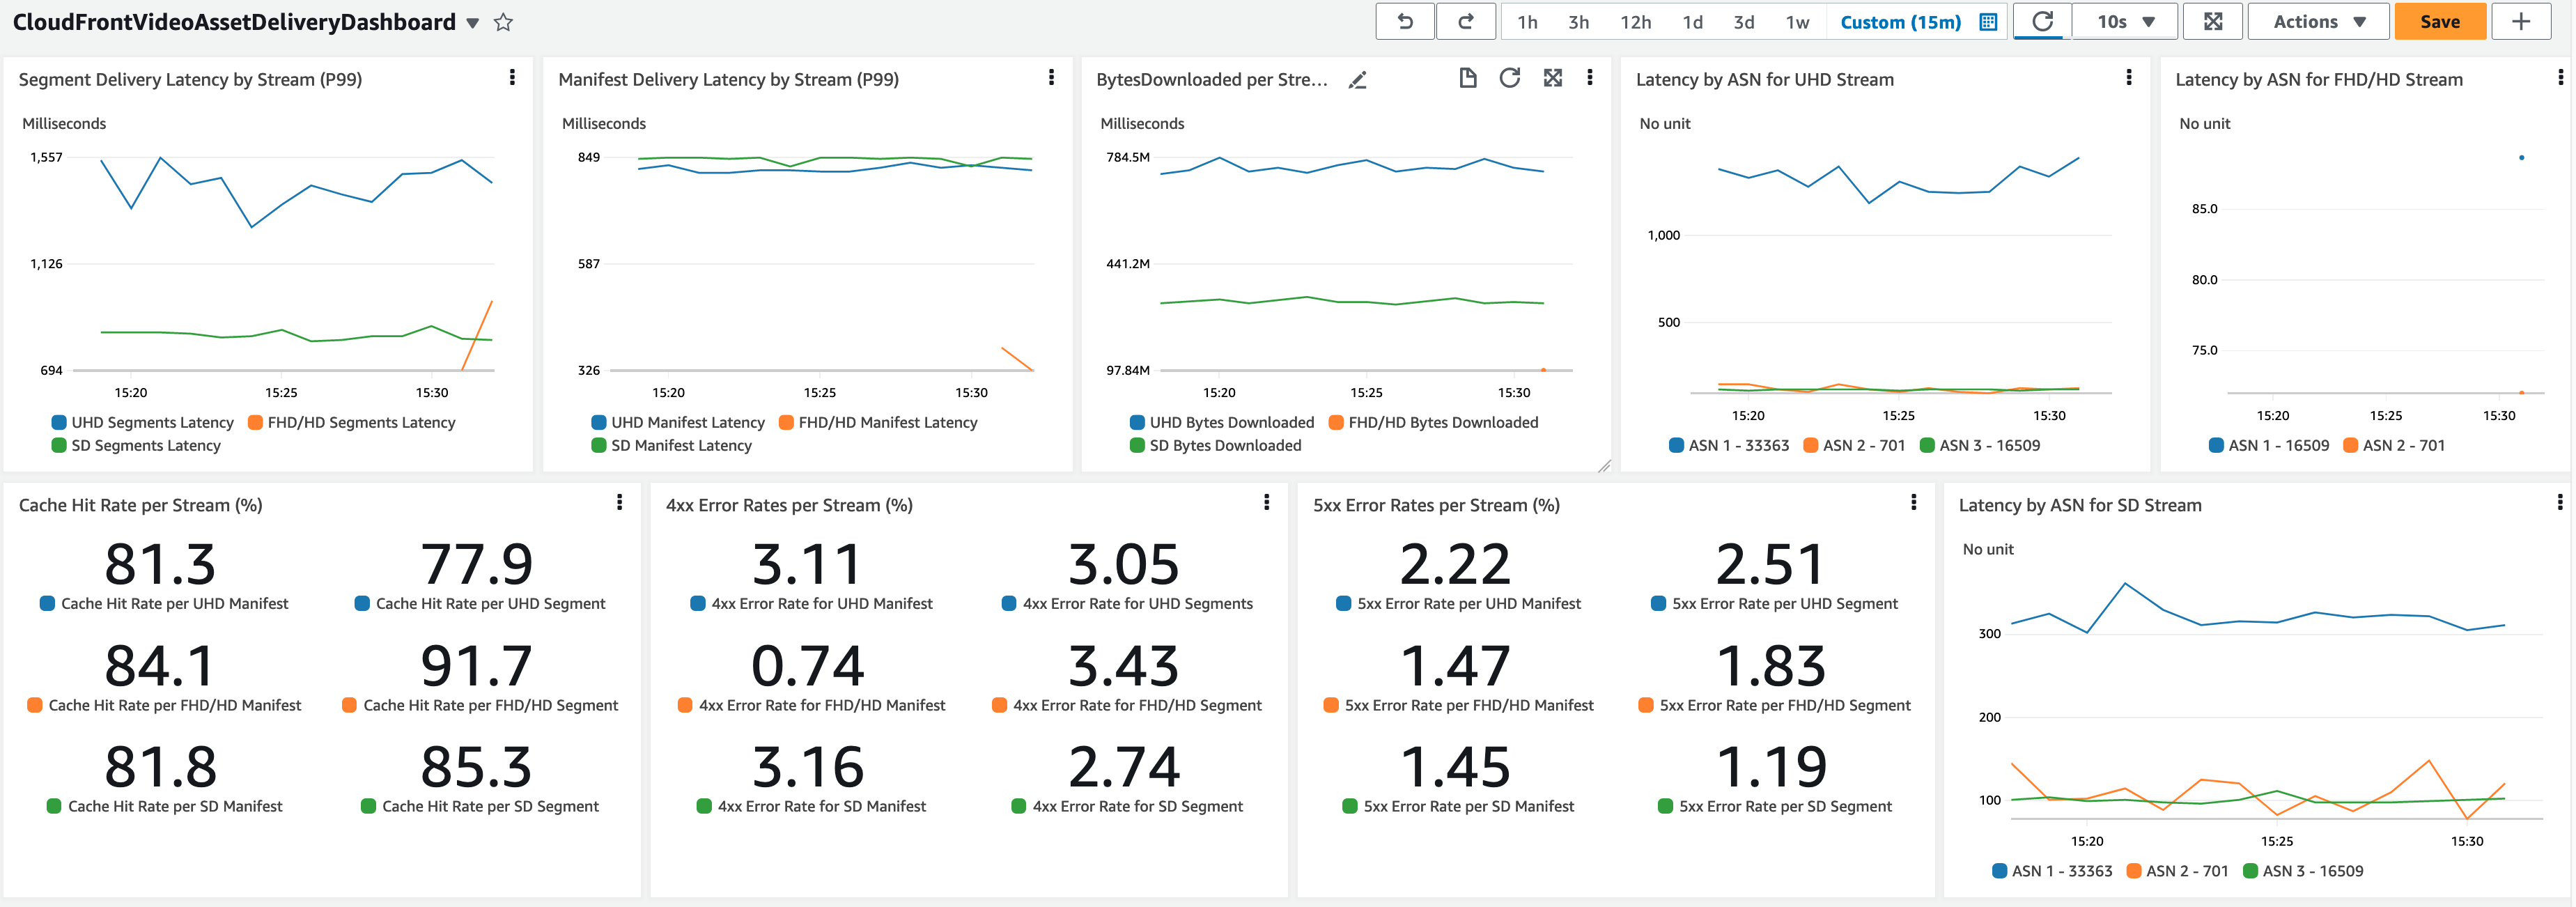
In this section we go over the metrics available and their meaning. The following image shows the working dashboard.

Figure 2: Dashboard Metrics View
Ledgers understanding:
- UHD: UHD stands for Ultra-High Definition, which refers to a video resolution that is significantly higher than standard high definition (HD) resolution. UHD typically has a resolution of 3840×2160 pixels.
- FHD/HD: HD stands for High Definition and refers to a video resolution that is significantly higher than the resolution of standard definition (SD) video. HD typically has a resolution of 1280×720 pixels (720p). FHD refers to Full High Definition 1920×1080 pixels (1080p), and in the current industry HD is sometimes is used to refer to both resolutions. Therefore, we have grouped them together to keep the dashboard concise.
- SD: SD stands for Standard Definition and refers to video resolutions that are lower than the HD standard. Typically this refers to 480p and lower resolutions.
Segment/manifest delivery latency by Stream: This provides the latency data of the content being served to viewers. This metric is also broken down by manifest and segment files and by stream delivery type. This one is showing the total latency from the time the request was received by CloudFront until the content was served back to the viewer.
BytesDownloaded per Stream: This is designed to help the Admin understand how the content being streamed is split among each stream type. Then, this can be used to understand the behavior of the viewer base and also provide inputs regarding which content quality provides more revenue or needs more attention to improve the overall delivery quality among different use bases.
Latency by Autonomous System Number (ASN): This metric shows the time-taken for content to be requested and served by CloudFront. It’s broken down by the Top 10 ASNs and by resolution. This metric can help identify if there is a challenge at a specific ASN, which can help pinpoint to latency problems within the streaming delivery. These specific metrics are provided through queries, and with that only the last three hours of data is presented.
Cache Hit Ratio metrics: These are the Cache Hit Ratio metrics for the delivery of manifest and segment files. These are designed to help the monitoring team spot potential improvements that can be made on caching for these types of content. Normally we would like to see Segments with a higher Cache Hit Ratio, so that we know content is being served from as close to users as possible. This is broken down by each resolution delivery as indicated by their titles.
4xx/5xx Error Rates per Stream: This metric shows the error rate broken out by stream type. This helps with the understanding about the rate in which requests are getting errors by stream. Therefore, troubleshooting can take place quickly based on the stream type in the case that rates go up.
Deployment steps
To deploy this dashboard, we have prepared a CloudFormation template that deploys all required resources.
Step1: Go directly to the CloudFormation Console to deploy the template.
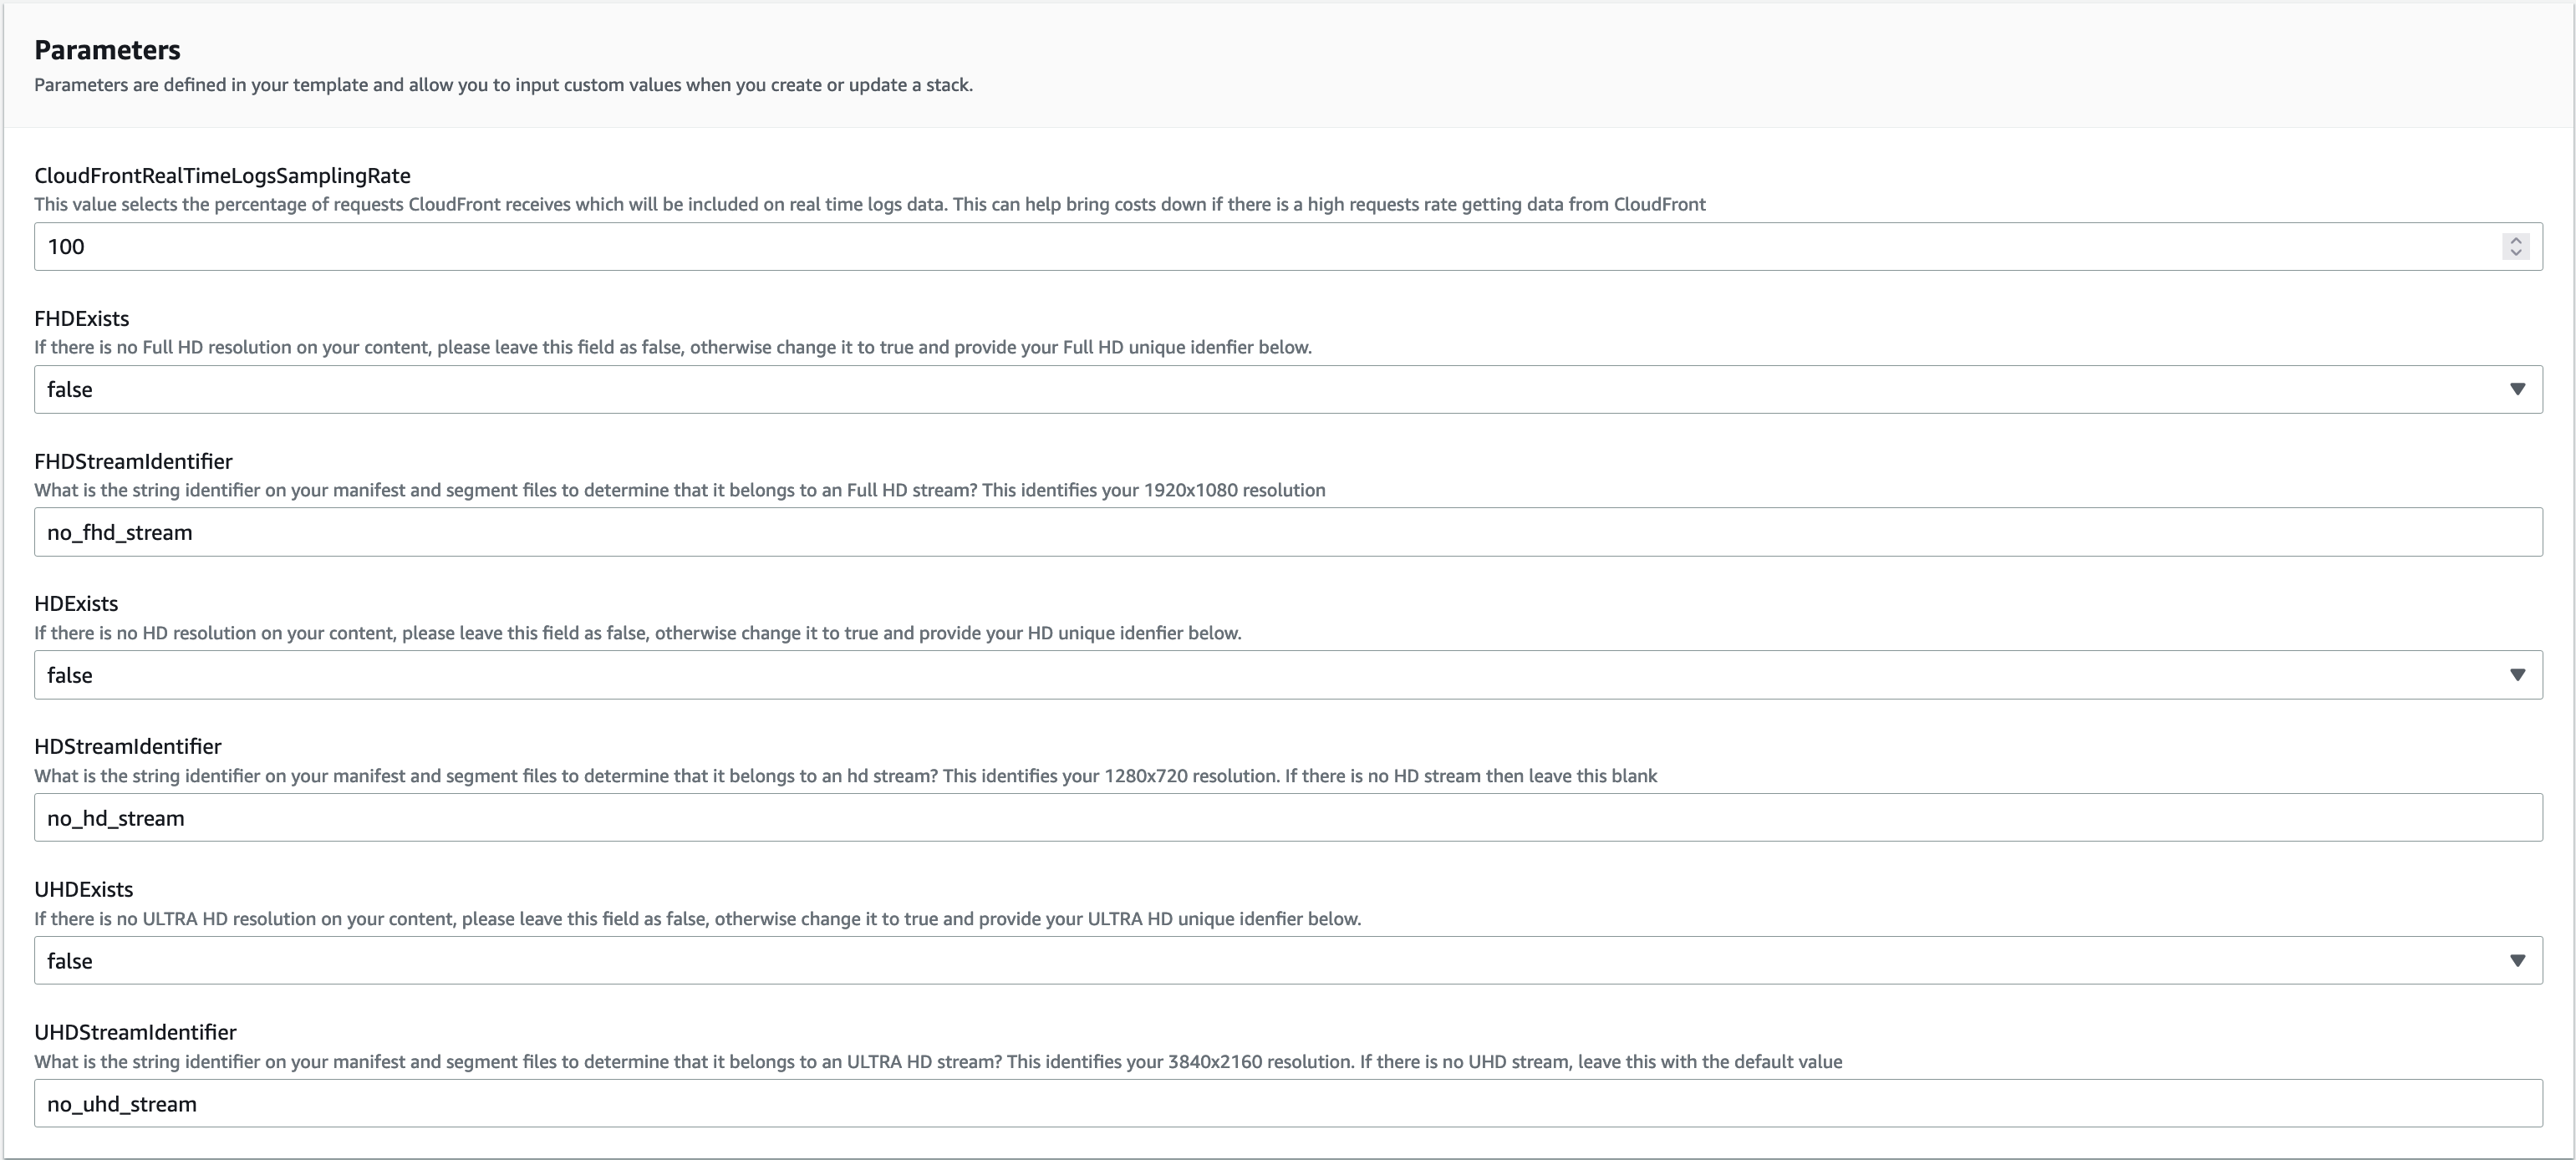
Step2: This CloudFormation template deploys all resources that are required for the Dashboard. While deploying the template, some inputs are required from you, which are described as follows:
- CloudFrontRealTimeLogsSamplingRate: This is a number between 1 and 100 that defines the sample rate in which requests being served by CloudFront are sent to the real-time logs pipeline. This allows you to control cost, as the more data flowing through the pipeline the higher the cost this solution has.
- UHDExists, FHDExists and HDExists: In these parameters we must indicate if there are Ultra HD, Full HD, and HD streaming parts of this media delivery flow. If any of these resolutions are not included on the media delivery flow, then leave this as false.
- FHDStreamIdentifier: This is a unique identifier of Full HD resolution streams within the URI of the content being requested by the users.
- HDStreamIdentifier: Similar to the ‘FHDStreamIdentifier’ described previously, this is the unique identifier for HD streams.
- UHDStreamIdentifier: Similar to the ‘FHDStreamIdentifier’ described previously, this is the unique identifier for Ultra HD streams.

Figure 3: CloudFormation Parameters
Step 4. Once the CloudFormation template has been executed and all components of the stack have been deployed, the next step is to attach the CloudFront real-time logs configuration to the CloudFront Distribution, which is serving the Media content. To do this, follow these sub-steps:
Step 4.A. Open the CloudFront Console and hover over Logs > Real-time configurations.
Step 4.B. Open the CFMediaDashboardLogs configuration and select “Attach to Distribution”.
Step 4.C. In the next page, select the distribution and the correct behavior being used to serve the Media content. Then select “Attach”. Make sure to select all the behavior that serves the media asset (Manifests and segments), as shown in the following image.

Figure 4: CloudFront Real Time Logs

Figure 5: Real Time Logs Attachment to Distribution
If there is live traffic running in the configured distribution, then the Dashboard has metrics being populated and it can be opened by going to the CloudWatch Dashboard Console, and opening the dashboard named “CloudFrontVideoAssetDeliveryDashboard”.
Dashboard usage and cost considerations
The CloudFront Video Asset Delivery Dashboard solution can be used in multiple scenarios. Furthermore, following the AWS cost model, this solution is pay-as-you-go. Operators can always plug in and out this dashboard from their workflow based on their need and usage.
The pricing dimensions involved on this solution are the CloudWatch Processed Data, the rate in which data is being sent to Kinesis and the size of each record, the CloudFront real-time logs requests, which are charged based on the number of log lines that are generated, and the number of Lambda invocations and their total duration. All of these dimensions are influenced by the request rate going to CloudFront and the Sampling rate selected when deploying the solution.
Note that as soon as the log configuration is detached from the CloudFront Distribution, the logs stop being populated and costs also stop. In the following image you can check how the configuration can be detached.

Figure 6: Real Time Logs Detachment
Dashboard clean up
To clean up infrastructure, the CloudFormation stack that has deployed the resources must be deleted. However, first there are two steps to take so that the cleanup works properly.
1- The CloudFront real-time logs must be detached from the CloudFront distribution. To do that, the real-time log configuration must be opened and detached from the distribution, which can be done through the Console.
2- The next step is to remove the CloudFormation Stack that created all the other resources. Once the deletion of the stack is complete, all resources are removed from the AWS Account.
Conclusion
In this post we introduced a new solution designed to help companies that deliver streaming content through CloudFront to gain more visibility into their streaming delivery and evaluate the QoS on their OTT streaming assets.
With the introduction of this solution, customers can gain end-to-end insight into their video delivery components. By leveraging the CloudFront Video Asset Delivery Dashboard using CloudWatch, businesses can gain real-time visibility into the performance of their video delivery workflow. In addition, by using the CMCD tool, customers can also gain insights into client-side telemetry, which provides a complete data set for businesses to retrospect their video delivery strategy. This end-to-end approach of video delivery performance monitoring and analysis enables businesses to make informed decisions and take corrective action quickly, making sure of high-quality streaming content with consistent QoS.

