AWS Partner Network (APN) Blog
All-in-One Data Management Platform Gives SaaS Companies a 360-Degree View of Their Customers
 |
 |
By Gene Epshteyn, Senior Product Marketing Manager at Panoply
Based in Australia, AgriWebb is a fast-growing software-as-a-service (SaaS) startup that lets farmers see their entire operation all from the palm of their hand—from simplifying record keeping and tracking herd movements to checking on individual animals. AgriWebb has more than eight million animals on their platform!
As AgriWebb scaled, however, they realized the platform must integrate disparate data sources that were collected from multiple touchpoints to gain insights across the customer funnel. They also needed to comprehensively understand what marketing messages were resonating with customers.
“We wanted to stitch together the path from ad to farm paddock,” says Brian Ritchie, Head of Growth at AgriWebb. “We had a good set of data that served us operationally. However, executive management and key stakeholders both internally and externally did not have a 360-degree view of the company. Frankly, we didn’t know what we didn’t know.”
AgriWebb chose Panoply, a data management platform built on Amazon Web Services (AWS), to quickly set up a data stack and help them get a 360-degree view of the customer journey. Panoply eliminates the development and coding typically associated with transforming, integrating, and managing big data.
Panoply is an AWS Partner Network (APN) Advanced Technology Partner with the AWS Data & Analytics Competency and Amazon Redshift Service Delivery designation. If you want to be successful in today’s complex IT environment, and remain that way tomorrow and into the future, teaming up with an AWS Competency Partner like Panoply is The Next Smart.
In this post, we’ll explore why and how AgriWebb chose Panoply and how that’s revolutionized their understanding of customer behavior and their marketing funnel.
Obstacles to Understanding the Customer Journey
Before teaming up with Panoply, AgriWebb’s pain points included:
- No dedicated analytics infrastructure.
- Siloed view of business performance.
- No single source of truth.
- Different teams using multiple Excel, Google Sheets, and platform-hosted data.
- Patchwork of information with no unified picture across the entire business.
Organizational reporting pulled technical experts away from other meaningful work. Every time an executive needed an update on company performance, AgriWebb’s engineers would have to produce a CSV file by running a custom-built javascript to generate an Excel report. This was a burden for a fast-growing startup that needed constant access to updated figures.
When data was available, senior leadership relied on preconfigured logic to generate charts and graphs that had static information, which was not easily explorable. The marketing team at AgriWebb was consequently unable to figure out how a specific campaign or ad messaging affected people’s behavior as users or future customers.
AgriWebb’s questions were the same ones that are crucial to any new business’ growth:
- How many trials led to sales?
- How much did it cost to acquire those customers?
- How were the most valuable customers coming in?
It was clear that AgriWebb needed an all-in-one data analytics solution that would empower them with a data model spanning their organization and offering access to those valuable insights.
Finding the Right Solution to Build a Marketing Funnel
AgriWebb sought a solution that would be “set and forget” and include:
- Quick and easy setup.
- Little to no maintenance.
- Plug into existing AWS-based stack, utilizing Amazon Redshift as a service.
- Combine built-in ETL (extract, transform, load) with artificial intelligence-driven automated data management.
- Instantly connect to a business intelligence (BI) visualization tool.
- Pay-as-you-grow model where data storage pays for itself as the company scales.
By meeting the above criteria, AgriWebb chose Panoply to set up an automated data warehouse with built-in ETL, an essential first step in being able to see the big picture of a customer’s journey.
Setting Up a Self-Serve Data Management Solution
AgriWebb implemented Panoply’s MVP data stack in a few hours, creating key dashboards across payments, accounting, and product systems. Its low barrier, self-serve technology made it “pick up and go” for engineers.
With Panoply, AgriWebb now had constant access to updated metrics that a quickly scaling startup needs—without any of the maintenance. We also brought together every touch point that AgriWebb has with customers across advertising, social media channels, CRM, finance, and more.
Moreover, Panoply’s solution fits seamlessly with the AWS-centric tools AgriWebb was already using. Other key tools used in day-to-day business included:
- Adtech (Google and Facebook demand-side platforms)
- Martech (Salesforce Pardot, AutopilotHQ, Mailchimp, Intercom, Aircall)
- Social media (Facebook, Twitter, LinkedIn, Instagram)
- Analytics (segment, Google Analytics and search console, MixPanel)
- CRM (Salesforce)
- Finance (ChargeBee, Stripe, Xero)
- Product (MySQL, MongoDB, MSSQL, Amazon SES)
AgriWebb also valued our partnership with Chartio, a fellow AWS Data & Analytics Competency Partner whose BI and visualization tool enables organizations to analyze data across many cloud applications.
“With Panoply and its native integration with Chartio, I can combine product data, ad data, and CRM data to paint a picture around our customers,” says Ritchie. “We now have a very comprehensive view of our customer base.”
AgriWebb stakeholders can review fresh data that Panoply collects and combines. “Now, we can communicate the logic, data, and business definition of decisions and moves we are making,” Ritchie says.
Helping Sales Focus on the Most Promising Leads
Panoply’s solution made an immediate impact for AgriWebb, unearthing new insights with data-driven results.
AgriWebb is now able to start lead-scoring customers based on:
Churn Risk
In Figure 1, you can see a sample churn analysis dashboard visualized through Chartio, which is seamlessly integrated with Panoply. Key metrics include trigger dates, the efficacy of the channel used by the customer like Intercom chatbot or email, and the timeline of the engagement.
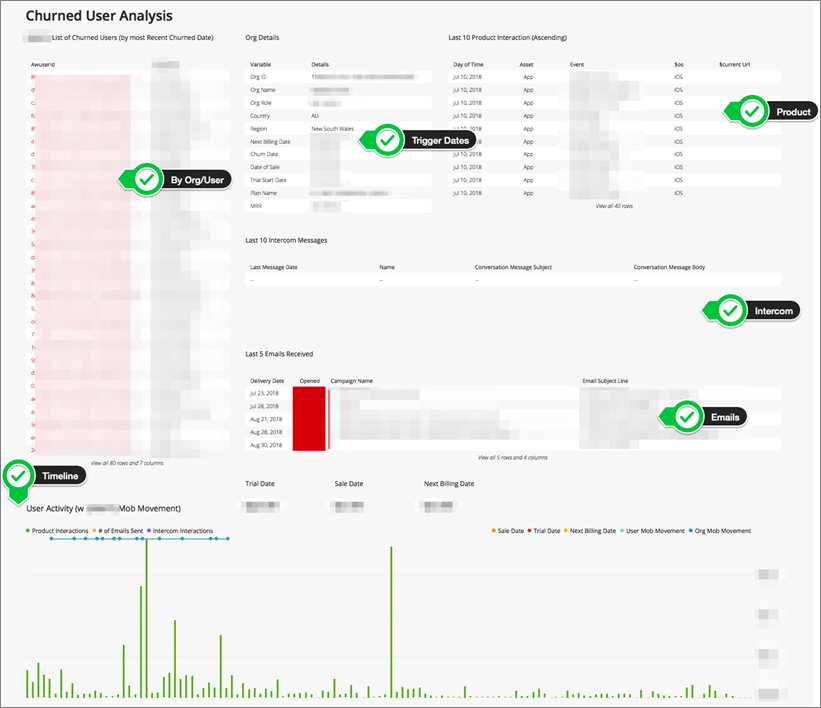
Figure 1 – Key metrics used by the customer, including timeline of engagement, name of business user, communication, and product channels used.
Customer Engagement
Below is an example of one dashboard showing customer engagement. It shows the duration of the customer usage of a particular product feature compared to previous time periods and the delta change between them.

Figure 2 – This snapshot shows the duration of customer engagement.
Conversion Scoring Data
The dashboard in Figure 3 is among several that helps determine conversion scoring. Leads and opportunities are shown per channel, and the advantage of the Panoply and Chartio solution is that it allows the combining of metrics from different reporting dashboards in one place. There’s no need to manually cut and paste the different metrics into a spreadsheet.

Figure 3 – The dashboard shows total leads and opportunities by source type.
New Chartio dashboards, accelerated by Panoply’s automated query performance optimization, let teams—and not just engineers—slice and dice monthly recurring revenue (MRR) and annual contract value (ACV) for a customer cohort, discovering insights on how they come into the product, and how these figures trend over time.
Data is Now Readily Available and Consumable
Everyone at AgriWebb, from board members to interns, is looking at dashboards on a daily basis. Panoply helped encourage a more data-driven culture at the company, and teams are now aligned to a metric-driven performance model that embraces scoring and grading mechanisms.

Figure 4 – Executive dashboard with key metrics.
Executives and managers can easily review hypotheses to make informed decisions or propose tests about pricing, territory expansion, marketing campaigns. Ultimately, they can use all that data to make the best choice for their business.
“We have much more flexibility and moved rapidly along the ‘data maturity’ curve,” says Ritchie. The best part? “It just works,” he says.
Maximum Impact, Zero Fuss
Panoply was the perfect data solution for a fast-growing SaaS company like AgriWebb. It offered an affordable, fast, and easy way to setup an all-in-one data warehouse management platform in minutes, without building out new infrastructure or hiring additional IT or engineering resources.
AgriWebb was able to add and combine all their disparate data sources and seamlessly connect them to their BI visualization tool of choice, Chartio. Now they have a self-service cloud data warehouse with lightning fast dashboards, empowering them with a 360-degree view of their business, including customer engagement, conversion scoring and marketing funnel.
“Knowing that Panoply is working and doesn’t need maintenance was a big ‘aha,’ ” says Ritchie. “I know Panoply won’t fail me and AgriWebb’s business operations will chug along with zero fuss.”
Above all, AgriWebb’s passion is delivering value to farmers. With Panoply, this Australian startup can focus on what matters most–helping farmers increase productivity and make better business decisions for their farms.
Next Steps
If you’re interested in Panoply’s all-in-one solution, you can set it up in just a few minutes without any help from IT or engineering. In fact, you can get a 21-day free trial of Panoply up and running in a few clicks today.
With Panoply, you’ll be able to upload data sources and connect to a BI visualization tool to create reporting dashboards for any line of business at your company. You can also sign up for a customized demo with Panoply’s expert Data Architects if you want to explore the product in more detail.
The content and opinions in this blog are those of the third party author and AWS is not responsible for the content or accuracy of this post.
.
|
Panoply – APN Partner Spotlight
Panoply is an AWS Data & Analytics Competency Partner. Built for the cloud, Panoply delivers the fast time to insights by eliminating the development and coding typically associated with transforming, integrating, and managing big data.
Contact Panoply | Solution Overview
*Already worked with Panoply? Rate this Partner
*To review an APN Partner, you must be an AWS customer that has worked with them directly on a project.