AWS Partner Network (APN) Blog
Helping a Pharmaceutical Company Drive Business Insights Using ZS Accelerators on Amazon Redshift
By Nishesh Aggarwal, Strategy & Architecture Manager at ZS Associates
By Rohan Kejriwal, Solution Delivery Consultant at ZS Associates
 |
The initial part of an organization’s cloud journey is typically focused on moving workloads from traditional, on-premises tech stacks to cloud-based technologies that offer flexibility and scalability.
With increasing data variety and volumes, however, it’s become increasingly necessary to ensure all of the workloads run in the most efficient manner to reduce overall turn-around time, as well as total cost of ownership (TCO).
One of the most critical factors in achieving these benefits is the selection of the right technology option for each component of the problem statement.
ZS is an AWS Advanced Consulting Partner with the AWS Life Sciences Competency and Amazon Redshift Service Delivery designation. We work side-by-side with companies to help develop and deliver products that drive customer value and company results.
In this post, we’ll start with an overview of the data and analytics platform ZS built to streamline and improve contracting analytics for a top life sciences company. We’ll then dive deep into the data architecture and explain how we evolved our data technology stack to get maximum performance.
Finally, we will share case studies that showcase how ZS leveraged Amazon Redshift and architected our data processing layers differently to get maximum return on investment (ROI).
Business Problem
The pharmaceutical industry has undergone rapid business model changes, leading to the exponential expansion of first, second, and third-party data sets, which are often provided at various levels of granularity.
As a result, business experts often find themselves spending a disproportionate amount of time acquiring, curating, and analyzing this data. They could be spending time on more important business metrics, such as analyzing key performance indicators (KPIs).
To realize increased performance, companies need to deploy sophisticated systems and strategies addressing these data realities. Additionally, the expertise required to drive this performance is often concentrated within a siloed group inside the IT department.
The key business challenges ZS addressed at our life sciences client were:
- Evolving healthcare ecosystem (with vertical and horizontal integration) and policies (government and government-funded entities evolving the rules of engagement) required a secure and flexible platform that can scale and adopt to an ever-changing business landscape.
- The data required to inform these decisions was not centrally located, standardized, or complete, and required stitching together to triangulate insights.
- Decisions that impacted hundreds of millions, if not billions, of dollars were often made in Excel by individuals working in silos. These decisions were made by stakeholders based on inconsistent assumptions and without access to the data and analogues utilized previously by their colleagues.
- Lack of ability to monitor the performance and effectiveness of decisions that were previously made.
Solution Overview
To achieve competitive advantage, the customer decided to invest in analytical tools and capabilities to accelerate business decision making across their portfolio of products.
Key capabilities the client was looking for included:
- Fully-automated data integration and bridging to achieve a single version of truth.
- Harmonized and enhanced pre-deal modeling to stop overpaying for securing better access.
- Optimized reporting for better post-deal analysis; ability to build institutional memory overtime; and store analogs to inform future decision making.
- A platform that can provide speed to value and future scalability, such as integration to a data lake.
ZS designed and delivered an integrated suite of ZS proprietary and industry-standard software platforms, as shown in Figure 1 below.
To accelerate the time to business value, ZS leveraged internal assets and U.S. healthcare domain expertise to configure the solution components as per customer requirements.
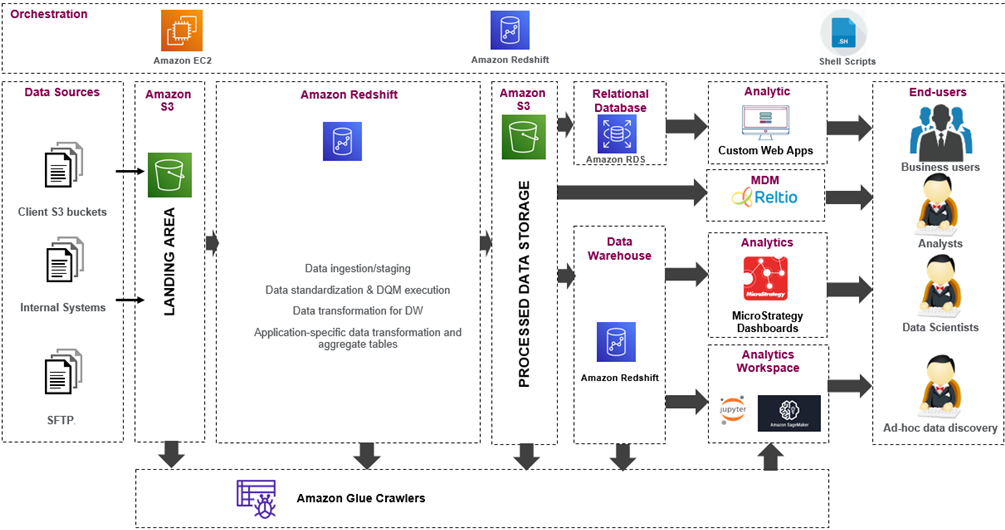
Figure 1 – Solution architecture of contracting analytics platform.
The AWS-based solution was designed with a phased approach to inform strategic business decisions and deliver early value. Our goal was to create an enterprise-grade analytics platform with the tools, speed, and flexibility to execute on all business priorities. It also needed to be scalable to meet the customer’s rapidly evolving portfolio.
Affiliation Management Solution
To solve for standardizing and bridging needs, ZS integrated and configured the Reltio platform to provide a flexible and cloud-native solution to data stewards.
Reltio provided an easy-to-use interface for data stewardship to create and maintain various custom entities that were needed by business teams to evaluate overall customer landscape.
Pre-Deal Contract Modeling
For advanced modeling and predictive analytics needs, we leveraged ZS’s Contract Deal Modeler. This is a web-based application built on AWS, and it helps in evaluating “what-if scenarios” using a number of out-of-the-box models.
The Contract Deal Modeler also helps in making effective and informed decisions that optimize gross-to-net investments and decisions that range from millions of dollars in savings in up-front discounts to rebates paid to key customers.
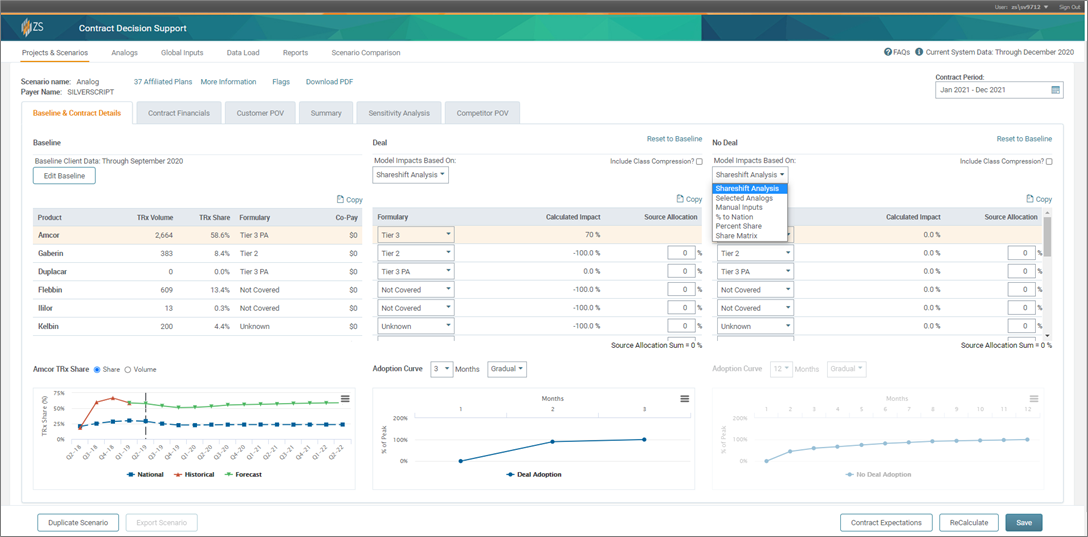
Figure 2 – ZS’s Contract Deal Modeler (web-based application).
Reporting and Analytics
There is a complete suite of reporting and analytics applications deployed as part of this platform. The applications can be categorized into two broad categories:
- Intuitive and easy-to-use set of standard and canned dashboards for most common business questions.
- Flexible and powerful ad hoc analytics environment to meet more custom business needs.
All of the apps are designed in partnership with ZS’s user experience team and are built on MicroStrategy‘s enterprise platform to provide a seamless and secure user experience.
Data Integration
At the heart of the solution is a strong foundational data layer built using Amazon Redshift. This layer was key to solve:
- Ingesting and curating data at scale.
- Standardizing data across various data providers, as well as creating a single version of truth.
Currently, we consume more than 150 data assets, consisting of 530 files and 12 billion input records. These have been integrated on the platform at record speed using ZS’s assets and accelerators that provide out-of-the-box features to implement end-to-end automation.
The below table summarizes various workloads with I/O data volume, total time taken, and respective cluster types used:
| Daily processes | Weekly processes | Monthly processes | |
| Input data size (compressed) | 300 GB | 600 GB | 1.4 TB |
| Total records processed | 3 billion | 9 billion | 25 billion |
| Processed data size (compressed) | 2.4 TB | 7.2 TB | 20 TB |
| Amazon Redshift cluster size | dc2.8xl – 4 nodes | dc2.8xl – 4 nodes | dc2.8xl – 8 nodes |
| Total time taken | 2.5 hours | 14 hours | 22 hours |
ZS’s Custom Orchestration Framework
End-to-end data processing is enabled through a custom orchestration framework developed in-house at ZS to streamline and optimize development of complex data pipelines.
Architecture of the platform is captured in Figure 3 below. At a high level, there are four components of this framework:
Control Tables
- These are used to capture all of the metadata needed to execute a step for location of source data, connection string, or SQL query, for example.
- These control tables are typically hosted on a separate database like Amazon Relational Database Service (Amazon RDS).
Unix and Python Scripts Hosted on Amazon EC2
- These are reusable scripts that fetch information from the control tables and build executable packages on the fly that are submitted to data processing engine.
Amazon S3
- This is used to store raw and intermediate outputs.
Amazon Redshift
- This serves as the core data processing engine and data warehouse for all analytics applications.
This framework provides a high level of reusability and reduced the need to write new code for activities like applying data quality checks, and ingesting new datasets from various source systems.
Scheduling new jobs can be done easily by entering new records in the control tables and needs no coding experience. This helps reduce the time it takes to develop new data pipelines.
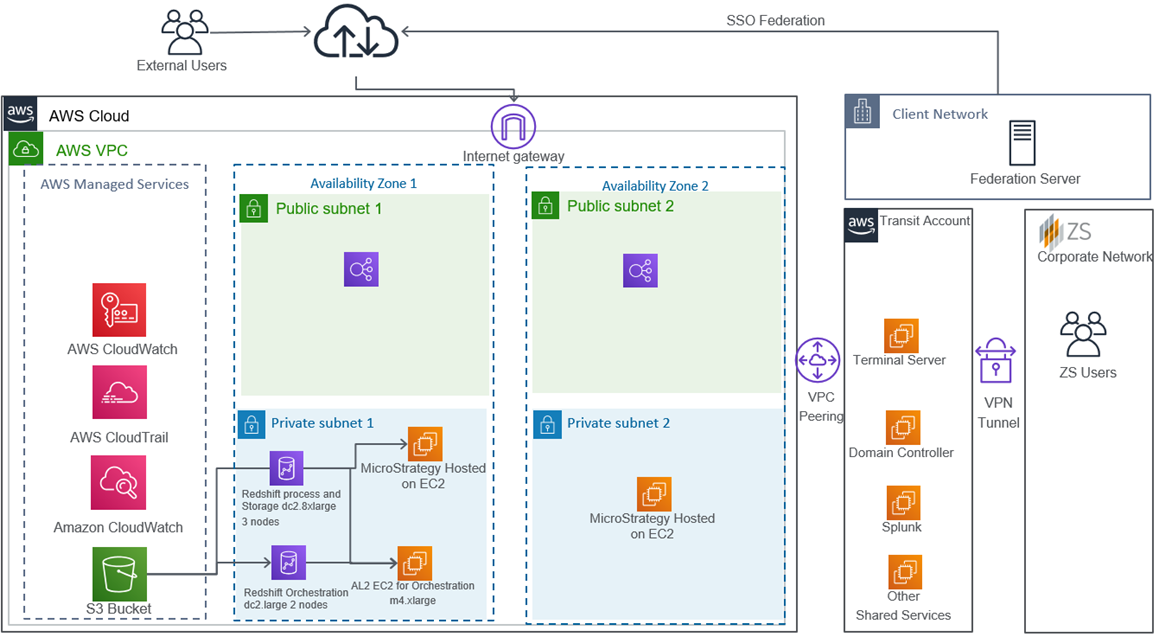
Figure 3 – Data architecture diagram.
Building this data and analytics platform came with its fair share of challenges; two key challenges we faced were:
- Infrastructure costs went up quickly as new and larger datasets were integrated.
- Run all the processes as fast as possible without increasing the infrastructure costs.
The below table showcases how the data volume has increased over the last five years:
| 2016 | 2017 | 2018 | 2019 | 2020 | |
| Input data size (compressed) | 600 GB | 1.2 TB | 2 TB | 2.3 TB | 2.6 TB |
| Total records processed | 9 billion | 20 billion | 34 billion | 35 billion | 37 billion |
| Processed data size (compressed) | 7.2 TB | 15 TB | 27.2 TB | 29.6 TB | 32.5 TB |
Through brainstorming and experimentation, we finalized broad strategies that resolved the key challenges and laid a strong foundation to scale this platform for years to come.
Business Optimizations
Challenge 1: Streamlining ETL and Data Warehouse Workloads
At the inception of the program, our architecture included Apache Spark on Amazon EMR for batch processing and Amazon Redshift as backend data warehouse to support reporting and analytics.
Though this is the most widely adopted architecture, when we analyzed overall utilization of servers, we made some interesting observations:
- Our on-demand EMR clusters were typically active for only a few hours a day to perform batch processing.
- Similarly, when we looked at utilization of our reserved Amazon Redshift nodes, they were mostly getting utilized during U.S. business hours.
Given Amazon Redshift’s massive parallel processing capabilities and ability to execute highly complex SQLs on large datasets with ease, we decided to try and execute some of our batch workloads on Amazon Redshift clusters to compare the performance against that of Spark on EMR.
| Before | After | ||
| Spark on EMR | Amazon Redshift | Total monthly cost | |
| Size/type of EMR cluster | r3.8xl – 8 nodes | dc2.8xl – 4 nodes | dc2.8xl – 4 nodes |
| Total monthly utilization | 256 hours | Always on (reserved) | Always on (reserved) |
| Monthly cost | $5,990.40 | $11,100 | $11,100 |
| Total monthly cost | $17,090 | $11,000 | |
In the before scenario, ZS used to run the ETL (extract, transform, load) processes in an on-demand EMR cluster in addition to a reserved instance of Amazon Redshift for data warehousing and reporting purposes.
In the after scenario, a reserved instance (RI) of higher configuration for Amazon Redshift was utilized to run the ETL process and serve as the backend for reporting requirements, thereby saving on overall costs.
As ZS moved the workloads to Amazon Redshift, we needed to ensure optimal performance for both batch and data reporting and analytics workloads. This was achieved by carefully examining cluster utilization and setting up workload management to optimally utilize the available computing resources.
Workload Management Configuration
The Workload Management (WLM) feature of Amazon Redshift provides an interactive way to manage allocation of available resources. WLM allowed us to define multiple query queues and route queries to appropriate queues at runtime.
There are two ways to configure a WLM: Automatic and Manual. Automatic is where, based on the available resources and number of queries, Amazon Redshift scales up or down resources automatically. It uses machine learning (ML) to allocate resources dynamically under auto WLM configuration.
Manual WLM is where someone manually defines one or more queues, with each queue depicting a workload type that is categorized by resource requirement and query response time.
As illustrated below, ZS created two additional queues and divided the Amazon Redshift users into these groups.
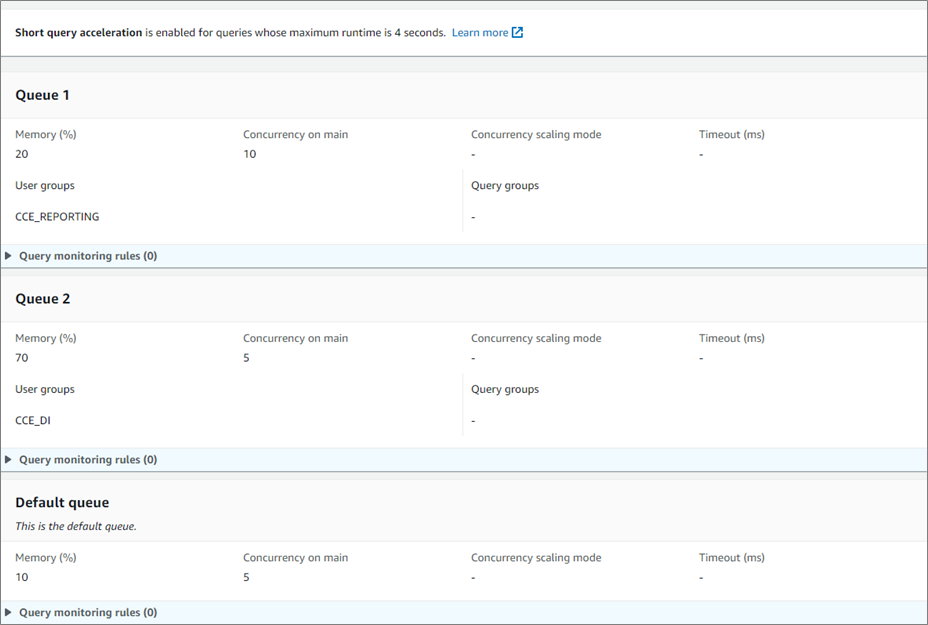
Figure 4 – Configuring queues via Redshift > Configurations > Workload Management.
To attain maximum performance for a reporting user during business hours and a data processing user during non-business hours, an AWS Command Line Interface (CLI) command was created that can alter the WLM properties for each user group.
This is scheduled based on a time-based trigger using an Amazon Elastic Compute Cloud (Amazon EC2) instance.
During Non-Business Hours:
During Business Hours:
During non-business hours: The Data Warehousing user group was allocated with 70 percent memory and a queue of five concurrent queries to ensure maximum memory for ETL processing. The Reporting user group was allocated with 20 percent memory and a queue of 10 concurrent queries, and the remaining 10 percent was allocated to the default queue.
This enabled us to perform data processing on huge datasets with maximum resources.
During business hours: The Reporting user group was allocated with WLM of 85 percent with a queue of 10 concurrent queries, while 10 percent was allocated for the Data Warehousing user group with five concurrent queries, and the remaining 5 percent was allocated to the default queue.
Maximum resources were provided to the Reporting user group to ensure optimal performance of all live datasets on reporting and analytical solutions built on top of the data warehouse.
Impact
Migrating our workloads to Amazon Redshift resulted in more than 35 percent savings in our monthly infrastructure cost and 40 percent improvement in execution time of our batch processes.
In addition, ZS also observed several other significant benefits:
- Effort required to optimize the query performance was significantly lower for Amazon Redshift when compared to EMR due to out-of-the-box functionalities such as query plan, distribution, and sorting techniques.
- We no longer required multiple skillsets on our team. Also, onboarding and training newer team members to build optimized codes on Amazon Redshift was much faster.
- Infrastructure management became much simpler due to simplified architecture.
Challenge 2: Optimize Workloads While Maintaining or Reducing Infrastructure Costs
As the batch processes became more complex and data volumes increased over time, ZS started observing a significant increase in data processing time.
While a quick way to reduce the processing time is to increase the cluster size, upon experimenting we didn’t observe a proportional relationship between reduction in execution time and increase in cluster size (and cost).
As ZS had already tuned all of our queries workloads per recommended methods, and we were already utilizing dc2.8xlarge clusters, we needed to come up with some new concepts to further improve the performance and reduce infrastructure costs.
After analyzing the logs, ZS determined the key reason hampering performance was the delay caused by commit queue. As all of our processes were ETL operations transforming huge volume of data sets, irrespective of cluster size, a lot of the queries were getting stuck during commit operation.
To maximize the resources and provide the ability to perform a greater number of commit operations in parallel, we split our workloads and ran them on multiple Amazon Redshift clusters.
As you can see from the table below, the same queries when executed in parallel on independent clusters were completed much faster, compared to running them in parallel on the same cluster of twice the capacity. We observed similar results across all of our data pipelines, and ended up redesigning our data pipelines to take maximum benefit.
| Query 1 | Query 2 | Query 3 | Comments | |
| 1 dc2.8xl – 2 nodes | 10 m 44 s | 17 m 56 s | 11m 38s | All 3 queries running in parallel on the same cluster |
| 1 dc2.8xl – 4 nodes | 9 m 22 s | 12 m 49 s | 9 m 48 s | All 3 queries running in parallel on the same cluster |
| 3 dc2.8xl – 2 nodes | 1 m 58 s | 10 m 11 s | 1 m 1 s | All 3 queries running in parallel on different clusters |
Impact
ZS saw a significant improvement in the overall run time. Not only were we able to bring the overall run time down by 75 percent, the overall cost of infrastructure in this new architecture was reduced by 37.5 percent (50 hours execution of three nodes dc2.8xlarge cluster vs. 80 hours in our original architecture).
Summary
In this post, we shared how ZS helped design and deliver a robust data and analytics platform to meet the ever-increasing demand of business analytics users at a life sciences company. In addition, we also saw how investing in optimizing infrastructure with the right approach can provide very high ROI.
ZS has the domain expertise, internal assets, and experience to help you architect a single-source-of-truth for your data, increasing the ease of information access, centralizing institutional memory of past business decisions, and providing automated data processing.
Please contact ZS to learn more about our Amazon Redshift capabilities and unlock the business value of your data.
The content and opinions in this blog are those of the third-party author and AWS is not responsible for the content or accuracy of this post.
.

.
ZS – AWS Partner Spotlight
ZS is an AWS Advanced Consulting Partner that works side by side with companies to develop and deliver products that drive customer value and company results.
*Already worked with ZS? Rate the Partner
*To review an AWS Partner, you must be a customer that has worked with them directly on a project.