AWS Partner Network (APN) Blog
Live Troubleshooting of Amazon EKS Applications with Dynamic Instrumentation and Lightrun
By Eran Kinsbruner, Global Head of Product Marketing – Lightrun
By Young Jeong, Partner Solutions Architect, AppMod – AWS
By Shakthi Dakuri, Sr. Partner Solutions Architect – AWS
 |
| Lightrun |
 |
Amazon Elastic Kubernetes Service (Amazon EKS) has become the most popular service for deploying Kubernetes applications in the cloud.
Amazon EKS provides a managed scaled control plane which eliminates the undifferentiated heavy lifting for the enterprise platform team, which is responsible for operating and managing the worker nodes where developers deploy their applications.
Even if developers do not need to operate and manage clusters, they still need to be able to write applications that work well within Kubernetes. More importantly, they need to be able to debug and troubleshoot applications running on Kubernetes clusters quickly and effectively.
Unfortunately, this is often not the case, as developers can be disconnected from their applications once they are shipped to production. This issue is particularly severe in case of a production incident requiring the developer to quickly troubleshoot and get to the root cause of a problem.
In this post, we will provide an overview of how using the Lightrun developer observability platform and Amazon EKS technology, organizations can maximize their mean time to resolution of defects (MTTR), enhance developer productivity, and reduce overall logging costs. Lightrun and Amazon EKS enable full-cycle developer observability.
Lightrun is an AWS DevOps Competency Partner and AWS Marketplace Seller that gives developers the power to understand the behavior of live applications on demand, in real-time, without stopping the running applications.
Kubernetes Local vs. Remote Development
One of the most powerful enablers of developer productivity and effectiveness is a robust local development environment that provides a fast feedback loop when developing new features and troubleshooting existing ones.
There are two possible approaches when releasing applications on Kubernetes: using a locally-installed Kubernetes cluster, or connecting to a remote Amazon EKS environment. Even if some techniques and tools exist, both methods have yet to convince developers.
Local development environments can become heavy and clunky, often failing to reproduce a sophisticated server environment with all of the required dependencies (external services, databases, other services).
Remote approaches try to enable troubleshooting through some form of authenticated connection to Amazon EKS. They can represent a partial solution to the need for a fast feedback loop. Still, they present several challenges:
- Often require risky and complex port-forwarding from the developer’s local machine to pods on Amazon EKS.
- Usually require full developer access to clusters, which is rarely feasible in complex organizations that are rightfully concerned with assuring security auditing, separation of concerns, and compliance.
- Speaking of compliance, Amazon EKS can be hardened to provide security assurance for highly-sensitive workloads; this limits the possibility of direct connection to cluster components. Another useful repository that’s recommended and used to deploy containers on Amazon EKS is the custom Amazon Machine Images (AMIs) and optimized AMIs for EKS.
- Tooling available in the production environment is usually limited for debugging purposes. For example, the widespread use of thin Docker images, as in “Distroless” and similar approaches, means the container environment does not provide any debugging tool, not even a shell.
The problem of getting a fast and efficient local workflow is complex, particularly when you’re troubleshooting and debugging. A talented platform team can sometimes alleviate the issues by creating customized tooling.
The challenge is significant and platform teams are frequently more focused on the software supply chain’s production components, and they don’t have the resources to tackle the developer side of it.
Centralized Logs in Amazon EKS
“The most effective debugging tool is still careful thought, coupled with judiciously placed print statements,” wrote Brian Kernighan in Unix for Beginners in 1979.
Even if there are more sophisticated debugging techniques, text logging is still the most simple and powerful debugging and troubleshooting technique. Amazon EKS provides native ways for centralized logging via Amazon CloudWatch and Container Insights.
CloudWatch for Amazon EKS has evolved considerably to provide a centralized log ingestion platform capable of handling large quantities of logs with efficient full-text search and parametric filtering.
While CloudWatch is a powerful solution, when it comes to complex debugging at runtime, such a solution can benefit from a dynamic observability solution like Lightrun.
Lightrun enhances the troubleshooting workflow by enabling developers to gain remote access directly from their integrated development environments (IDEs) to the target pods without the need for redeployments, port forwarding, or application state changes.
Static Logs
A critical feature for troubleshooting Amazon EKS-deployed applications is the ability to add and remove log statements quickly. Changing logs requires a complete run of the CI/CD pipeline and an application redeploy. Even if your organization can build and deploy to production in five minutes, it’s still a five-minute delay on a feedback loop that should take seconds.
Furthermore, only a tiny fraction of organizations can deploy in five minutes, particularly in production. The latest State of DevOps reports that only 17% of respondents routinely deploy multiple times per day.
Working with static logs (logs added during development) can slow down the feedback loop for developers trying to alleviate this by over-logging—adding large quantities of logs “just in case” and possibly hiding them behind a LOG_LEVEL=debug condition.
Even in that case, the control is coarse-grained and you probably need to restart the application or even redeploy it to change the log level. Furthermore, an increased log volume severely impacts costs in two ways:
- Increases storage, computation, and possibly licensing costs.
- Worsens the performance of log collection for the entire EKS infrastructure, as log collection is shared between applications. In extreme cases, this can lead to a decreased cluster performance due to noisy neighbors’ effects.
It’s not uncommon to see EKS clusters where 10% of applications generate up to 99% of the total log volume. In most cases, this is due to a LOG_LEVEL=DEBUG that has been left on from a previous debugging session.
Business Impact
The complexity of debugging an application running on Amazon EKS has a direct business impact in terms of direct cost and missed productivity:
- Direct cost: Overlogging leads to excessive log volumes, which translate to computing, storage, and possibly licensing costs.
- Productivity: Time spent in inefficient troubleshooting harms developer productivity and slows the development cycle. This also impacts site reliability engineering (SRE) and DevOps personnel, who must spend significant time supporting troubleshooting efforts.
- Time to resolve incidents: Friction in troubleshooting applications directly results in increased time to resolve incidents.
Modern Integrated Approach
Lightrun provides a modern approach to Amazon EKS debugging and troubleshooting, which overcomes debugging and static logs limitations in EKS by dynamically instrumenting logs for workloads running on Kubernetes clusters.
The primary interface for the developer is kept in the local IDE. There is no need for code changes, redeployment, log-level changes, or application restarts.
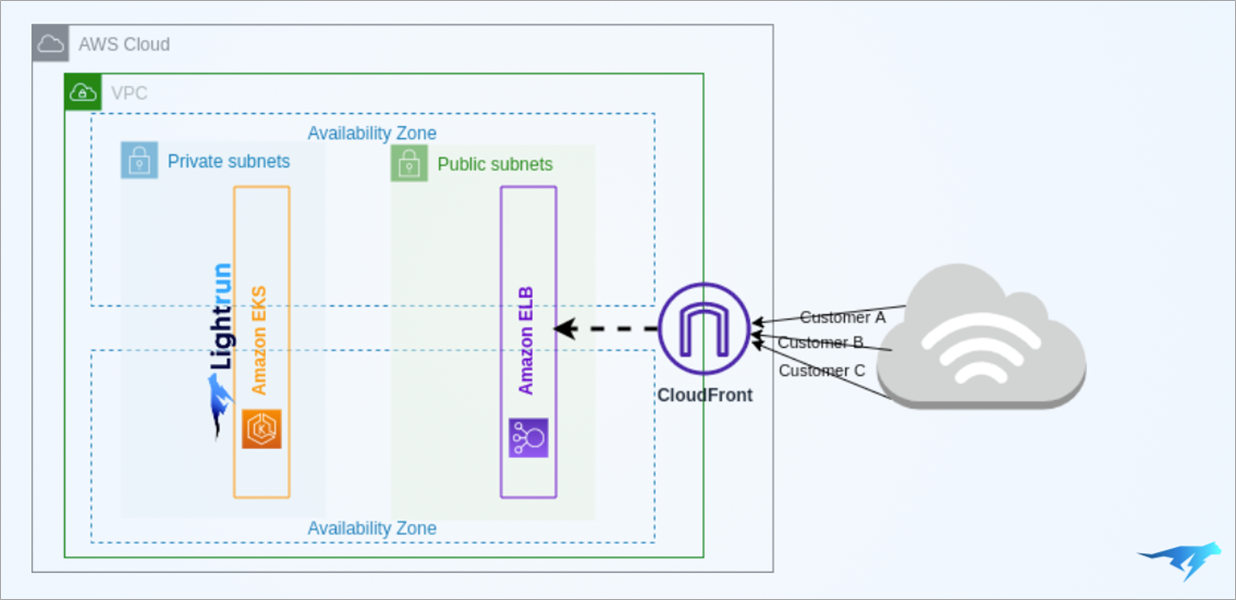
Figure 1 – Lightrun and Amazon EKS architectural diagram.
Lightrun Architecture on AWS
- From a developer perspective, Lightrun allows dynamically adding logs, metrics, and traces to live pods without stopping the running application and without changing its state, thus permitting unrestricted debugging on live production workloads. This allows developers to stay focused on their local environment; it’s like having a debugger that works everywhere your EKS workload is deployed, allowing for a faster feedback loop and more efficient deployment process.
- From an SRE/DevOps perspective, Lightrun allows operations personnel to provide developers with a secure and reliable environment for development and troubleshooting, relieving them from mere support to development. It also reduces the burden of managing overlogging, as Lightrun allows for additional logs to be created dynamically and on-demand without impacting logging costs.
- From a security perspective, Lightrun eliminates the need for a direct connection to critical infrastructure components.
- From a product owner perspective, frictionless application troubleshooting decreases the time needed to restore the system after an incident.
To learn more about the cost-saving opportunities, check out Lightrun’s whitepaper on the economic impact of enterprise logging. You can also experiment with Lightrun’s live playground or book a demo.
Example Case Study: Start.io
Start.io handles more than 30 billion requests every day on its app deployed on Amazon EKS. Handling this enormous amount of traffic is an uphill battle and one that is fraught with complicated, nuanced production issues.
Two key types of production issues that come with this level of scale are concurrency and parallelism problems. These types of issues appear only under a specific set of circumstances and are often hard to reliably replicate locally.
When these issues happen and are left unmitigated, they tend to lead to severe service disruptions, often causing data corruption and non-standard program behavior.
Using Lightrun to Solve the Issues
Start.io deployed Lightrun to a significant portion of its production services. Previously, when developers wanted to add more visibility when a specific event occurs in a running application, they had to:
- Add a new piece of code that exposes some piece of information.
- Pour the information produced into an external system; for example, Kibana.
- Review the information in the external system.
Lightrun eliminates this entire process by opting instead to take a more proactive approach. Using Lightrun, Start.io’s developers can define conditions and schedule events. Then, when it does, the developers get proactive alerts inside their IDE with the required information.
When the specific case is being “caught” (when a specific condition is being met), Lightrun automatically pipes the information right to them.
Faster Incident Resolution Using Lightrun
Start.io saves a lot of time by debugging with Lightrun, relieving teams of unnecessary repetitive processes and freeing them up to focus on writing new features.
Real-time debugging without needing to add new code (and without having to remove that code later on), proactive alerting, and visibility into the code path that led up to the issue at hand all result in a significant increase in productivity.
Lightrun also supports Start.io in reducing much of the friction associated with incident resolution—up to 50-60% faster incident resolution. Because it’s completely integrated into the IDE, Lightrun enables developers to keep their fingers on the pulse of production systems without constant context switching.
Summary
As more and more modern applications are utilizing Amazon EKS, app developers require effective troubleshooting abilities so they can pinpoint root causes during runtime and resolve them quickly.
As highlighted in this post, developers have challenges accessing their live applications from their local IDEs; hence, having the ability to utilize dynamic observability platform like Lightrun to gain access to the applications logs, snapshots, and metrics is fundamental to meeting strict serve-level agreements, reduce mean time to resolution, and ensure high development productivity within the team.
You can learn more about Lightrun in AWS Marketplace.
.

.
Lightrun – AWS Partner Spotlight
Lightrun is an AWS DevOps Competency Partner that gives developers the power to understand the behavior of live applications on demand, in real-time, without stopping the running applications.