AWS Partner Network (APN) Blog
Make Business Decisions with Service-Level Objectives Using Amazon Redshift and Nobl9
By Natalia Sikora-Zimna, Product Owner – Nobl9
By Asser Moustafa, Specialist Solutions Architect, Analytics – AWS
By Shaun Wang, Sr. Partner Solutions Architect – AWS
 |
| Nobl9 |
 |
Setting and monitoring clear, appropriate, and actionable reliability goals can be a challenging task, especially in large-scale businesses. Nobl9 helps organizations use service-level objectives (SLOs) to find a balance between operational efficiency, reliable delivery of services, cost control, and customer satisfaction.
In this post, we will explore how you can use Nobl9’s integration with Amazon Redshift to easily set up SLOs on top of your product data and derive actionable insights.
Amazon Redshift is the most popular and fastest cloud data warehouse, offering seamless integration with your data lake and other data sources, automated maintenance, separation of storage and compute, and more—all with industry-leading performance and price-performance ratio.
As you will see, with Amazon Redshift and Nobl9 you can turn your business KPIs into SLOs and monitor the reliability of your product or service with ease.
Nobl9 is an AWS Partner that helps organizations set and understand reliability goals. By tracking the performance of your systems, you can ensure balanced and efficient reliability. The Nobl9 platform collects metrics from all of your existing monitoring systems and calculates your performance.
Goals
Modern data architectures require more than traditional data warehouses or appliances to power their data ecosystems.
Amazon Redshift helps fill this need for tens of thousands of customers by seamlessly integrating with other AWS services in the data ecosystem. This includes Amazon Relational Database Service (Amazon RDS) instances for operational data, Amazon Simple Storage Service (Amazon S3) for data lake queries, Amazon SageMaker for machine learning predictions, and AWS Partners such as Nobl9 for specialized use cases.
Before digging deeper into the technical details of Nobl9’s integration with Redshift, let’s take a step back and think about the broader business perspective.
If you’re building a product, you probably have some goals in mind. They don’t have to be articulated in terms of KPIs, but they should give a solid indication of how you’d like your product to perform.
For the purpose of this post, let’s focus on simple goals for a shopping app:
- I want my customers to make quick purchase decisions.
- I also want most of these decisions to end up in a successful purchase.
To make these goals more specific, we can add more details and say that:
- I want 99% of order confirmations to be completed within five minutes of the time the user enters the app.
- I want 95% of all requests to result in success (status code = 200).
Now that we’ve specified our goals, we need a data source that collects data about our product. Let’s take a look at how to set up an Amazon Redshift cluster.
Set Up Your Amazon Redshift Cluster
Creating an Amazon Redshift cluster is easy. Sign in to the AWS Management Console, open the Redshift console, and click the Create cluster button to launch the wizard shown in the screenshot below.
Fill in the requested information, such as the cluster name, number of nodes, and node type; for this post, it’s recommended to use the latest generation node type, RA3.
Feel free to use the default settings for backups and security, or customize them if you prefer.
Finally, click the Create cluster button at the bottom, and the cluster should be available in a few minutes. If you’d like to automate the cluster creation process, you can also do this easily with an AWS CloudFormation script.
Figure 1 – Creating your Amazon Redshift cluster.
Create Your tables
After creating your Redshift cluster, the next step is to create the two tables that we’ll be using in this post. To do this, you can copy and paste the following SQL commands into the Redshift Query Editor or any other SQL client:
Connecting with Nobl9
Once you have your cluster up and running, you can move on to configuring a connection between Redshift and Nobl9. To do so, navigate to the Integrations panel in Nobl9, click the + button, and select Amazon Redshift from the list of available integrations.
You can establish two types of connection with Redshift: Agent or Direct.
- If you don’t want to expose your server to Nobl9 or share your credentials, or if your company’s firewall blocks outbound connections, use the Agent method.
- If you want Nobl9 to access your server directly over the internet, use the Direct connection method. This method requires users to enter their authentication credentials, which will be encrypted and safely stored on the Nobl9 server.
For the purpose of this post, we’ll set up a Direct connection.
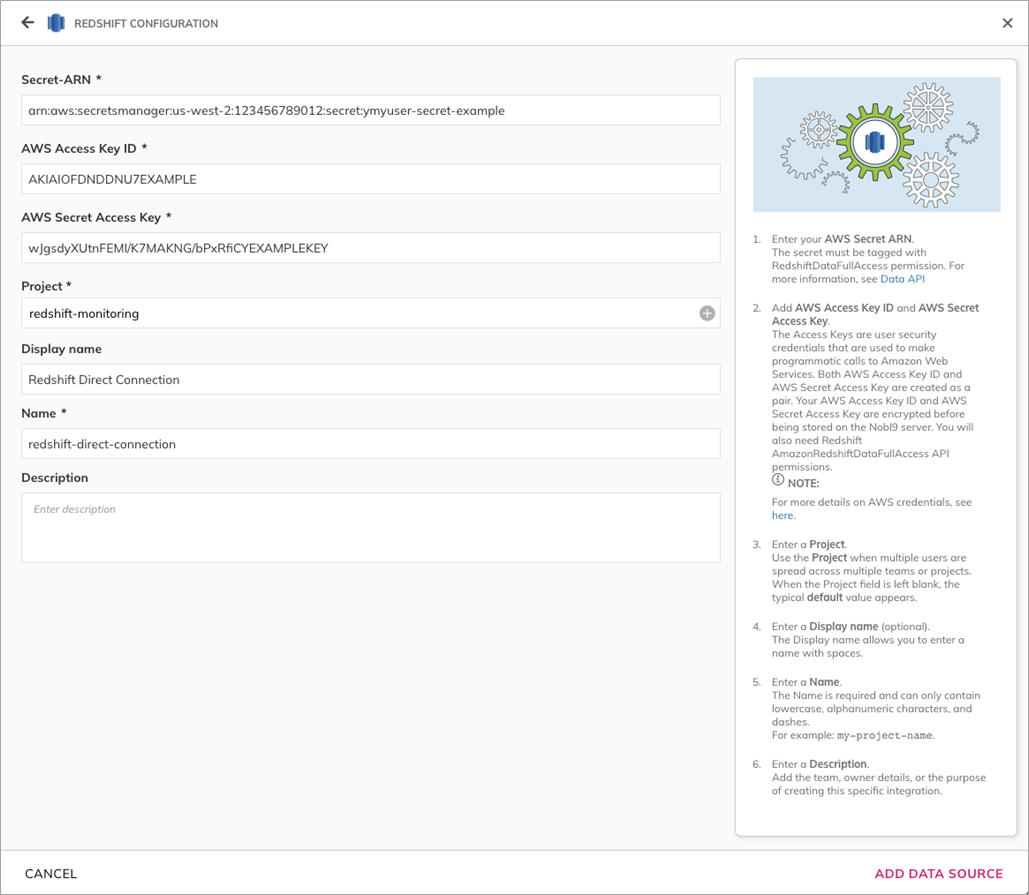
In the data source configuration wizard, you’ll be asked to provide the following information:
- AWS Secret-ARN (for details on this, see Using the Amazon Redshift Data API)
- AWS Access Key ID and AWS Secret Access Key (created as a pair)
In addition, you’ll be asked to specify the project in which the data source will live, as well as a name and display name for the data source. Optionally, you can add extra information in the Description field. Finish the process by clicking Add Data Source.
Figure 2 – Nobl9 configuration page for Redshift.
Adding Your SLO
Once you have the connection set up, you can move on to creating your SLOs. Navigate to Nobl9’s Service Level Objectives panel and click the + button to open the SLO wizard.
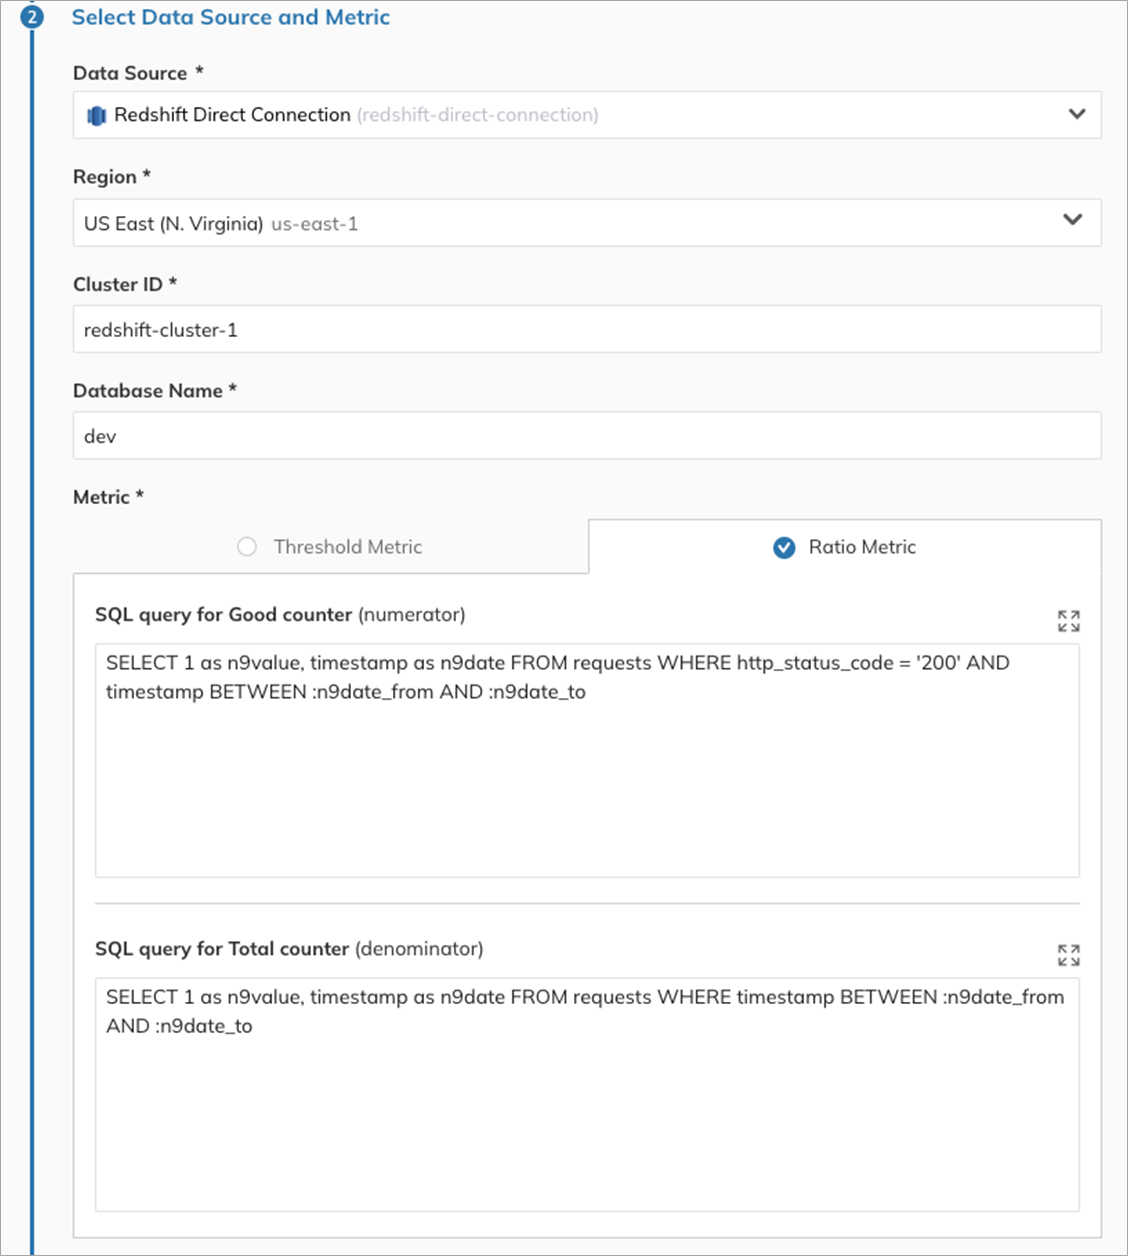
Select the data source you configured in the previous step, and choose your region (entry point to Amazon Redshift). Then, enter your cluster ID (in our example it’s redshift-cluster-1) and the name of your Redshift database (for example, “dev”).
Figure 3 – Setting your Redshift configuration in the SLO wizard.
The next step is querying the data. Nobl9 allows you to query for a single time series that will be evaluated against a threshold, or for two time series to compare (for example, the count of good requests versus total requests). Which option to choose depends on the question you want to ask.
In the first example, we want 95% of order confirmations to be completed within five minutes of the time the user enters the app. We want a single time series (all order confirmations) to be evaluated against a threshold (95%), so we’ll choose the Threshold Metric option and enter the following SQL query:
Figure 4 – Enter your metrics query.
An SLO has to exist in a time window, so the next step is to define that window. If your business requires metrics measured on a calendar cadence (monthly or quarterly), then you’ll want to choose the Calendar-Aligned option.
Rolling time windows are better suited to track recent user experience, so we’ll go with that here.
Figure 5 – Define your SLO time window.
Next, you’ll be asked to define the error budget calculation method. You have two options here: Time Slices and Occurrences. Occurrences counts specific attempts, whereas Time Slices measures how many good minutes (in which the system was operating within the defined boundaries) were achieved in a given time window.
Since we’re interested in every user action, we’ll choose Occurrences. A detailed comparison of these two methods can be found in the Nobl9 resources.
Setting Your SLO Targets
Now it’s time to define your SLO objectives. A good SLO should spark a conversation about your product, its performance, and the desired reliability. This is why you can set different objectives for a single SLO.
Let’s go back to our first goal to illustrate this idea:
- I want 99% of order confirmations to be completed within five minutes of the time the user enters the app.
This is the ideal situation—something we want to strive for. But maybe slightly lower performance is acceptable? It would probably be fine if customers spent two more minutes in our application before making the order decision.
With Nobl9, you can specify different objectives to test such hypotheses and make more informed business decisions. Define the objectives as shown in the following screenshot, and then add a name, labels, and description for the SLO in the final step of the wizard and click Create SLO.
Figure 6 – Setting SLO objectives.
Once the data is populated, we’ll be able to test our hypothesis by taking a look at the charts in the SLO grid view.
In this case, as you can see in the example below, it appears that expecting customers to complete order confirmations within five minutes is unrealistic, but expecting them to do so within seven minutes is perfectly reasonable.
Based on data like this, we could ask more questions and decide whether we want to address the situation or accept the lower objective and allocate our resources differently.
Figure 7 – Viewing SLO details.
Now, let’s take a look at the second example. In this case, we may want to be less lenient, as it directly reflects our application’s reliability. Let’s take another look at our objective:
- I want 95% of all requests to result in success (status code = 200).
To configure this SLO, we’ll repeat the same process. In this case, we’re comparing the count of good requests (not resulting in 4xx or 5xx errors) to the count of total requests made, so we’ll choose the Ratio Metric option.
Enter the following SQL query for the Good counter (numerator):
And the following SQL query for the Total counter (denominator):
Figure 8 – Example using a ratio metric with sample queries.
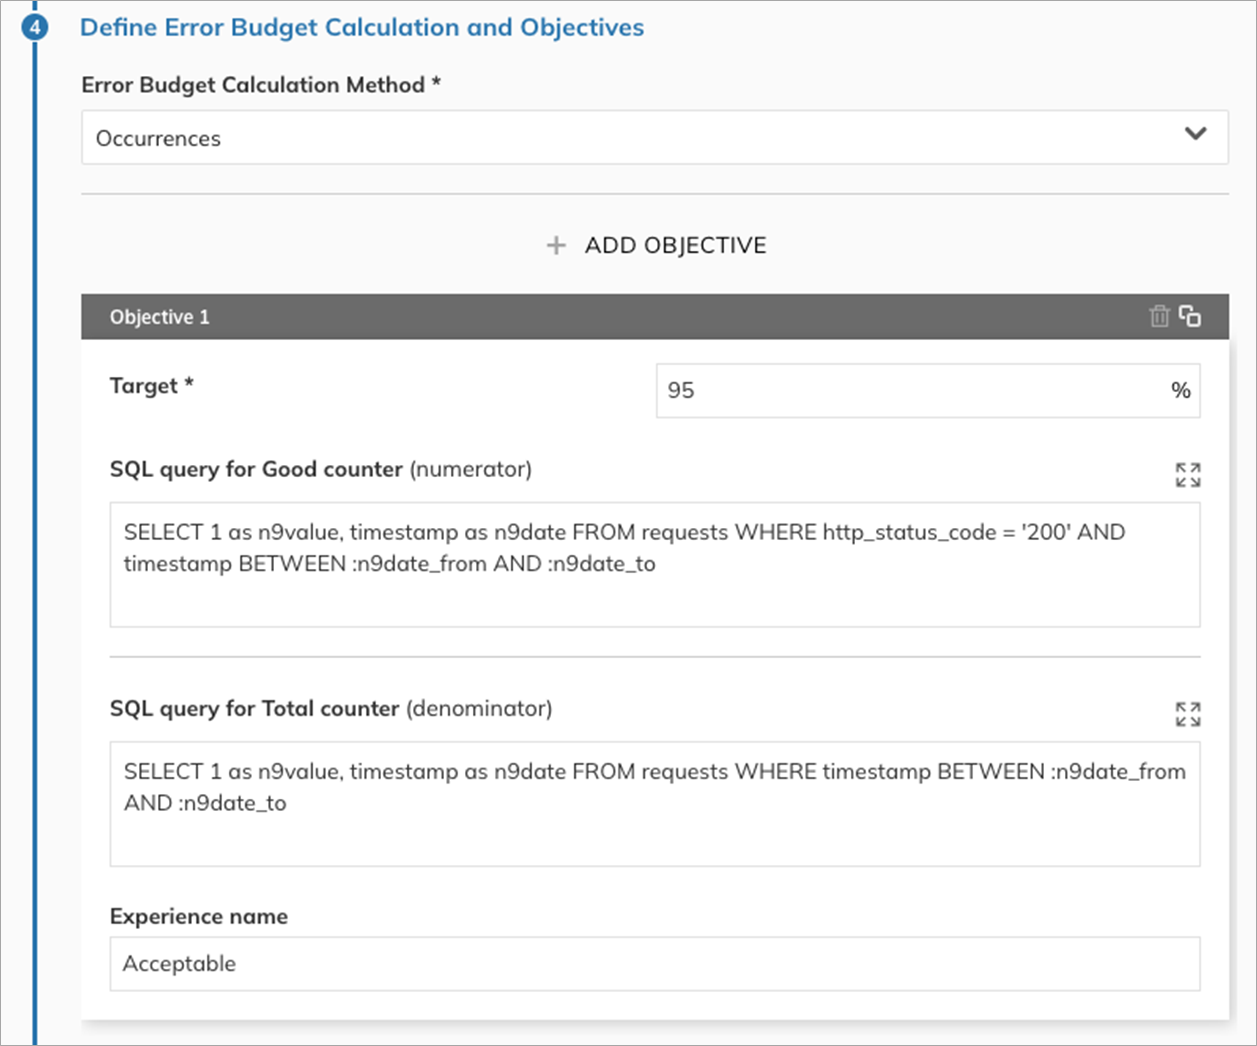
After selecting the time window, we can set the objectives for our SLO.
Figure 9 – Viewing ratio metric in SLO wizard.
Configuring our SLO like this means it’s acceptable for 5% of all requests to result in 4xx or 5xx errors.
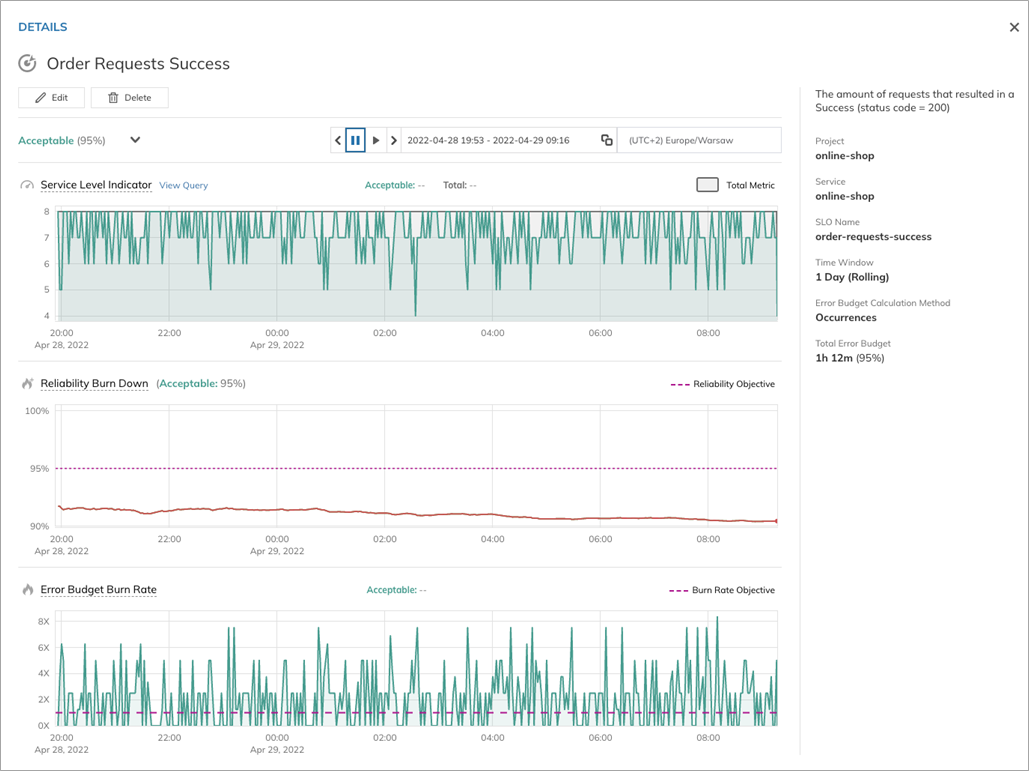
But as the chart in the SLO grid view shows, after we’ve created the SLO, even with such a wide margin, we won’t be able to achieve this level of reliability. In such a scenario, you’d likely want to take a closer look at the performance of your application and allocate resources to fix this problem as soon as possible.
Figure 10 – SLO details for ratio metrics.
You’ll also want to be alerted if the performance of your application deteriorates. In addition to setting up and monitoring SLOs, Nobl9 offers an entire ecosystem of alerts, reports, and dashboards to ensure you’re always up to date on your product’s health and, even more importantly, are able to act on early warning signs to prevent problems ahead of time.
You can configure a variety of alert methods via the Alert Methods tab of the Integrations panel, and use the Alert Policy wizard available from the Alerts panel to design alert policies that suit your needs.
Figure 11 – Setting up alert conditions.
Conclusion
Service-level objectives (SLOs) are a versatile tool that will help you make better decisions. Nobl9 aims to simplify the process of setting up and monitoring SLOs and lets you focus on asking the questions that matter to your business.
You have the data in Amazon Redshift. With Nobl9, you can make the most of it by defining SLOs at different levels of granularity that provide a window into your product’s health and reliability.
If you’d like to try Nobl9 and see how it can help your business, check out AWS Marketplace. You can also sign up for a free 30-day trial.
Nobl9 – AWS Partner Spotlight
Nobl9 is an AWS Partner that helps organizations set and understand reliability goals. The Nobl9 platform collects metrics from all of your existing monitoring systems and calculates your performance.


