AWS Partner Network (APN) Blog
Quickly Visualize Marketing Analytics and Ads Data with Matillion, Amazon Redshift, and Amazon QuickSight
By Karey Graham, Partner Technical Success Manager at Matillion
By Dilip Rajan, Partner Solution Architect at AWS
 |
Google Analytics and Google Ads are popular platforms for customers who need to make data-driven decisions about the performance of their web assets. For prediction, testing, and optimization scenarios, however, customers need a broader and more complete set of analytics.
Amazon Redshift addresses this need by making it easy for you to quickly work with your data in open formats. It provides data security out of the box, and automates common maintenance tasks.
Amazon QuickSight is a fast, fully managed business intelligence service that lets you easily create and publish interactive dashboards that include machine learning (ML) insights.
Matillion is an ideal tool to combine the power and convenience of Amazon Redshift and Amazon QuickSight. It provides cloud-native data integration tools that make loading and transforming data on Amazon Redshift fast, easy, and affordable.
Matillion is an AWS Advanced Technology Partner with the AWS Data & Analytics Competency. Matillion is also Amazon Redshift Service Ready, meaning it has been validated by AWS Partner Solutions Architects for integrating with Amazon Redshift.
In this post, we’ll present a reference architecture and step-by-step instructions for loading and transforming the data from Google Analytics and Google Ads into Amazon Redshift and visualize them on Amazon QuickSight.
Solution Overview
Matillion ETL for Amazon Redshift provides over 85 connectors for loading data into Amazon Redshift from data sources such as cloud and on-premises databases, cloud and software-as-a-service (SaaS) applications, application programming interfaces, files, and NoSQL databases.
Once your data is available is Amazon Redshift, Matillion provides a rich set of capabilities to build complex transformations for visualizations, business intelligence, reporting, and advanced analytics.
While other tools and pipelines also support similar functionality, this solution provides low setup and maintenance for the pipeline, access to large amounts of data by bypassing limits from Google Analytics and Google Ads, and minimizing data privacy risk because the data is encrypted at rest and in transit.

Figure 1 – Solution architecture and data flow.
Here is what each component in Matillion ETL for Amazon Redshift does:
- First, Matillion sends requests to each Google service.
- Google returns relevant Ads or Analytics data to Matillion.
- Matillion streams the data as it arrives to the instance of Amazon Simple Storage Service (Amazon S3). The data is not persisted to disk.
- Once all data is stored in S3, Matillion issues a COPY command to Amazon Redshift, passing the names of the files and other relevant metadata.
- Amazon Redshift accesses the data and loads it into appropriate target tables.
- Matillion automatically deletes any files created in S3 during this job execution, whether the operation succeeded or failed.
How to Set Up the Solution Architecture
We’ll walk you through the following steps:
- Set up Matillion and Amazon Redshift using an AWS CloudFormation template.
- Set up Google Analytics and Google Ads on Matillion ETL for Amazon Redshift.
- Load and transform data on Matillion.
- Visualize the data on Amazon QuickSight.
Prerequisites
- You must have an AWS account to perform this procedure. If you don’t already have one, sign up for AWS.
- Create an AWS Identity and Access Management (IAM) user.
- Set up a Google account with access to Analytics/Ads data and OAuth enabled.
Step 1: Set Up Matillion and Amazon Redshift
Matillion ETL for Amazon Redshift is available on AWS Marketplace. Follow the setup instructions provided with the latest AWS CloudFormation templates. Once you launch the AWS CloudFormation stack, you can move on to Step 2.
By the way, an AWS Matillion Quick Start is available to help you deploy Matillion with a high availability architecture.
Step 2: Set Up Google Analytics and Google Ads on Matillion
In the Matillion environment, the extract and load of data into Amazon Redshift is handled entirely within an orchestration job. Let’s create a job that extracts our Ads and Analytics data from the source and loads it into Amazon Redshift.
Using the right mouse button, select Open Project in Project Explorer, and then select Add Orchestration Job.
Another benefit of Matillion Orchestration jobs is the literal creation of a data pipeline through the use of components and connectors. Each component is completely self-contained, so no additional software installation is required. They are also within the scope of an ordinary Matillion license, so there’s no additional cost for using any component.
With the workspace and components pane now enabled, let’s begin by extracting data from our Ads and Analytics components. Enter the search term Google in the search bar of the components pane to display a list of the components.

Figure 2 – Enter Google in Matillion components pane to see the Google components.
2a: Create Google Ads Query
Let’s begin with the Google Ads Query component. This component allows you to extract data from one or more accounts into your data warehouse to analyze the spend and performance of campaigns/ads and, where appropriate, compare them with your investments on other marketing platforms.
Drag the component from the pane to the Start component to connect them.
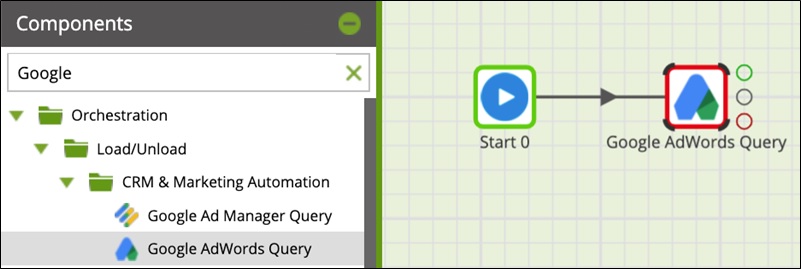
Figure 3 – Drag Google Ads Query to the Start component.
You can now configure these fields in Google Ads Query using the Properties pane:
- Authentication — You must have OAuth set up within your Google account(s) to pass details such as Developer Token and Client Customer ID to the component.
- Basic/Advanced Mode — You can define how to select the desired dataset from the Ads account. Basic Mode enables a wizard interface composed of fields you can edit, and Advanced Mode allows you to write a SQL statement to define the source and fields to be returned.
- Data Source — Select a table from a drop-down list composed of Google Ads entities modeled as tables.
- Data Selection — Choose from one to as many fields as are available based on the data source selected.
- Data Source Filter — Use a wizard interface to define criteria for the returning dataset. Strings, numbers, dates, and other data types can be defined here.
- Staging and Target Table — You can define how staging is to be managed, as well as the table in Amazon Redshift the data is ultimately loaded to.

Figure 4 – Configure Google Ads Query properties
After you configure its properties, the Google Ads Query appears inside a green border, signifying it’s in a valid state. You can now extract its data and load it into Amazon Redshift.
2b: Create Google Analytics Query
The Google Analytics Query component uses the Google Analytics API to retrieve data. This data resides in a Google Analytics View, which can then be loaded into a table.
Matillion is dynamic in that it allows you to establish workflow “paths,” in which actions take place in a sequential fashion. Alternatively, you can establish a workflow in which actions take place concurrently. In this case, data from Google Analytics Query is loaded in place after the Google Ads Query has concluded.
Again using the search term Google in the pane, drag the component to the right of Google Ads Query and connect the two components.
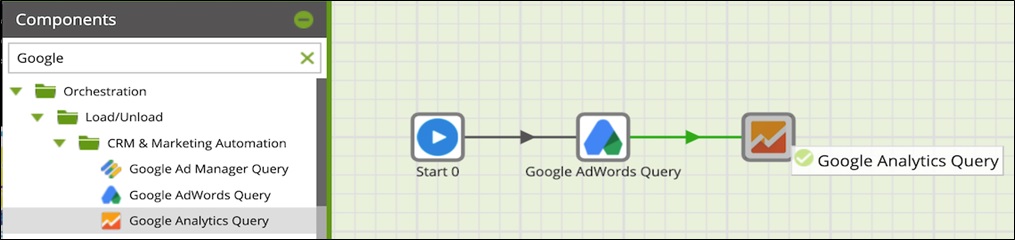
Figure 5 – Drag Google Analytics Query to the Start component.
You can now configure the component using the Properties pane. These properties are the same as for Google Ads Query, except for Authentication, which is slightly different:
- Authentication — If you’re setting up Google Analytics Query under the same account as Google Ads Query, you can choose the same OAuth credentials. If not, complete OAuth set up within your Google account(s) to pass details such as Developer Token and Client Customer ID to the Google Analytics Query components.
- Basic / Advanced Mode — Basic Mode enables a wizard interface composed of fields you can edit, and Advanced Mode allows you to write a SQL statement to define the source and fields to be returned.
- Data Source — Select a table from a drop-down list composed of Google Analytics entities modeled as tables.
- Data Selection — Choose from one to as many fields as are available based on the data source selected.
- Data Source Filter — Use a wizard interface to define criteria for the returning dataset. Strings, numbers, dates, and other data types can be defined here.
- Staging and Target Table — You can define how staging is to be managed, as well as the table in Amazon Redshift the data is ultimately loaded to.
After you configure its properties, the Google Analytics Query appears inside a green border, signifying it’s in a valid state. You can now extract its data and load it into Amazon Redshift.
Use the right mouse button on any area in the open space, and then select Run Job.
This completes the build of your orchestration job. Data is extracted from Ads and Analytics and loaded in a raw state to the destination specified in Amazon Redshift.
You can use this job to load any Google Analytics dataset you might have. If you don’t have an Analytics dataset available, Google analytics provides a large dataset you can use for testing.
Step 3: Load and Transform Data on Matillion
In addition to being a method through which data can be loaded to Amazon Redshift from the source, Matillion also allows for the transformation of data as it resides in Amazon Redshift. Data can be cleaned and reverted to a usable state using native Amazon Redshift SQL commands being pushed down from Matillion.
This pushdown architecture allows you to validate the arguments you enter into components. For example, let’s say that when using a Filter component you want to check how the SQL is written when you set the field dayofweek to 1:

Figure 6 – Validating the arguments you enter into a Filter component.
Located on the Properties pane is a tab labeled SQL. After setting the Filter Condition, go there to verify the SQL is being generated in the desired component, and enter it into a Query editor within Amazon Redshift.
Create a Transformation job by selecting the project with the right mouse button and selecting Add Transformation Job from the pop-up menu.
Once in a Transformation job, you can perform four categories of actions: Read, Join, Transform, and Write:
![]()
Figure 7 – Four categories of actions in a Transformation job.
To start the transformation flow, read the data as it resides in an Amazon Redshift table, using the Table Input component. Expand the Read folder and drag out the Table Input as the first component on the workspace.

Figure 8 – Select Table Input.
The Table Input component is simple to set up—simply select the fields you want to be read into the Amazon Redshift environment.
Next, you may want to join two different sources of data. You can do this in a number of ways, as indicated by the number of components available in the Join folder. Select the Join component and link two different Table Input components to create a conjoined dataset.
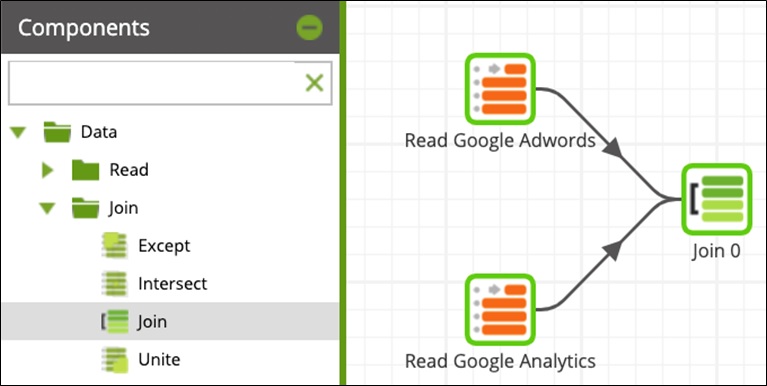
Figure 9 – Use the Join component to combine data from multiple sources
Joins are defined in Matillion with many of the same arguments you would write into a SQL statement:
- Main Table — The name of the input table, usually the one whose data you wish to preserve in the output.
- Main Table Alias — A string you define to establish which fields belong to which table(s).
- Joins — The table the Main Table will be joining to. Here, you also define the alias for the joined table, as well as the type of join (Inner, Left, Right, Full).
- Join Expressions — The configuration required for how the join is to take place. Define a formula in which fields are evaluated for the resulting dataset.
- Output Columns — The fields from either table that populate the resulting dataset. The aliases used in the prior fields are used for identification.
With the data selected and joined, Matillion enables you to debug and validate your work in transformations. After the operation is complete, you can navigate to the SQL tab of the Join component to view the SQL statement generated.
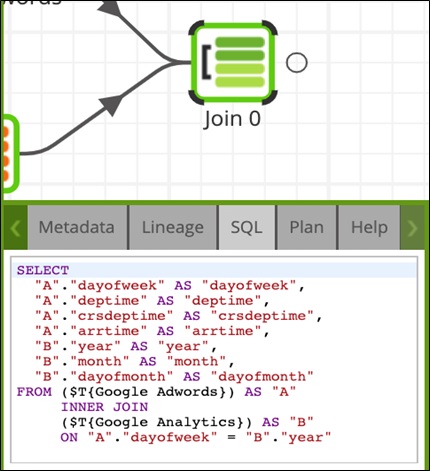
Figure 10 – Navigate to the SQL tab of the Join component to view the SQL statement generated.
You can then compare the SQL statement to already-existing code used in the Query editor. You can also choose to write your own verification query in a SQL Query component. With confidence the SQL code is valid, you can transform the data in a way that derives value from the dataset.
Next, do the same with the Calculator component inside the Transform folder.
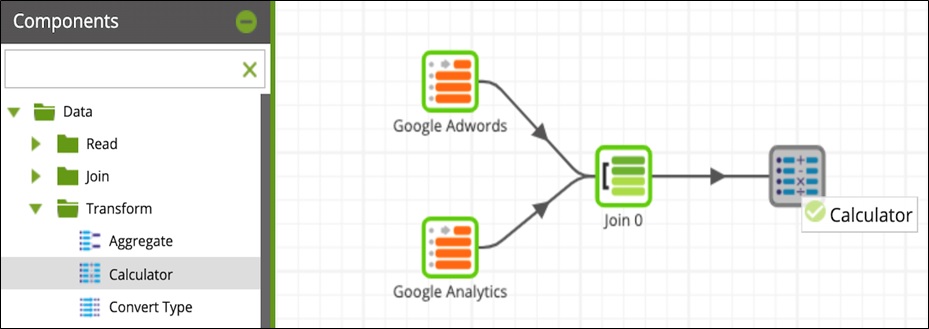
Figure 11 – Repeat with the Calculator component.
Using the Calculator component, you have the ability to research native Amazon Redshift functions. After selecting a function, you can write out an expression that can replace the values of an already-existing column, or create a new column with the values defined in an expression.
In the example below, the search term if is used to research the functions available. Highlighting the returned function NULLIF, you can see a description, syntax, and a link to official Amazon Redshift documentation that explains how to write such a function.
The function for NULLIF was written on an already-existing column, year. By specifying year_revised as the name of the expression, this function creates a new field with the resulting evaluation on the year field.
The data has been read from Amazon Redshift, joined on a mutual field, and updated based on a set of conditions. The finalized dataset can be saved into a new database object in the Amazon Redshift instance.
Within the Write category of components, you have a variety of options available for how the data is to be written back into Amazon Redshift. Create a view of the resulting dataset by dragging the Create View component as the next and final step in the workflow.

Figure 12 – Draft the Create View component into the flow.
After you define the name of the new view in the component, the job will be in a valid state (green border), and ready to be run. Move the right mouse button anywhere in the workspace and select Run Job.
Step 4: Visualize Data Using Amazon QuickSight
To visualize the data in Amazon QuickSight, create a new analysis and select the Amazon Redshift table where the final data set of the transform job resides.
You can choose to write a custom query and directly query your data from Amazon Redshift. You can also select various visual types such as heat maps and pie charts to build your Amazon QuickSight dashboard.
Conclusion
You can easily import Google Ads and Analytics data into an Amazon Redshift instance, and transform it into a usable state with Matillion. With its wizard-based interface, gone are the days of needing to memorize the structure of the incoming dataset and destination.
Users with no technical background are empowered to build out their pipelines so their data can be stored in Amazon Redshift and visualized in Amazon QuickSight.
The combination and Amazon Redshift and Amazon QuickSight gives you a scalable, secure, and fully-managed way to get the marketing analytics you need. You can extend this solution to add more data sources from other marketing channels to derive a complete picture of your organization’s marketing efforts and campaigns.
Matillion ETL for Amazon Redshift is available on AWS Marketplace.
.

.
Matillion – AWS Partner Spotlight
Matillion is an AWS Competency Partner that delivers modern, cloud-native data integration technology designed to solve top business challenges.
Contact Matillion | Solution Overview | AWS Marketplace
*Already worked with Matillion? Rate the Partner
*To review an APN Partner, you must be an AWS customer that has worked with them directly on a project.