AWS Big Data Blog
Accelerate self-service analytics with Amazon Redshift Query Editor V2
August 2023: This post was reviewed and updated with new features.
Amazon Redshift is a fast, fully managed cloud data warehouse. Tens of thousands of customers use Amazon Redshift as their analytics platform. Users such as data analysts, database developers, and data scientists use SQL to analyze their data in Amazon Redshift data warehouses. Amazon Redshift provides a web-based query editor in addition to supporting connectivity via ODBC/JDBC or the Redshift Data API. Query Editor V2 lets users explore, analyze, and collaborate on data. You can use Query Editor V2 to create databases, schemas, tables, and load data from Amazon Simple Storage Service (S3) either using COPY command or using a wizard . You can browse multiple databases and run queries on your Amazon Redshift data warehouse, data lake, or federated query to operational databases such as Amazon Aurora.
From the smallest start-ups to worldwide conglomerates, customers across the spectrum tell us they want to promote self-service analytics by empowering their end-users, such as data analysts and business analysts, to load data into their analytics platform. Analysts at these organizations create tables and load data in their own workspace, and they join that with the curated data available from the data warehouse to gain insight. This post will discuss how Query Editor V2 accelerates self-service analytics by enabling users to create tables and load data with simple wizards.
The Goal to Accelerate and Empower Data Analysts
A common practice that we see across enterprises today is that more and more enterprises are letting data analysts or business analysts load data into their user or group workspaces that co-exist on data warehouse platforms. Enterprise calls these personal workspaces, departmental schemas, project-based schemas or labs, and so on. The idea of this approach is to empower data analysts to load data sets by themselves and join curated data sets on a data warehouse platform to accelerate the data analysis process.
Amazon Redshift Query Editor V2 makes it easy for administrators to create the workspaces, and it enables data analysts to create and load data into the tables. Query Editor V2 lets you easily create external schemas in Redshift Cluster to extend the data warehouse to a data lake, thereby accelerating analytics.
An example Use case
Let’s assume that an organization has a marketing department with some power users and regular users. In this example, let’s also consider that the organization already has an Enterprise Data Warehouse (EDW) powered by Amazon Redshift. The marketing department would like to have a workspace created for their team members.
A visual depiction of a Data Warehouse Environment may look like the following figure. Enterprises let user/group schemas be created along with an EDW, which contains curated data sets. Analysts can create and load exploratory data sets into user schemas, and then join curated data sets available in the EDW.
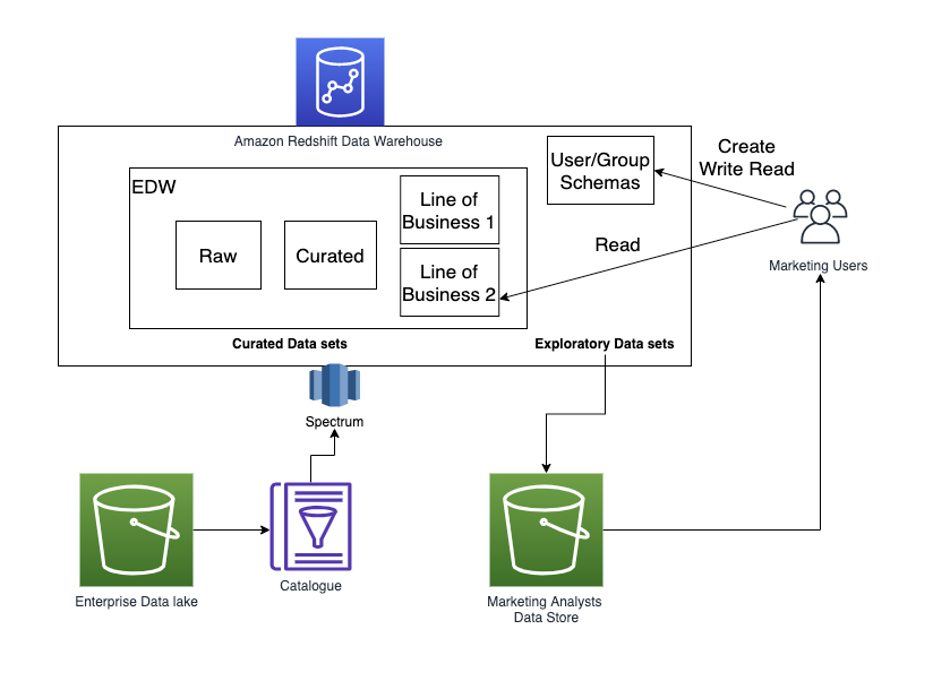
Amazon Redshift provides several options to isolate your users’ data from the enterprise data warehouse data. Amazon Redshift data sharing lets you share data from your EDW cluster with a separate consumer cluster. Your users can consume the EDW data and create their own workspace in the consumer cluster. Alternatively, you can create a separate database for your users’ group workspace in the same cluster, and then isolate each user group to have their own schema. Amazon Redshift supports queries of data joining across databases, and then users can join their tables with the curated data in the EDW. We recommend you use the data sharing option that lets you isolate both compute and data. Query Editor v2 supports both scenarios.
Once you have enabled your data analysts to have their own workspace and provided the relevant privileges, then they can easily create Schema, table, and load data.
Prerequisites
- You have an Amazon Redshift cluster, and you have configured the Query Editor V2. You can view the Simplify Data Analysis with Amazon Redshift Query Editor V2 post for instructions on setting up Query Editor V2.
- For loading your data from Amazon S3 into Amazon Redshift, you will start by creating an IAM role to provide permissions to access Amazon S3 and grant that role to the Redshift cluster. By default, Redshift users assume that the IAM role is attached to the Redshift cluster. You can find the instructions in the Redshift getting started guide.
- For users who want to load data from Amazon S3, Query Editor V2 provides an option to browse S3 buckets. To use this feature, users should have List permission on the S3 bucket.
Create Schemas
The Query Editor V2 supports the schema creation actions. Likewise, admins can create both native and external schemas by using Create Schema wizard.
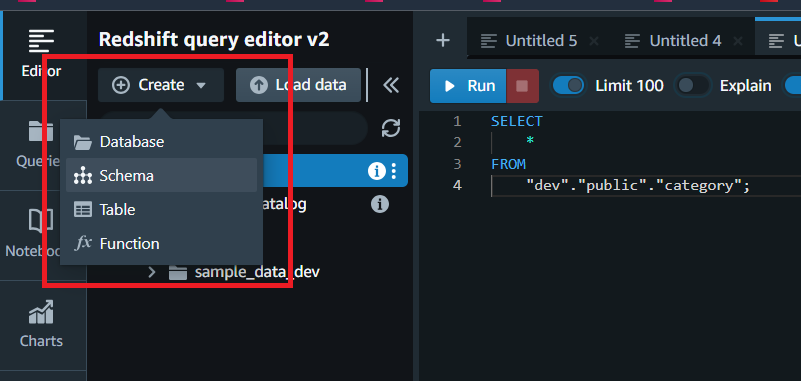
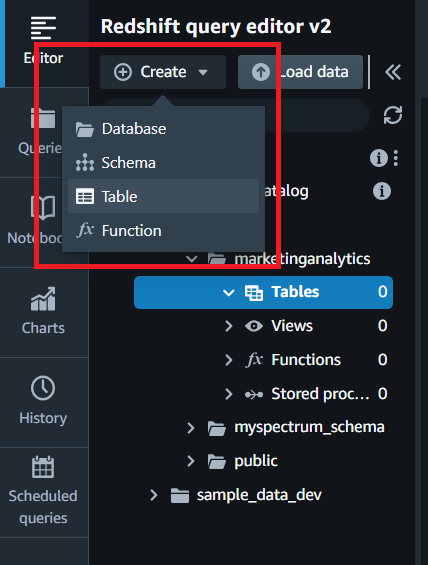
As a user, you can easily create a schema by accessing Create Schema wizard available from the Create button, and then selecting Schema from the drop-down list, as shown in the following screenshot.
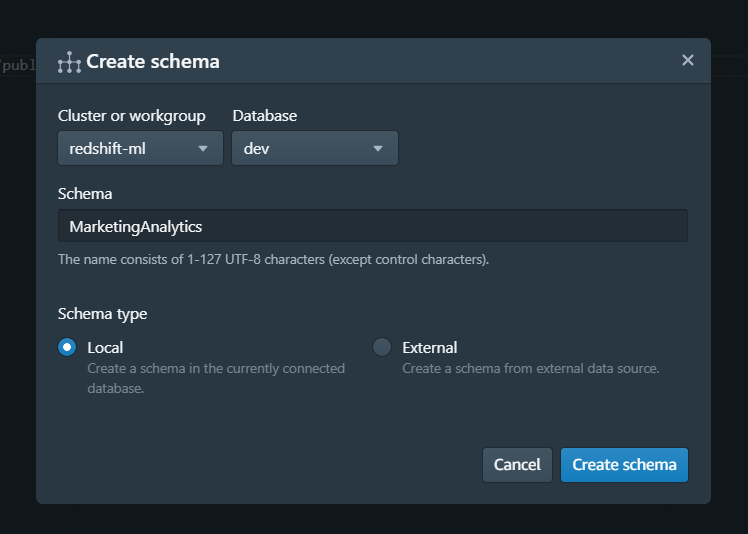
You can then choose a local schema and provide a schema name.
Creating Tables
The Query Editor V2 provides a Create table wizard for users to create a table quickly. It allows power users to auto-create the table as based on a data file. Users can upload the file from their local machine and let Query Editor V2 figure out the data types and column widths. Optionally, you can change the column definition, such as encoding and table properties.
Below is a sample CSV file with a row header and sample rows from the marketing_campaign.csv file.
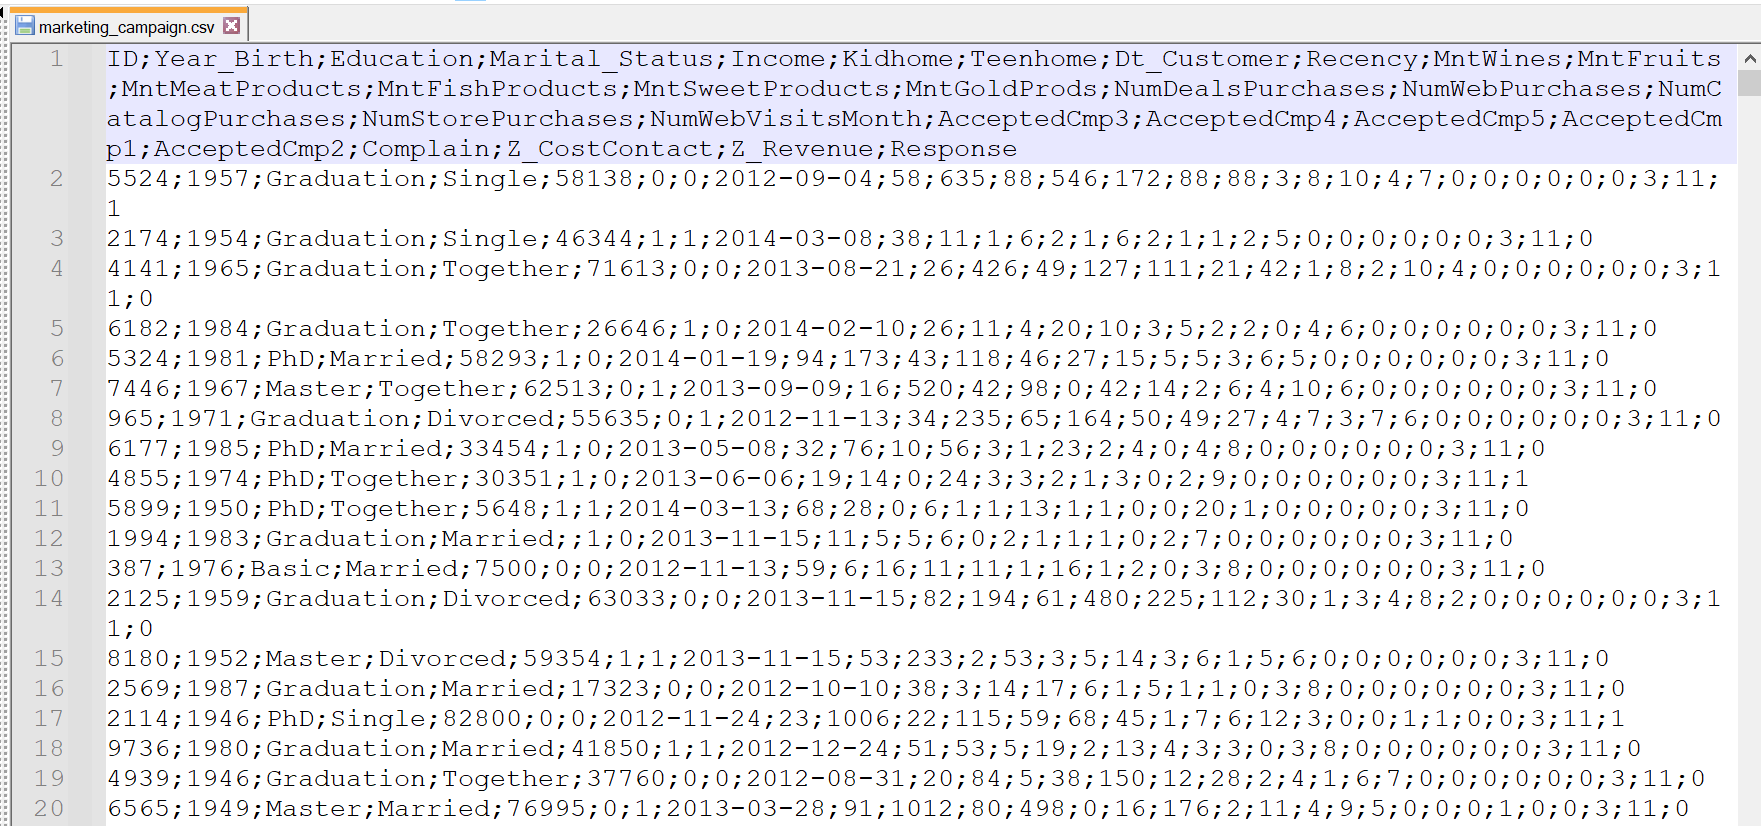
We will demonstrate how to create a table based on this file in the following screenshots.
The next screenshot shows the upload process of marketing_campaign.csv file into Query Editor V2.

Create Table Wizard has two sections:
- Columns
The Columns tab lets users select a file from their local desktop and upload it to Query Editor V2. Users can choose Schema from the drop-down option and provide a table name.
Query Editor V2 automatically infers columns and some data types for each column. It has several options to choose from to set as column properties. For example, you have the option to change column names, data types, and encoding. If you do not choose any encoding option, then the encoding choice will be selected automatically. You can also add new fields, for example, an auto-increment ID column, and define properties for that particular identity column.

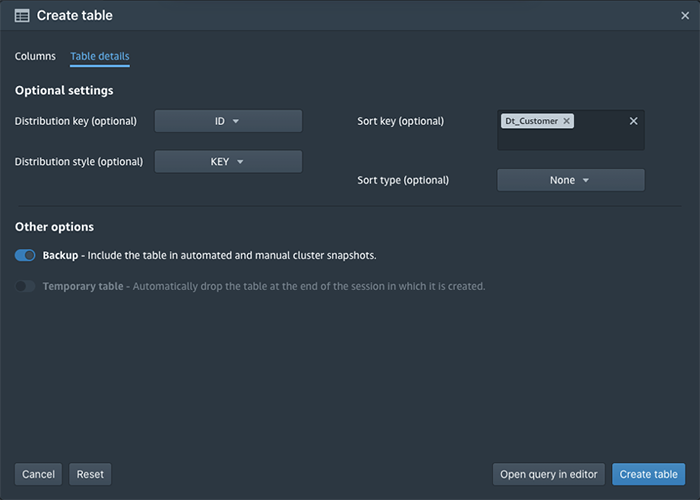
- Table Details
You can use the Create Table wizard to create a temporary table or regular table with the option of including it in automatic backups. The temporary table is available until the end of the session and is used in queries. A temporary table is automatically dropped once a user session is terminated.
The “Table Details” is optional, as Amazon Redshift’s Automatic Table Optimization feature takes care of Distribution Key and Sort Key on behalf of users.
- Viewing Create Table Statement
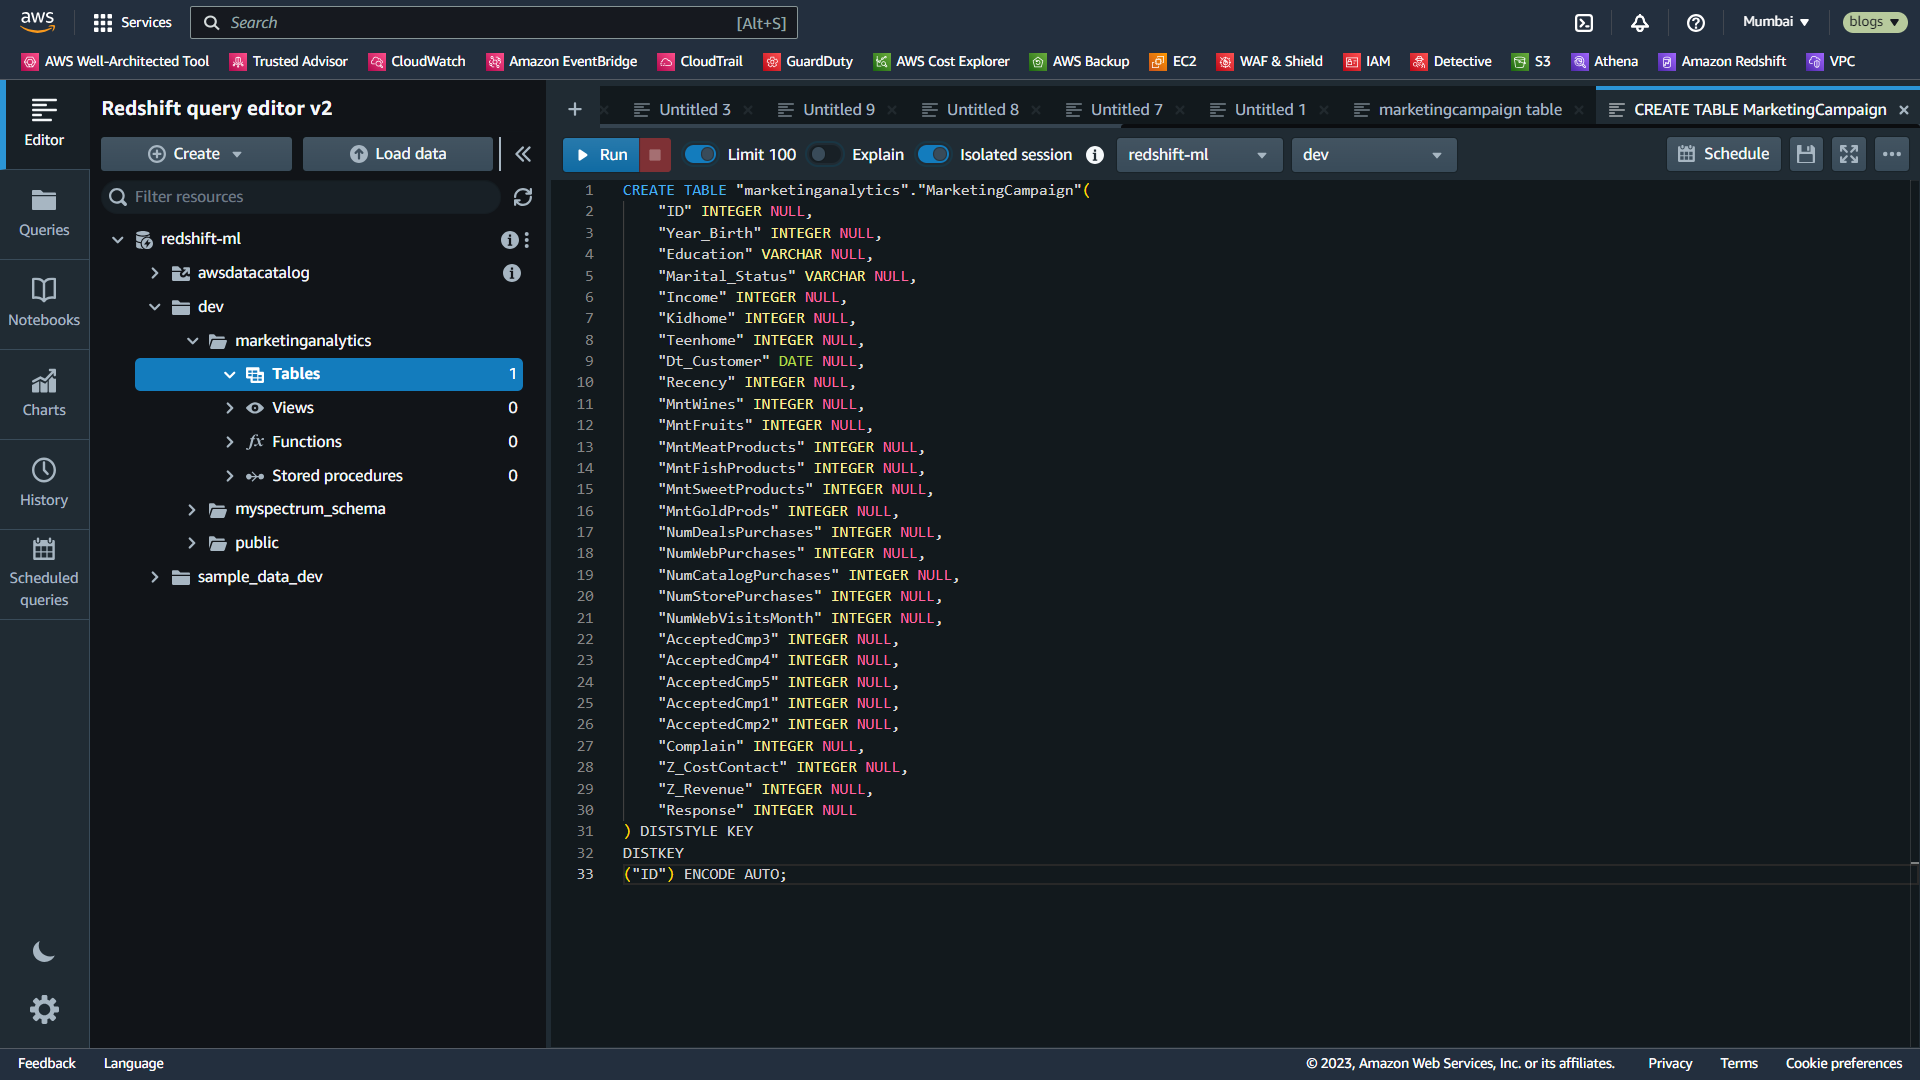
Once the column and table level detail is set, Query Editor V2 gives an option to view the Create table statement in Query Editor tab. This lets users save the definition for later use or share it with other users. Once the user reviews the create table definition, then the user can hit the “Run” button to run the query. Users can also directly create a table from the Create table wizard.
The following screenshot shows the Create table definition for the marketing campaign data set.
Query Editor V2 lets users view table definitions in a table format. The following screenshot displays the table that we created earlier. Query Editor V2 distinguishes columns by data types in a table by using distinct icons for them.
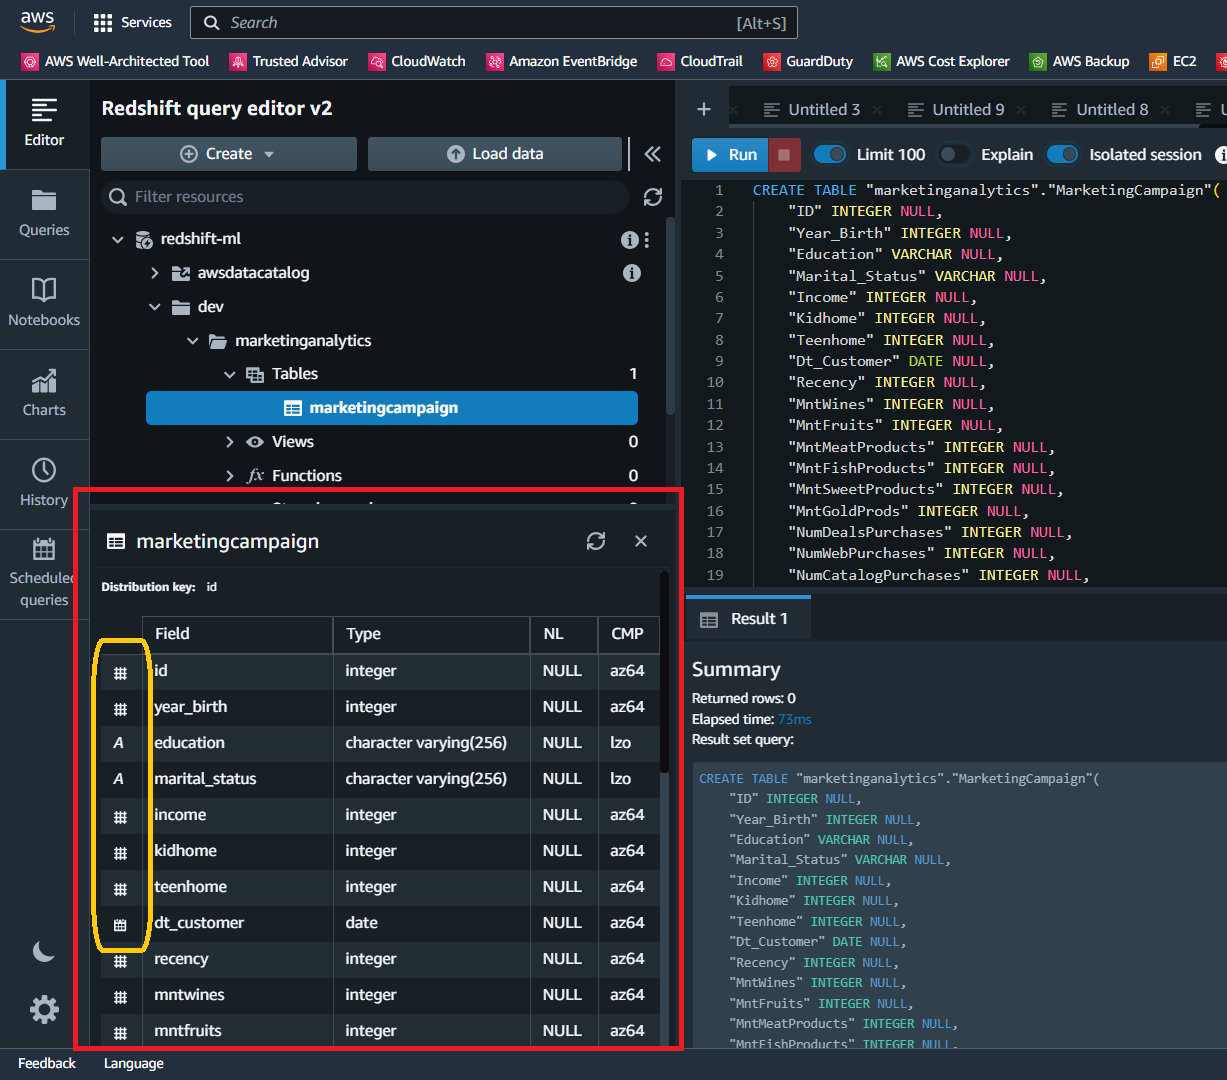
Note that Amazon Redshift automatically inferred encoding type for each column.
When creating the table, we did not set the encodings for columns manually, as Amazon Redshift can automatically set the best compression methods for every column.
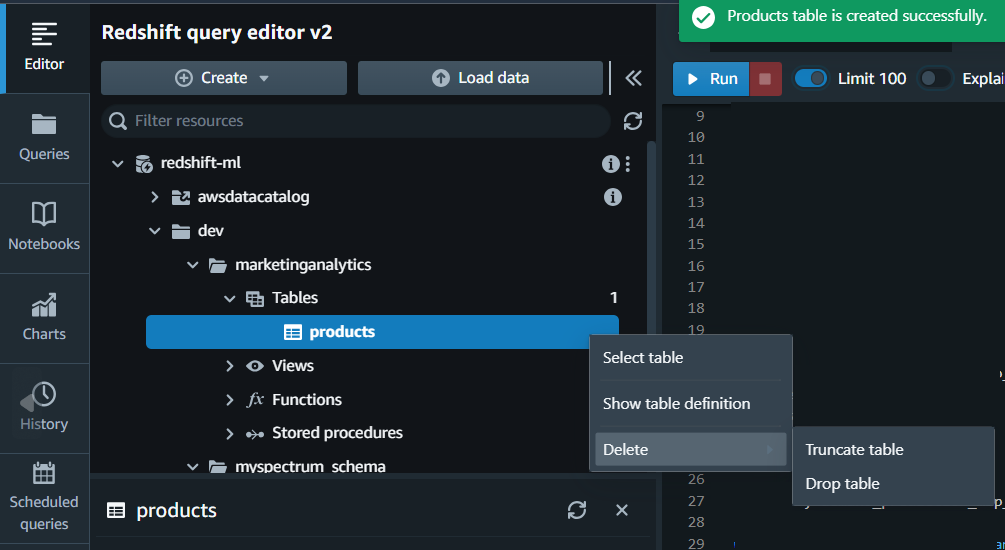
You can also view the table definition by right-clicking on the table and selecting the Show table definition option. You can also generate a template select command, and drop or truncate the table by right-clicking on a table.
Loading Data
Now that we have created a schema and a table, let’s learn how to upload the data to the table that we created earlier.
Query Editor V2 provides you with the ability to load data for S3 buckets to Redshift tables. The COPY command is recommended to load data in Amazon Redshift. The COPY command leverages the massively parallel processing capabilities of Redshift. The Load Data wizard in the Query Editor V2 loads data into Redshift by generating the COPY command. As a data analyst, you don’t have to remember the intricacies of the COPY command. You can quickly load data from CSV, JSON, ORC, or Parquet files to an existing table using the Load Data Wizard. It supports all of the options in the COPY command. The Load Data Wizard lets Data analysts build a COPY command with an easy-to-use GUI.
The following screenshot shows an S3 bucket that has our marketing_campaign.csv file. We will use this file to walk you through the Load Data wizard.

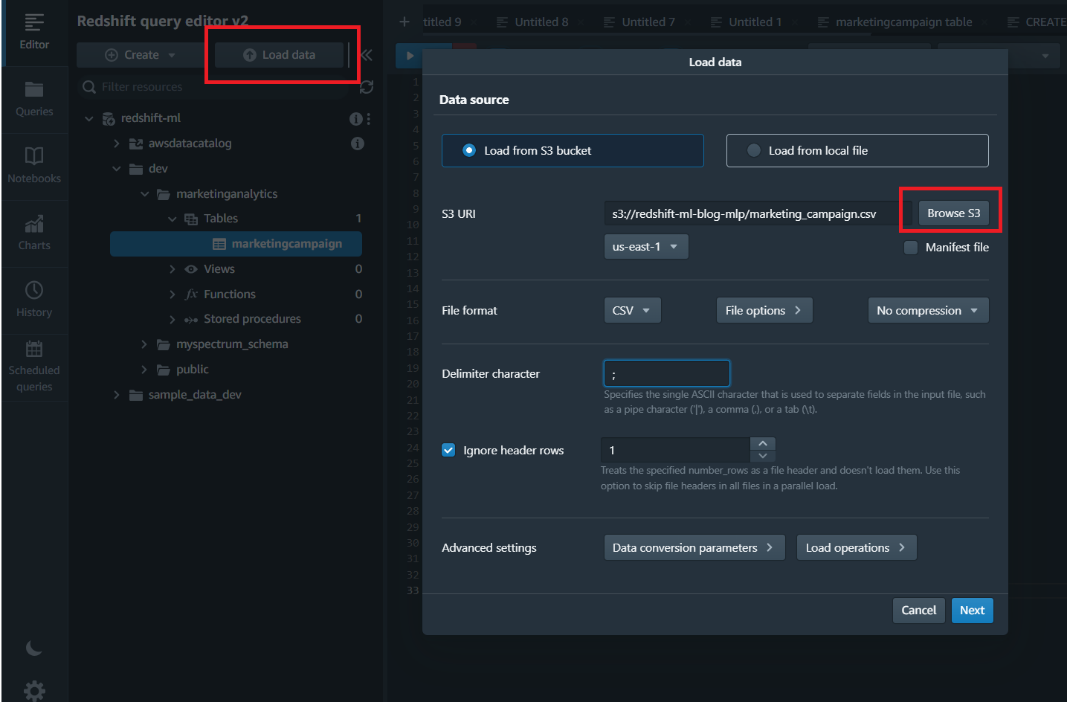
The Load Data wizard lets you browse your available S3 bucket and select a file or folder from the S3 bucket. You can also use a manifest file. A manifest file lets you make sure that all of the files are loaded using the COPY command. You can find more information about manifest files here.
The Load Data Wizard lets you enter several properties, such as the Redshift Cluster IAM role and whether data is encrypted. You can also set file options. For example, in the case of CSV, you can set delimiter and quote parameters. If the file is compressed, then you can provide compression settings.
With the Data Conversion Parameters, you can select options like Escape Characters, time format, and if you want to ignore the header in your data file. The Load Operations option lets you set compression encodings and error handling options.
Query Editor V2 lets you browse S3 objects, thereby making it easier to navigate buckets, folders, and files. Below screen displays the flow:
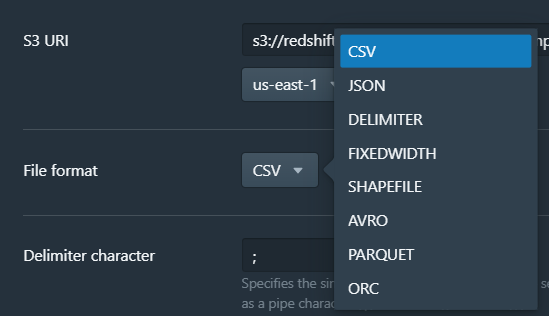
Query Editor V2 supports loading data of many open formats, such as CSV, JSON, Delimiter, FixedWidth, Shapefile, AVRO, Parquet, and ORC.
In our example, we are loading CSV files by specifying the delimiter character and header row existence. You can even select more parameters under ‘Advanced settings’ for data conversion and load operations. For now, we will go ahead with the defaults.
On the next page, you can select the appropriate IAM role for being able to load the file successfully to an existing or a new table.
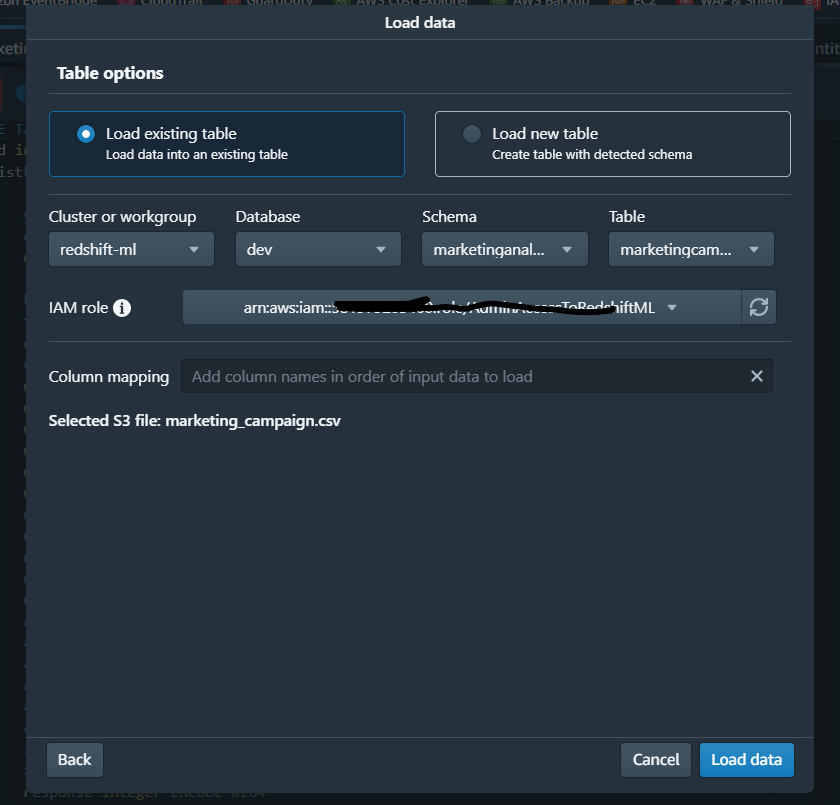
Once the required parameters are set, click ‘Load data’. Load Data operation builds a copy command and automatically loads it into Query Editor Tab, and then invokes the query.
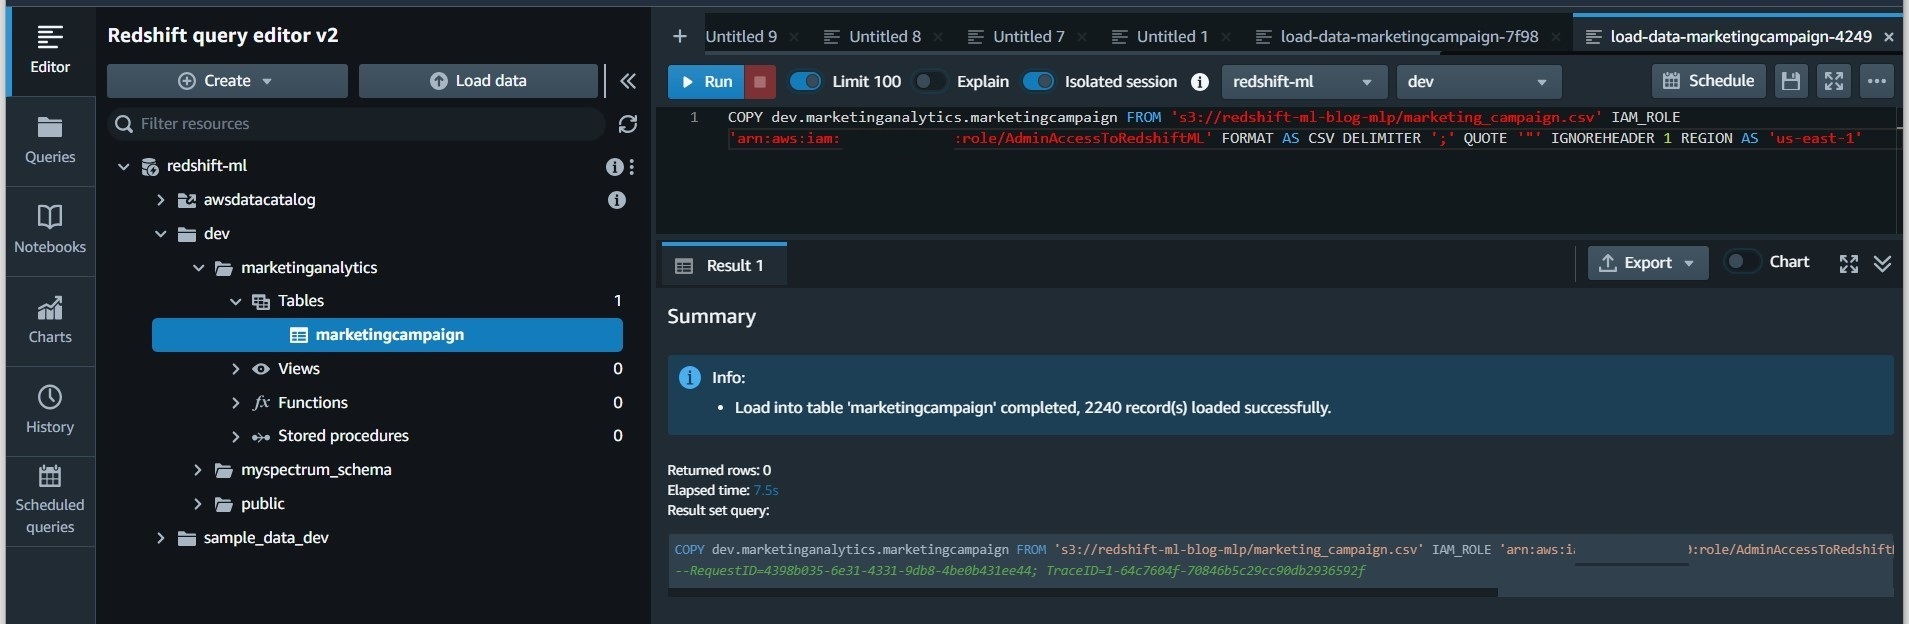
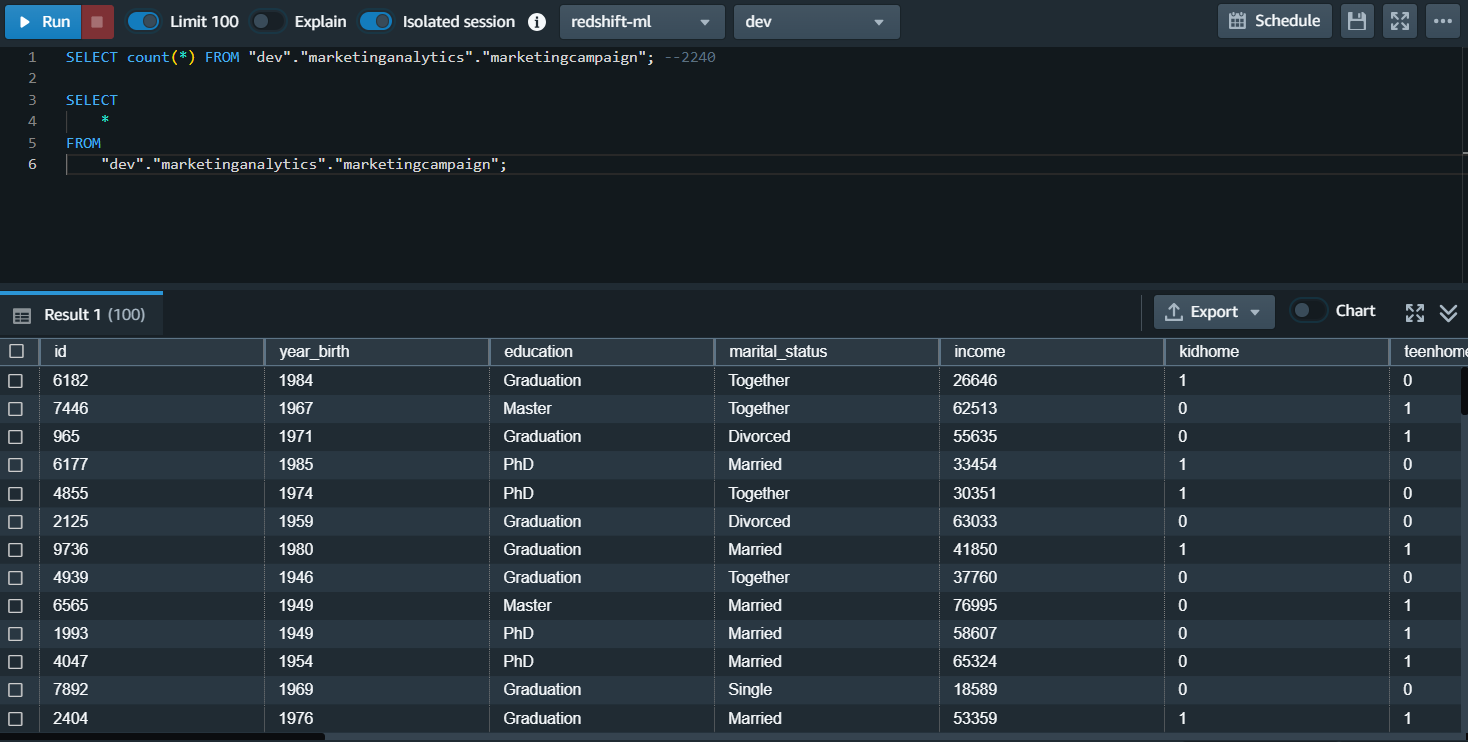
Data is loaded into the target table successfully, and now you can run a query to view that data. The following screen shows the result of the select query executed on our target table:
Viewing load errors
If your COPY command fails, then these are logged into STL_LOAD_ERRORS system table. Query Editor v2 simplifies the viewing of the common errors by showing the errors in-place as shown in the following screenshot:

Saving and reusing the queries
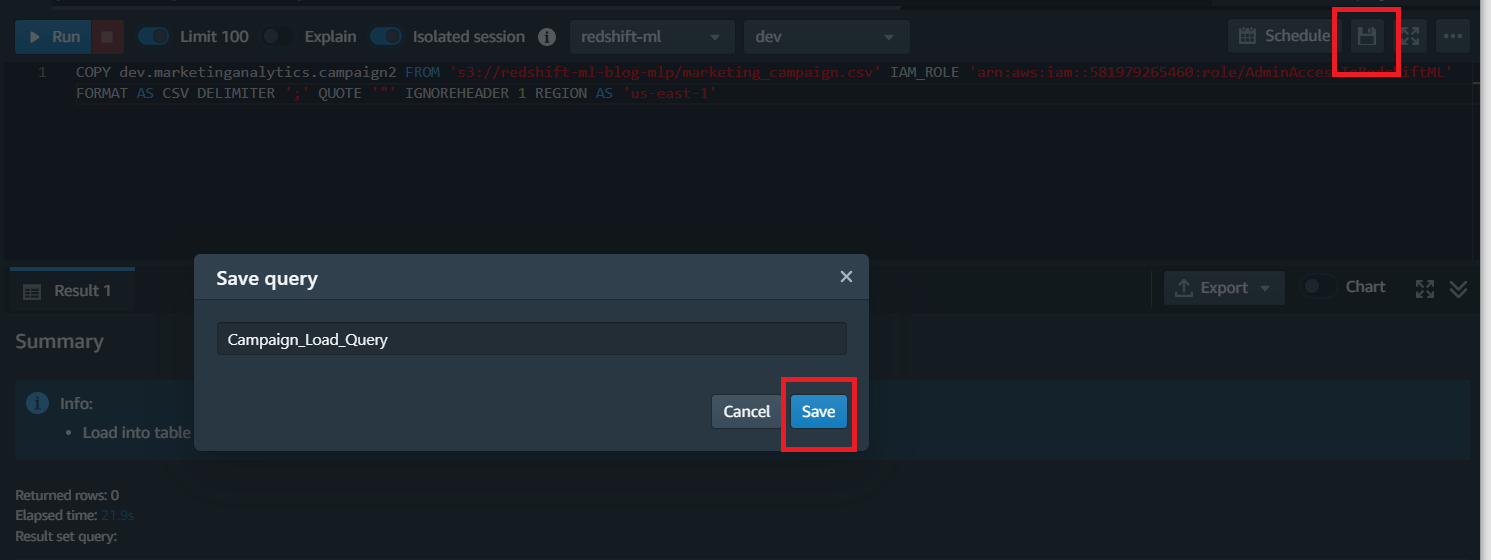
You can save the load queries for future usage by clicking on the ‘Save’ button and providing a name in the textbox.
To browse saved queries, choose Queries from the navigation pane. You can view queries under My queries, Shared by me, or Shared to my team. These queries can appear as individual queries or within folders you created. You can save the query, and even share it with another user.

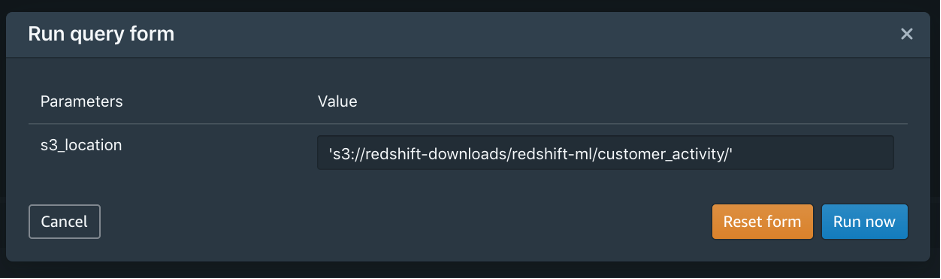
When you or other users run the query, a prompt for the parameter will appear as in the following screenshot:
If you would like to run the data ingestion operation iteratively on a schedule, instead of reusing the saved query manually; then you can automate it by using the Schedule Query+ feature.
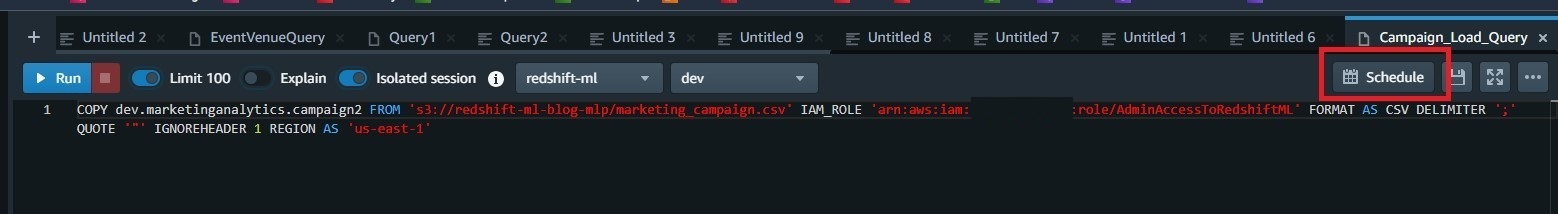
You can schedule it either based upon a set frequency or using cron format.

Watch this video to know more:
So far, we discussed how data analysts could load data into their own or to the group’s workspace.
We will now discuss using Query Editor V2 to create an external schema to extend your data warehouse to the data lake.
Extending the Data Warehouse to the Data Lake
Extending Data warehouses to Data lakes is part of modern data architecture practices. Amazon Redshift enables this with seamless integration through Data lake running on AWS. Redshift uses Spectrum to allow this extension. You can access data lakes from the Redshift Data warehouse by creating Redshift external schemas.
Query Editor V2 lets you create an external schema referencing an external database that is either AWS Glue Data Catalogue, Or a PostgreSQL data source or simply MySQL. You can find more information about external Schema here.
You can navigate to the Create External Schema by using Create Schema wizard, and then selecting the External Schema as shown in the following screenshot:
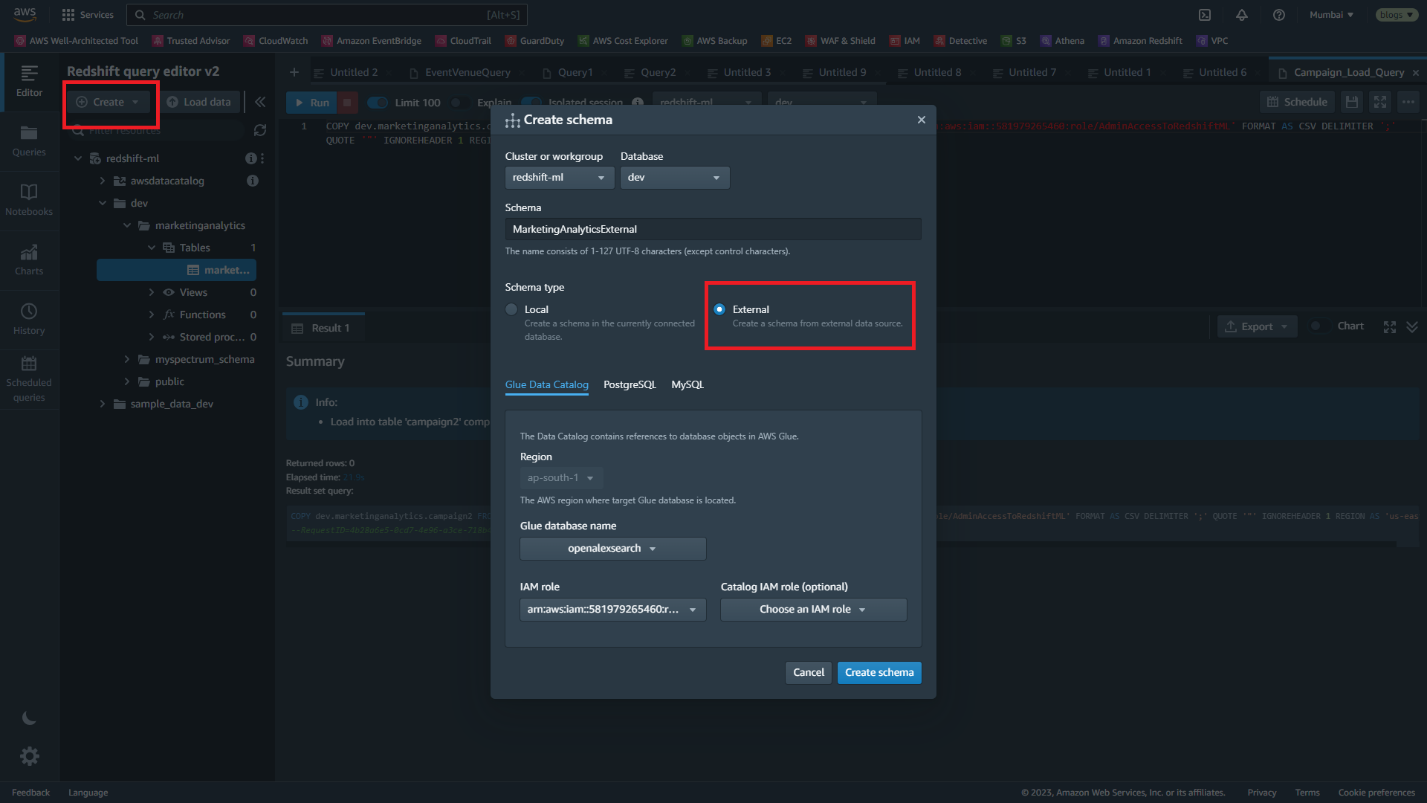
The Query Editor V2 makes the schema creation experience very easy by hiding the intricacies of the create external schema syntax. You can use the simple interface and provide the required parameters, such as Glue data regions, external database name, and the IAM role. You can browse the Glue Catalog and view the database name.
After you use the create schema option, you can see the schemas in the tree-view. The Query Editor V2 uses distinct icons to distinguish between native Schema and external Schema.
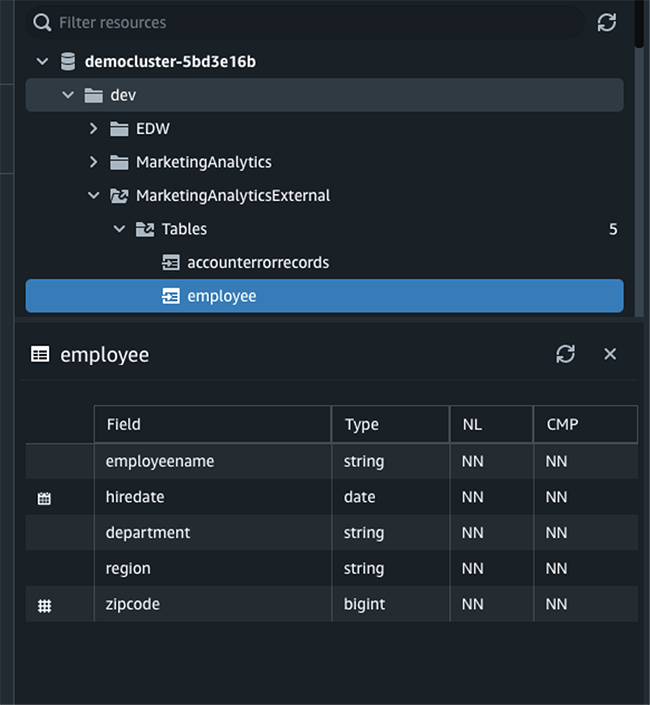
Viewing External Table Definitions
The Query Editor V2 lets data analysts quickly view objects available in external databases and understand their metadata.
You can view tables and columns for a given table by clicking on external Schema and then on a table. When a particular table is selected, its metadata information is displayed in the bottom portion below the tree-view panel. This is a powerful feature, as an analyst can easily understand the data residing externally in the data lake.
You can now run queries against external tables in the external Schema.
In our fictitious enterprise, Marketing Department team members can load data in their own workspace and join the data from their own user/group workspace with the curated data in the enterprise data warehouse or data lake.
Conclusion
This post demonstrated how the Query Editor V2 enabled data analysts to create tables and load data from Amazon S3 easily with a simple wizard.
We also discussed how Query Editor V2 lets you extend the data warehouse to a data lake. The data analysts can easily browse tables in your local data warehouse, data shared from another cluster, or tables in the data lake. You can run queries that can join tables in your data warehouse and data lake. The Query Editor V2 also provides several features for the collaboration of query authoring. You can view the earlier blog to learn more about how the Query Editor V2 simplifies data analysis.
These features let organizations accelerate self-service analytics and end-users deliver the insights faster.
Happy querying!
About the Authors
 Bhanu Pittampally is Analytics Specialist Solutions Architect based out of Dallas. He specializes in building analytical solutions. His background is in data warehouse – architecture, development and administration. He is in data and analytical field for over 13 years. His Linkedin profile is here.
 Debu Panda is a Principal Product Manager at AWS, is an industry leader in analytics, application platform, and database technologies, and has more than 25 years of experience in the IT world.
 Cansu Aksu is a Front End Engineer at AWS, has a several years of experience in developing user interfaces. She is detail oriented, eager to learn and passionate about delivering products and features that solve customer needs and problems
 Chengyang Wang is a Frontend Engineer in Redshift Console Team. He worked on a number of new features delivered by redshift in the past 2 years. He thrives to deliver high quality products and aim to improve customer experience from UI
 Anuradha Karlekar is a Solutions Architect at AWS working majorly for Partners and Startups. She has over 15 years of IT experience extensively in full stack development, deployment, building data ETL pipelines and visualizations. She is passionate about data analytics and text search. Outside work – She is a travel enthusiast!