AWS Big Data Blog
Build a Visualization and Monitoring Dashboard for IoT Data with Amazon Kinesis Analytics and Amazon QuickSight
April 2024: The solution presented in this post is deprecated.
Customers across the world are increasingly building innovative Internet of Things (IoT) workloads on AWS. With AWS, they can handle the constant stream of data coming from millions of new, internet-connected devices. This data can be a valuable source of information if it can be processed, analyzed, and visualized quickly in a scalable, cost-efficient manner. Engineers and developers can monitor performance and troubleshoot issues while sales and marketing can track usage patterns and statistics to base business decisions.
In this post, I demonstrate a sample solution to build a quick and easy monitoring and visualization dashboard for your IoT data using AWS serverless and managed services. There’s no need for purchasing any additional software or hardware. If you are already using AWS IoT, you can build this dashboard to tap into your existing device data. If you are new to AWS IoT, you can be up and running in minutes using sample data. Later, you can customize it to your needs, as your business grows to millions of devices and messages.
Architecture
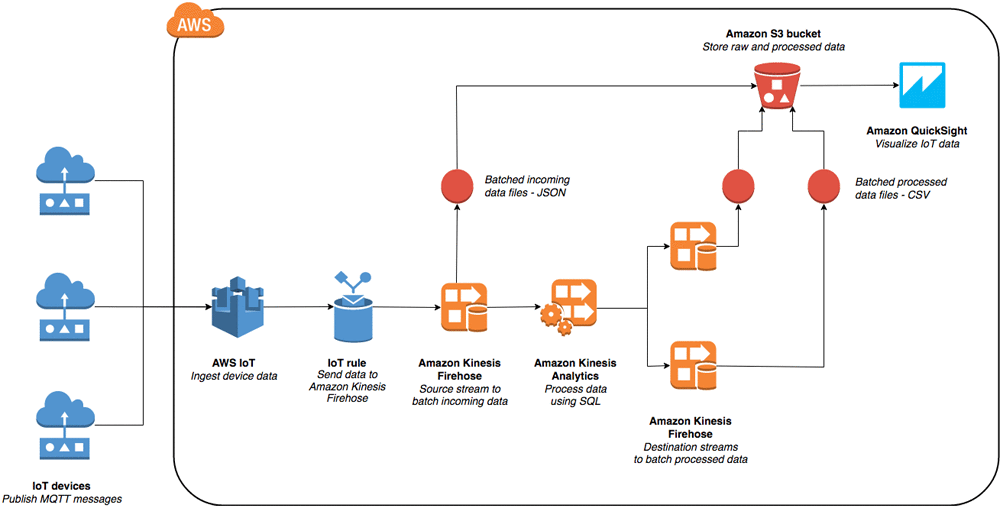
The following is a high-level architecture diagram showing the serverless setup to configure.

AWS service overview
AWS IoT is a managed cloud platform that lets connected devices interact easily and securely with cloud applications and other devices. AWS IoT can process and route billions of messages to AWS endpoints and to other devices reliably and securely.
Amazon Kinesis Firehose is the easiest way to capture, transform, and load streaming data continuously into AWS from thousands of data sources, such as IoT devices. It is a fully managed service that automatically scales to match the throughput of your data and requires no ongoing administration.
Amazon Kinesis Analytics allows you to process streaming data coming from IoT devices in real time with standard SQL, without having to learn new programming languages or processing frameworks, providing actionable insights promptly.
The processed data is fed into Amazon QuickSight, which is a fast, cloud-powered business analytics service that makes it easy to build visualizations, perform ad-hoc analysis, and quickly get business insights from the data.
The most popular way for Internet-connected devices to send data is using MQTT messages. The AWS IoT gateway receives these messages from registered IoT devices. The solution in this post uses device data from AWS Simple Beer Service (SBS), a series of internet-connected kegerators sending sensor outputs such as temperature, humidity, and sound levels in a JSON payload. You can use any existing IoT data source that you may have.
The AWS IoT rules engine allows selecting data from message payloads, processing it, and sending it to other services. You forward the data to a Firehose delivery stream to consolidate the continuous data stream into batches for further processing. The batched data is also stored temporarily in an Amazon S3 bucket for later retrieval and can be set for deletion after a specified time using S3 Lifecycle Management rules.
The incoming data from the Firehose delivery stream is fed into an Analytics application that provides an easy way to process the data in real time using standard SQL queries. Analytics allows writing standard SQL queries to extract specific components from the incoming data stream and perform real-time ETL on it. In this post, you use this feature to aggregate minimum and maximum temperature values from the sensors per minute. You load it in Amazon QuickSight to create a monitoring dashboard and check if the devices are over-heating or cooling down during use. You also extract every device’s location, parameters such as temperature, sound levels, humidity, and the time stamp in Analytics to use on the visualization dashboard.
The processed data from the two queries is fed into two Firehose delivery streams, both of which batch the data into CSV files every minute and store it in S3. The batching time interval is configurable between 1 and 15 minutes in 1-second intervals.
Finally, you use Amazon QuickSight to ingest the processed CSV files from S3 as a data source to build visualizations. Amazon QuickSight’s super-fast, parallel, in-memory, calculation engine (SPICE) parses the ingested data and allows you to create a variety of visualizations with different graph types. You can also use the Amazon QuickSight built-in Story feature to combine visualizations into business dashboards that can be shared in a secure manner.
Implementation
AWS IoT, Amazon Kinesis, and Amazon QuickSight are all fully managed services, which means you can complete the entire setup in just a few steps using the AWS Management Console. Don’t worry about setting up any underlying hardware or installing any additional software. So, get started.
Step 1. Set up your AWS IoT data source
Do you currently use AWS IoT? If you have an existing IoT thing set up and running on AWS IoT, you can skip to Step 2.
If you have an AWS IoT button or other IoT devices that can publish MQTT messages and would like to use that for the setup, follow the Getting Started with AWS IoT topic to connect your thing to AWS IoT. Continue to Step 2.
If you do not have an existing IoT device, you can generate simulated device data using a script on your local machine and have it publish to AWS IoT. The following script lets you set up your AWS IoT environment and publish simulated data that mimics device data from Simple Beer Service.
Generate sample Data
Running the sbs.py Python script generates fictitious AWS IoT messages from multiple SBS devices. The IoT rule sends the message to Firehose for further processing.
The script requires access to AWS CLI credentials and boto3 installation on the machine running the script. Download and run the following Python script:
https://github.com/awslabs/sbs-iot-data-generator/blob/master/sbs.py
The script generates random data that looks like the following:
Run the script and keep it running for the duration of the project to generate sufficient data.
Tip: If you encounter any issues running the script from your local machine, launch an EC2 instance and run the script there as a root user. Remember to assign an appropriate IAM role to your instance at the time of launch that allows it to access AWS IoT.
Step 2. Create three Firehose delivery streams
For this post, you require three Firehose delivery streams: one to batch raw data from AWS IoT, and two to batch output device data and aggregated data from Analytics.
- In the console, from the Services menu, choose Kinesis and Go to the Firehose console.
- Create all three Firehose delivery streams with all default settings except one change- under S3 buffer conditions section, change the Buffer interval to 60 seconds. Use the following field values for the three streams:.
Delivery stream 1:
| Name | IoT-Source-Stream |
| S3 bucket | <your unique name>-kinesis |
| S3 prefix | source/ |
Delivery stream 2:
| Name | IoT-Destination-Data-Stream |
| S3 bucket | <your unique name>-kinesis |
| S3 prefix | data/ |
Delivery stream 3:
| Name | IoT-Destination-Aggregate-Stream |
| S3 bucket | <your unique name>-kinesis |
| S3 prefix | aggregate/ |
If this is your first time using Kinesis Firehose, for the IAM role for each of the streams, let the console create a new firehose_delivery_role with a pre-defined policy. If you would like to use your own IAM role, you can expand the View Policy document under Role Summary to understand what permissions you need to include in your IAM role.
Step 3. Set up AWS IoT to receive and forward incoming data
- In the console, from the Services menu, choose AWS IoT.
- From the left sidebar, select Act and Create a rule.
- Create a new AWS IoT rule with the following field values.
| Name | IoT_to_Firehose |
| Attribute | * |
| Topic Filter | /sbs/devicedata/# |
| Condition | <none – leave blank> |
| Add Action | Send messages to an Amazon Kinesis Firehose stream (select IoT-Source-Stream from the Stream name dropdown) |
| Select Separator | “\n (newline)” |
If this is your first time using AWS IoT, for the IAM role, select Create a new role. The console will create an IAM role with the appropriate permissions for AWS IoT to access Firehose. If you prefer to use an existing role, select the role from the dropdown and click the Update role button. This will add the required permissions to your selected IAM role.
Step 4: Create an Analytics application to process data
- In the console, from the Services menu choose Kinesis and Go to the Analytics console.
- Create a new application.
- Enter a name of your choice, for example, SBS-IoT-Data.
- For the source, choose IoT-Source-Stream.
- Under the Access to chosen resources section, let the console create/update an IAM role to use with Kinesis Analytics if this is your first time working with Kinesis Analytics. If you have an appropriate IAM role already created that Kinesis Analytics can assume, choose that role from the dropdown.
Click the Discover Schema button and wait for the application to show results. If everything so far has been set up correctly, you will see a table with device parameters, device values, device ID and timestamp. Analytics auto-discovers the schema on the data by sampling records from the input stream. It also includes an in-built SQL editor that allows you to write standard SQL queries to transform incoming data. You can access this by clicking the Go to SQL editor button on the next screen after you select Save and continue.
Tip: If Analytics is unable to discover your incoming data, it may be missing the appropriate IAM permissions. In the IAM console, select the role that you assigned to your IoT rule in Step 3. Make sure that it has the ARN of the IoT-Source-Data Firehose stream listed in the firehose:putRecord section.
Here is a sample SQL query that generates two output streams:
- DESTINATION_SQL_BASIC_STREAM contains the device ID, device parameter, its value, and the time stamp from the incoming stream.
- DESTINATION_SQL_AGGREGATE_STREAM aggregates the maximum and minimum values of temperatures from the sensors over a one-minute period from the incoming data.
Real-time analytics shows the results of the SQL query. If everything is working correctly, you see three streams listed, similar to the following screenshot.

Step 5: Connect the Analytics application to output Firehose delivery streams
You create two destinations for the two delivery streams that you created in the previous step. A single Analytics application can have multiple destinations defined; however, this needs to be set up using the AWS CLI, not from the console. If you do not already have it, install the AWS CLI on your local machine and configure it with your credentials.
Tip: If you are running the IoT script from an EC2 instance, it comes pre-installed with the AWS CLI.
Create the first destination delivery stream
The AWS CLI command to create a new output Firehose delivery stream is as follows:
- For Name of Analytics Application, enter the value from Step 4, or from the Analytics console.
- For current-application-version-ID, run the following command:
- For ResourceARN, run the following command:
- For RoleARN, run the following command:
Now, paste the complete command in the AWS CLI and press Enter. If there are any errors, the response provides details. If everything goes well, a new destination delivery stream is created to send the first query (DESTINATION_SQL_BASIC_STREAM) to IoT-Destination-Data-Stream.
Create the second destination delivery stream
Following similar steps as above, create a second destination Firehose delivery stream with the following changes:
- For Name of Analytics Application, enter the same name as the first delivery stream.
- Change the ‘Name’ parameter to DESTINATION_SQL_AGGREGATE_STREAM
- For current-application-version-ID, increment by 1 from the previous value (unless you made other changes in between these steps). If unsure, run the same command as above to get it again.
- For ResourceARN, get the value by running the following CLI command:
- For RoleARN, enter the same value as the first stream.
Run the aws kinesisanalytics CLI command, similar to the previous step but with the new parameters substituted. This creates the second output Firehose destination delivery stream.
Update the IAM role for Analytics to allow writing to both output streams.
- In the console, choose IAM, Roles.
- Select the role that you created with Analytics in Step 4.
- Choose Policy, JSON, and Edit.
- Find “Sid”: “WriteOutputFirehose” in the JSON document, go to the “Resource” section and make sure that it includes Resource ARNs of both streams that you found in the previous step.
- If it has only one ARN, add the second ARN and choose Save.
This completes the Amazon Kinesis setup. The incoming IoT data is processed by Analytics and delivered, using two output delivery streams, to two separate folders in your S3 bucket.
Step 6: Set up Amazon QuickSight to analyze the data
To build the visualization dashboard, ingest the processed CSV files from the S3 bucket into Amazon QuickSight.
- In the console, from the Services menu, choose QuickSight.
- If this is your first time using Amazon QuickSight, you are asked to create a new account. Follow the prompts.
- When you are logged in to your account, choose New Analysis and enter a name of your choice.
- Choose New data set for the analysis or, if you have previously imported your data set, select one from the available data sets.
- You import two data sets: one with general device parameters information, and the other with aggregates of maximum and minimum temperatures for monitoring. For the first data set, choose S3 from the list of available data sources and enter a name, for example, IoT Device Data.
- The location of the S3 bucket and the objects to use are provided to Amazon QuickSight as a manifest file. Create a new manifest file following the supported formats for Amazon S3 manifest files.
- In the URIPrefixes section, provide your appropriate S3 bucket and folder location for the general device data. Hint: it should include <your unique name>-kinesis/data/.
Your manifest file should look similar to the following:
Amazon QuickSight imports and parses the data set, and provides available data fields that can be used for making graphs. The Edit/Preview data button allows you to format and transform the data, change data types, and filter or join your data. Make sure that the columns have the correct titles. If not, you can edit them and then save.
Tip: choose the downward arrow on the top right and unselect Files include headers to give each column appropriate headers. Choose Save. This takes you back to the data sets page.
Follow the same steps as above to import the second data set. This time, your manifest should include your aggregate data set folder on S3, which is named <your unique name>-kinesis/aggregate/. Update headers if necessary and choose Save & visualize.
Build an analysis
The visualization screen shows the data set that you last imported, which in this case is the aggregate data. To include the general device data as well, for Fields on the top left, choose Edit analysis data sets. Choose Add data set and select the other data set that you saved earlier.
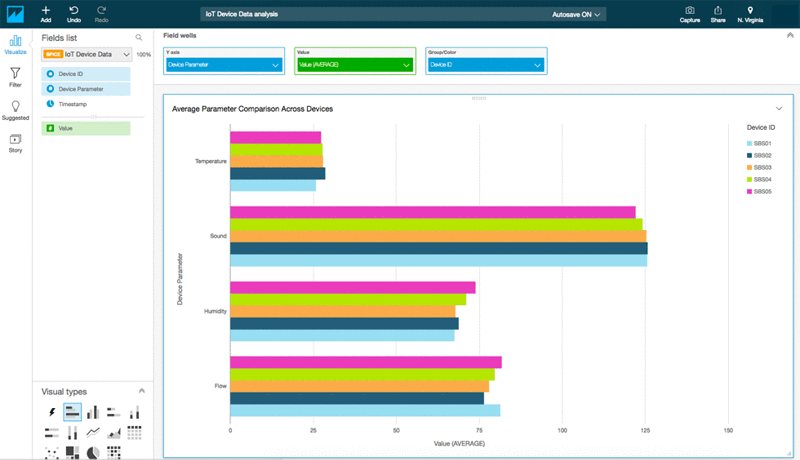
Now both data sets are available on the analysis screen. For Visual Types at bottom left, select the type of graph to make. For Fields, select the fields to visualize. For example, drag Device ID, Device Parameter, and Value to Field wells, as shown in the screenshot below, to generate a visualization of average parameter values compared across devices.
You can create another visual by choose +Add. This time, select a line graph to show monitoring of the maximum temperature values of the sensors in any minute, from the aggregate data set.


If you would like to create an interactive story to present to your team or organization, you can choose the Story option on the left panel. Create a dashboard with multiple visualizations, to save and share securely with the intended audience. An example of a story is shown below.

Conclusion
Any data is valuable only when it can be actually put to use. In this post, you’ve seen how it’s possible to quickly build a simple Analytics application to ingest, process, and visualize IoT data in near real time entirely using AWS managed services. This solution is scalable and reliable, and costs a fraction of other business intelligence solutions. It is easy enough that anyone with an AWS account can build and use it without any special training.
If you have any questions or suggestions, please comment below.
About the Author
 Karan Desai is a Solutions Architect with Amazon Web Services. He works with startups and small businesses in the US, helping them adopt cloud technology to build scalable and secure solutions using AWS. In his spare time, he likes to build personal IoT projects, travel to offbeat places and write about it.
Related
Visualize Big Data with Amazon QuickSight, Presto, and Apache Spark on Amazon EMR

Audit History
Last reviewed and updated in April 2024 by Felix John| Associate Solutions Architect