AWS Big Data Blog
Manage centralized Microsoft Exchange Server logs using Amazon Kinesis Agent for Windows
September 8, 2021: Amazon Elasticsearch Service has been renamed to Amazon OpenSearch Service. See details.
Microsoft Exchange servers store different types of logs. These log types include message tracking, Exchange Web Services (EWS), Internet Information Services (IIS), and application/system event logs. With Exchange servers deployed on a global scale, logs are often scattered in multiple directories that are local to these servers. This requires Exchange administrators to log into each server to monitor status, health, and events. Centralizing these logs and converting them into useful metrics allows Exchange administrators to identify a majority of issues, like high load or service/application errors without logging into each server.
This blog post discusses an efficient architecture to stream, analyze, and store Microsoft Exchange Server logs. For frequent queries and operational analytics, we use Amazon OpenSearch Service and Kibana for real-time visualization. For example, you can provide various types of reports. These reports can be top email senders and recipients, top HTTP status codes in IIS logs, top error codes in EWS logs, and narrow down spikes in load/errors. For infrequent queries such as audit, legal and compliance requirements, we use Amazon S3 as the final destination. It provides low-cost storage options and high durability and Amazon Athena for simple queries using standard SQL.
Amazon Kinesis Agent for Microsoft Windows (Kinesis Agent for Windows) is a highly configurable and extensible agent. Kinesis Agent for Windows gathers, parses, transforms, and streams logs, events, and metrics to various AWS services, including Amazon Kinesis Data Streams, Amazon Kinesis Data Firehose, and Amazon CloudWatch. It helps to make it more efficient and reliable to centralize logs from Windows-based services. This lets you see the extent of an issue, monitor those issues, and generate an alarm when errors or loads breach certain thresholds. For more information about Kinesis Agent for Windows, see What is Amazon Kinesis Agent for Microsoft Windows?
Parsing logs
Amazon OpenSearch Service requires JSON-formatted data. Kinesis Agent for Windows efficiently parses the Exchange logs lines in CSV format and converts them to JSON. You can enrich the data by using Kinesis Agent for Windows by adding details, such as the hostname, EC2 instance ID, and custom date and time formats to help pinpoint the exact issue reported in the logs. Kinesis Agent for Windows dynamically computes the log header. It does this even if the header names are changed, or if there are multiple header lines in a single log file because of a service restart. It streams the right data even when logs are rotated.
The log flow
In this use case, we send the same log to both Amazon OpenSearch Service for real-time analytics and to Amazon S3 for offline analytics with Amazon Athena. Instead of streaming the data twice from the host to each destination, you can configure Kinesis Agent for Windows to stream it once to a Kinesis data stream. From the stream, Amazon Kinesis Data Firehose gathers logs and delivers them to Amazon OpenSearch Service. Another Kinesis Data Firehose gathers the same logs and delivers them to an Amazon S3 bucket for Amazon Athena. If there is a need to send logs to another destination, we can use another Kinesis Data Firehose instance.
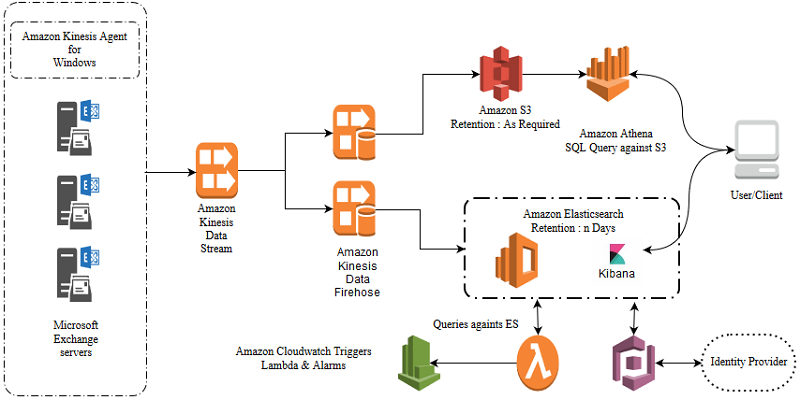
AWS Lambda periodically analyzes the logs in Amazon OpenSearch Service and post statistics to CloudWatch metrics. CloudWatch alarms are used to trigger on the anomalies detected in the posted metrics.
Kibana visualizes the log data. By looking at spikes and anomalies in the graphs, we can drill down into specific log data. That helps us diagnose specific problems with the Exchange service. Several authentication features protect access to Kibana. For information about using Amazon Cognito with an identity provider, see Amazon Cognito Authentication for Kibana.
Agent configuration
Kinesis Agent for Windows configurations are described in the appsettings.json located at %PROGRAMFILES%\Amazon\AWSKinesisTap\ path. It is here where we define the sources (log location), sinks (Kinesis Data Stream information), and pipes, which connect the source and sinks.
The following is an example source configuration that queries all files with a .log extension under the specified directory. When ExchangeLogSource is set as the type, it dynamically parses the log lines for the header. It then automatically picks up the column that is needed for ‘Time Stamp’.
Message tracking logs are similar to the following sample.
2018-10-22T10:53:13.404Z, 10.00.00.00, ExchangeServer01,10.00.00.00,ExchangeServer01,;250 2.0.0 OK;ClientSubmitTime:2018-10-22T10:53:10.680Z,Intra-Organization SMTP Send Connector,SMTP,SEND,157882997807893,<6d606502441648f993b7b6d1b8fbb5fb@ExchangeServer01>,9b3f4489-a158-4126-0d41-08d6380c8f0f,recipient@Somedomain.com,250 2.1.5 Recipient OK,sender@Somedomain.com, return-path@Somedomain.com,…
// Sinks (Destinations) define where the logs go
Next, we define the sinks or destination where the logs go. We can also stream logs to a Kinesis Data Stream in another AWS account by assuming the role that has access to the stream. For information about how to set up access, see Sink Security Configuration. Logs are converted to JSON when the Format is specified.
// Pipes, connects sources and sinks.
Pipes connect the source and destination. This is helpful when there is a need to take multiple sources to a destination, or vice versa.
Kinesis Agent for Windows converts each log line into a JSON blob, before sending the log to Kinesis Data Streams. This is shown in the following sample.
Operational analytics with visualization
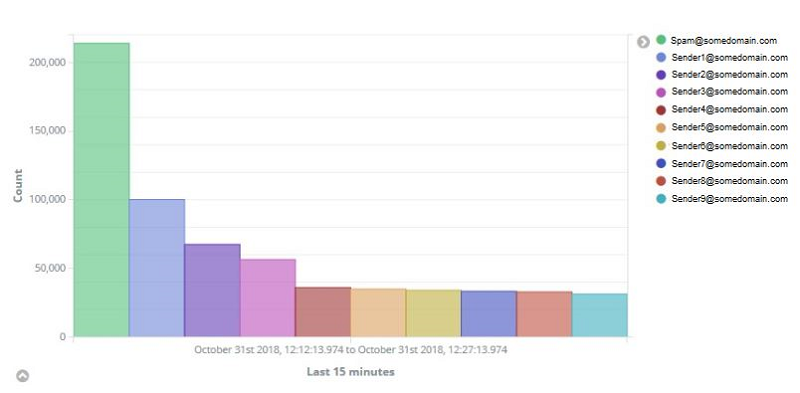
When working on an outage or a critical issue, immediate availability of logs is helpful. Here is an example. There is a SPAM outbreak, and we must know the top senders and top recipients. Having those results when the issue is happening helps Exchange administrators to mitigate that risk, by writing a rule to drop those SPAM messages.
For example, the following Kibana graph visualizes data from Amazon OpenSearch Service. It represents top email senders within a time window. The graph shows a top sender, spam@somedomain.com, which should be investigated further. By using an Amazon OpenSearch Service API call, you can retrieve the aggregated results and take action programmatically. Placing alerts on this data helps with early detection and help with mitigations actions to prevent more spam from coming through.
The following is a line graph in Amazon CloudWatch showing statistics posted by AWS Lambda querying logs from Amazon OpenSearch Service.
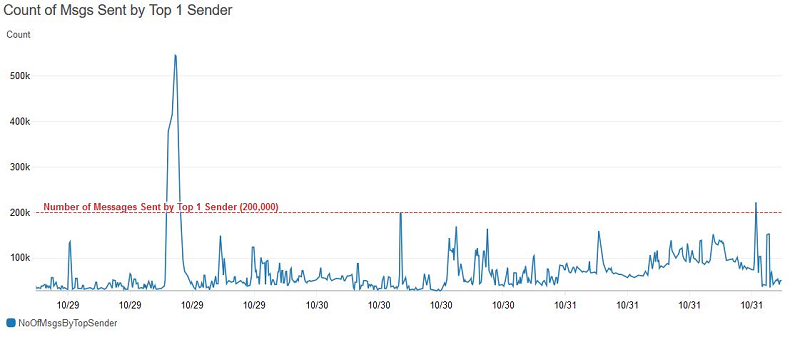
Thresholds and alarms can then be configured to alert in CloudWatch alarms.
Here is an AWS Lambda code example in Python for querying an Amazon OpenSearch Service endpoint. It returns the top five senders from Microsoft Exchange message tracking logs for the last 15 minutes. It then posts the count of messages sent by the top-most sender to CloudWatch metrics.
Summary
Amazon Kinesis Agent for Microsoft Windows parses, converts the log lines to JSON, and streams the data to Amazon Kinesis Data Streams. In the use case in this blog post, we streamed several hundred Microsoft Exchange Server logs into Amazon Kinesis Data Streams in less than a minute. With native integration to AWS services, Kinesis Agent for Windows is effective in getting the logs to centralized AWS storage and AWS analytics services. Let us know your use cases and happy logging!
Additional resources
- Kinesis Agent for Windows User Guide
- Kinesis Agent for Windows download
- Kinesis Agent for Windows source code
- Blog: Collect, parse, transform, and stream Windows events, logs, and metrics using Amazon Kinesis Agent for Microsoft Windows
- Blog: Persist Streaming Data to Amazon S3 using Amazon Kinesis Firehose and AWS Lambda
About the Author
 Vijay Amirtharaj is a Systems and Development Engineer in Amazon Web Services. Vijay is passionate in developing well architected email solutions. He enjoys reading about new technologies and loves spending time with family and friends.