AWS for Industries
How Machine Learning on AWS can help customers predict the risk of Automotive Part Recalls
This blog focuses on a potential method to use Long Short Term Memory (LSTM) machine learning models to help customers predict parts that are likely to become defects or recalls. Specifically, we show how predictions generated from an LSTM may provide customers with early indicators that generally out-perform existing manual processes and can help assist our customer’s analysts and engineers to implement mitigations faster with the aim of reducing defective inventory, product repair, and other associated costs. Although we focus on automotive, this method could also be applicable to other industries with similar recall use cases.
How This Looks Today
In 2021, automakers spent $45.9 billion on warranty claims. A recall is the most severe type of warranty claim that is issued when a manufacturer or the National Highway Traffic Safety Administration (NHTSA) determines that “a vehicle defect creates an unreasonable safety risk or fails to meet minimum safety standards.” In the case of a recall, an automaker must replace the defect at no cost to the consumer, and for this reason they set aside large sums of money to cover these costs. The goal of this post is to explain how automakers and suppliers can potentially use machine learning to help them predict recalls (and major defects) and implement mitigations faster with the aim of reducing the financial impact of these recalls or defects. We explain how to back test the machine learning model to demonstrate how the timing of predictions from the machine learning model compares to the timing of existing quality control processes to quantify how much business value can be realized by using outputs from the machine learning model instead of existing processes.
When a recall is issued or a major defect emerges, automakers and suppliers’ work quickly to identify the root cause. They use heuristics and statistics to analyze patterns, determine the core issue, and then implement the fix at the manufacturing, engineering, or design level. These methods are largely manual and time consuming. With machine learning, a customer can learn from historical patterns leading up to a major product defect or recall, and use a model to predict parts that are more likely to become major product defects or recalls before they happen. Although the advanced risk warning can range from days to months, it’s worth noting that even one week of additional advanced notice can potentially help our customer make significant savings in terms of reduction in faulty inventory and repair costs. This is because automakers and suppliers must produce parts at very high volume in order to meet worldwide demand.
Before we discuss the specific machine learning model, let’s take a look at how parts are made. Every automaker has its own version of this process, but an example of the general flow is shown in Figure 1. Individual components (e.g. airbags, seatbelts, tires, transmissions) are produced by one or more suppliers, they are assembled into systems, integrated into a complete vehicle, and then delivered to the consumer. Most modern vehicles have over 30,000 individual components that are produced by suppliers across the globe.
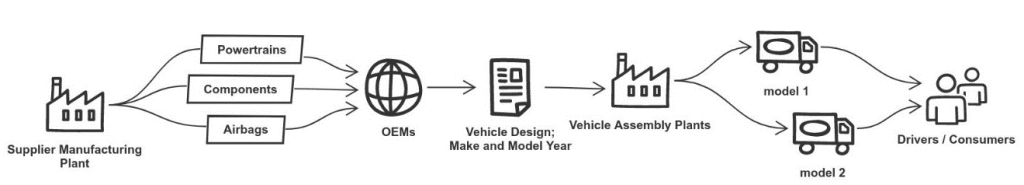
Figure 1: Overarching Part Flow
Typically, when a consumer buys a car, it comes with a warranty for defect repairs for a set period of time, usually within 3 years or 36,000 miles from the date of purchase. If one of these 30,000 components breaks during the warranty period, the owner brings the vehicle into a dealership for repair at no cost to the owner. At the dealership, a technician reviews the problem, diagnoses the root cause, fixes the issue, and then records the findings in a warranty claim document. In addition to a basic root cause analysis, this document includes relevant details about the vehicle, such as its make, model year, manufacturing plant, cost of repair, and labor required. It also includes a text description of the problem.
After the repair is complete, the dealership submits the claim to the automaker for repayment where it is reviewed, adjudicated, and stored in a database for historical purposes. In many cases, agreements made between automakers and suppliers mean that the cost of warranty repairs on defective parts is shared between both parties. Today, automakers have amassed millions of historical warranty claims dating back to the early 2000s.
When claims arrive at the automaker and/or supplier, a team of warranty analysts manually review them. They use statistical approaches, visualizations, and other methodologies to validate claims and identify trends. All of these methods are complicated by noise in the data and other data quality issues. One of the key goals of this manual review process is to identify emerging part defects that could be a result of a supplier manufacturing or engineering issue.
Although most warranty claims are a result of acceptable manufacturing variability rather than a persistent manufacturing defect, some trends do emerge where claims are submitted for the same part and, after a certain threshold is reached, an influx of claims for a particular part triggers specific actions by the automaker and supplier to conduct deeper dives. Eventually, after enough manual investigation, the root cause is identified through collaboration between analysts and engineers across both the automaker and supplier. Then, changes are implemented in the manufacturing process with the aim of preventing further warranty claims.

Figure 2: Existing Warranty Claim Analysis Process
How We Imagine It
We propose that automakers and suppliers consider supplementing their existing warranty claim process with machine learning. As shown in Figure 3, the machine learning model ingests aggregated and anonymized data from the historical warranty claims database, learns patterns leading up to major product defects and recalls, and raises potential alerts for parts that are predicted by the model to be at risk of becoming an emerging issue. A machine learning model can help provide customers with a forward-looking indicator that allows them to increase focus on the most important emerging part issues.

Figure 3: Proposed Warranty Claim Analysis Process
The remainder of this blog post focuses on the machine learning methods that enable this process, communication methods and organizational design to complement the technical solution.
Using Warranty Claim Data as the Starting Point
Although there are many sources of relevant data, such as Diagnostic Trouble Codes (DTCs), we propose the customer consider using raw warranty claims data directly from structured warranty claim databases maintained by automakers and suppliers. Although warranty claim databases vary greatly between automakers, they contain millions of individual observations and the data structure has remained constant for many years.
There are three types of information in the warranty claims database: part, vehicle, and text description. Part information includes details about the type of part that was defective, the cost to replace it, the part version number, and other metadata elements related to the defective part. Vehicle information includes information about when and where the vehicle was manufactured and how many miles it had been driven at the time of failure. Finally, the text descriptions information includes written descriptions about the fix from the technician and where the fix was performed.
To achieve the analytical objective of predicting major defects and recalls, we need to make sure that a few key concepts are represented in the data. First, the data must capture the “sequential” nature of a major project defect. Second, the data must include a reliable target to classify sequences as normal or defective. And third, we need independent variables or features that have a correlation with the target variable. We talk about each of these key requirements in the next section.
Preparing Warranty Data for Machine Learning
Let’s start with how the customer could capture the “sequential” nature of a major product defect or recall. Intuitively, the customer needs the data to reflect the historical context of the part leading up to a major product defect or recall. For that reason, customers can’t look at the warranty claims individually. Instead, we aggregate them by part number and part version. This allows us to build a temporal based series of events related to a part and, where data is available, versions of that part through its lifecycle. Although we lose some fidelity with this aggregation, we gain the desired temporal sequence of events.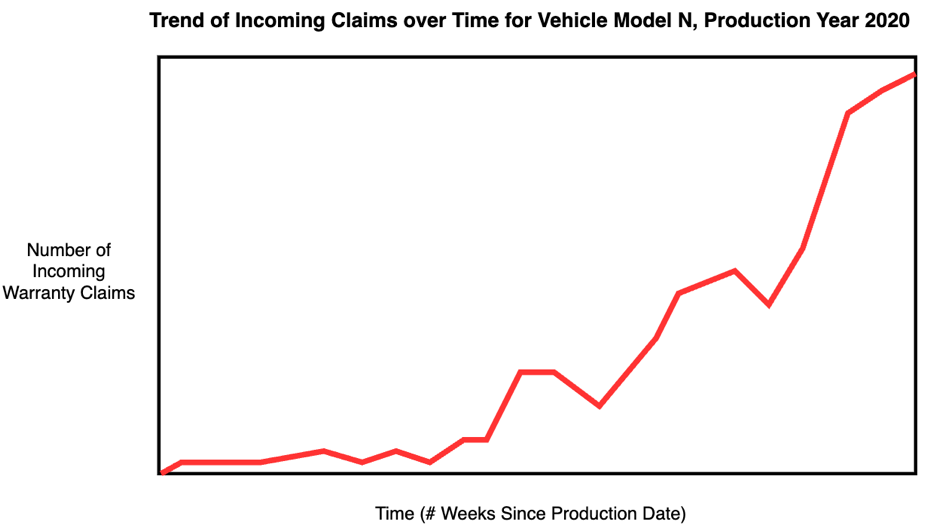
Figure 4: Weekly Claim Aggregation
To help ensure that all data elements in the training set are aggregated the same way, customers can aggregate the independent variables by part number and part version as well. Customers may leverage the average of the labor cost, part cost, and mileage by part number and part version, and sum the number of claims to get the total claim volume each week. Now, we have part-indexed time series signals that can be used to train the machine learning model.
Next, we extract labels from the raw data. Although in some cases, customers have a pre-populated column of product defect or warrant codes, it may be necessary to extract them from the text descriptions. For the latter case, customers can use simple search techniques to extract the labels and tag the sequences accordingly. Alternatively, many automakers store this information in separate databases, which can be integrated into the training set if sufficient integration points like VIN and part number exist.
Finally, before training the model, customers apply cleaning and normalization teqniques to the test set. Customers remove obviously erroneous data (eg vehicle mileage greater 3 million miles) and remove data from periods of time where there were issues with data collection mechanisms. We also convert the data into multi-dimensional arrays. By default, customers look at the first 52 weeks of warranty claim data per part by slicing the data when more than 52 weeks are present and pre-padding sequences with less. Additionally, because parts that experience major product defects and recalls are a much rarer occurrence, techniques are applied to address this class imbalance before model training including synthetic oversampling of the rarer class and strategic removal of examples in the abundant class.
Excluding Features that are Not Correlated with Defects and Recalls
Before training the model, customers need to exclude some features from the training data. Overall, the goal of this activity is to strike a balance between noise and signal in the data while only using information that generalizes over time. Often, many discussions between data scientists and subject matter experts are necessary in order to arrive at the right set of features that are both correlated with major product defects and recalls and make sense practically in the real world.
To illustrate this point, let’s look at vehicle color. Vehicle color is an example of data that is available but must be excluded from the training set. This is because vehicle color, barring some strange phenomenon, is not well correlated with a major product defect or recall. Conversely, vehicle mileage is a much better indicator. Low mileage vehicles typically have fewer issues than higher mileage vehicles, so if the average mileage for a given part and part version is low, there is a better chance that there is a more serious issue. In general, customers always want our features to be rooted in conceptual theory, validated by warranty domain experts, and as evidenced in well-separated distributions between classes during the exploratory data analysis stage. Conceptually, features like diagnostic labor hours, part cost, vehicle mileage, and claim volume over time are more correlated with major product defects or recalls.
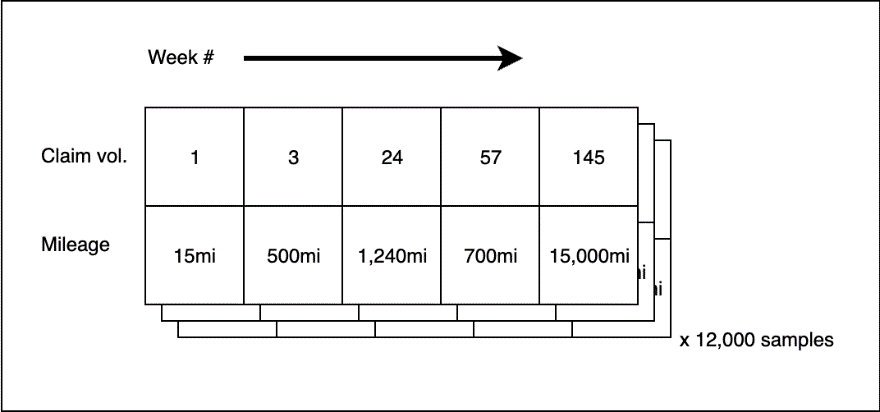
Figure 5: Training Data Structure
Choosing the Long Short Term Memory Machine (LSTM) Learning Model
For this problem, there are many viable algorithms. Random alerting, HITL rules-based, single perception, XGBoost, and other classical ML methods are all viable options. Although viable, we recommend that customers seeking to address this issue consider using a Long Short-Term Memory (LSTM). LSTMs are designed to work well on complex temporal sequences and are popular for similar use cases like classifying machine failures from sensor logs and in language translation tasks with variable length input sentences. It is our initial recommendation that customers look to the LSTM approach to start their deeper analytics journey. More detail about LSTM here.
Importantly, at inference time, the LSTM provides both the class prediction (eg normal or defective) as well as the probability that the prediction belongs to that class. This probability should be utilized heavily in conversations with stakeholders to characterize the confidence in the prediction. It is left up to the customer’s data science team to decide the appropriate probability thresholds where actions should and should not be taken. For example, thresholds on number of incidents, or claims in a period or costs associated with repairs, need to be business based calls each customer must set in order to define their escalation and taking action parameters.
Evaluating the Performance of the LSTM in Practical Terms
In order to evaluate the performance of the model, we start with quantitative back-testing. We recommend that customer consider using at least 5 years of historical warranty claims data with hold-out sets that the model has never seen before to help demonstrate how the model would have performed historically. In the hold out set, we slice the data into week-long increments and we take the difference between the earliest date that our model raised alert and the earliest date that the analyst team had become aware of the part issue through traditional warranty heuristic methods.
How Customer Can Build this Solution on AWS
Finally, let’s talk about how customers implement this on AWS. The six major components of this solution are shown in Figure 6.

Figure 6: Reference Architecture
Let’s walk through each of the six major components. More details here.
- Extract Transform Load (ETL) Pipeline. Periodic ingest of automotive warranty claims from automotive portals through scripts running on Amazon EC2 followed by a scalable extract-transform-load pipeline implemented in AWS Glue.
- Data Warehouse. Centralized data warehouse inside Amazon Redshift that includes enriched data as well as tables for specific analytical dashboards capable of scaling to an entire enterprise or organizational unit
- Data Science. Amazon SageMaker Studio provides data scientists and analysts with a comprehensive tool chain for data exploration, model training, and MLOPS pipelines.
- Consumption. The broader community of Customer analysts and users obtain specific actionable recommendations through dashboards deployed on Amazon QuickSight
- Operations. The periodic ingestion and machine learning pipelines are triggered from Amazon EventBridge, application code is stored in AWS CodeCommit, and Amazon CloudWatch is utilized for logging and monitoring
- Users. Customer’s data scientists and business users iteratively develop and review analysis developed in Amazon SageMaker Studio and Amazon QuickSight dashboards
This AWS solution is designed to make it easier for customers to build and operate a solution to help them reduce the costs associated with major product defects and recalls. The ETL pipeline provides a lightweight mechanism to repeatedly ingest warranty data and prepare if for machine learning. The SageMaker Studio environment provides a centralized location where the customer’s data scientists and analysts can collaboratively train LSTM models, deploy them into production, monitor the weekly inferences, and also develop ad-hoc reports and other analysis to support communications. And finally, Amazon Redshift provides a scalable Online Analytical Processing (OLAP) database for user facing dashboards and reports.
Conclusion
With the right team and the right charter, the solution described in this blog is one way that automakers and suppliers can develop their own solutions to help mitigate costs associated with major product defects and recalls. Specifically, automakers and suppliers can potentially reduce labor and repair costs, reduce faulty inventory, and control associated brand and reputation damage by leveraging predictions from this solution to help them take more proactive measures faster than existing processes. If you or your team would like to discuss the business case, recommended implementation path, or technical solution in more detail, contact us here.