AWS for M&E Blog
Creating dashboards and alarms for AWS Elemental MediaConvert using Amazon CloudWatch
Introduction
If you are developing an automated video-on-demand workflow, you may at times need to monitor specific parts of the workflow pipeline. When it comes to the transcoding piece of the workflow, AWS Elemental MediaConvert is integrated with Amazon CloudWatch to provide metrics and events from the MediaConvert service.
You can create simple CloudWatch dashboards to track things like total transcoding jobs completed or errored for a given job queue. You can also use metrics such as StandbyTime to create alarms to detect if there is a large backlog for a given job queue.
This post provides an overview of how to build some of these dashboards and set up CloudWatch alarms for MediaConvert.
Creating dashboards
CloudWatch dashboards are pages you can create to house metrics and alarms across your MediaConvert workflow. This gives you an overall view of the health of your video transcoding solution.
To create a dashboard, do the following:
Step 1: Log into your AWS Account and go to the CloudWatch console.
Step 2: On the left hand navigation bar, click on Dashboards.
Step 3: Click the blue Create Dashboard button.
Step 4: Provide a Dashboard name and click Create Dashboard.
Step 5: When the Add to this dashboard prompt appears, click Number, then click Next.
Creating a widget
Widgets are objects used to present data in some visual form. There are several kinds of widgets you can create to aggregate data. This example uses line and pie graphs as well as numbers in our dashboard.
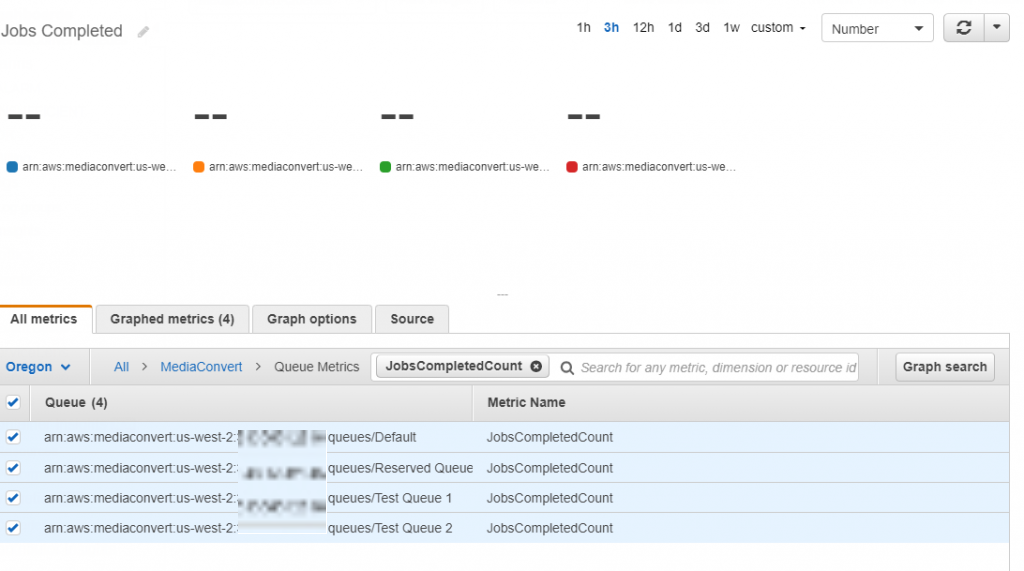
Depending on how many services you have active in your account, you may see more metrics listed under ‘All metrics’. Widgets can contain metrics from all regions in which a service is launched. This can be helpful if you use MediaConvert in multiple regions and would like a global view of your job health. You can change the region you are viewing and select metrics for it by clicking the region dropdown menu located under ‘All metrics’
In this example, I only track metrics in the Oregon (us-west-2) region.

Continuing from the previous section:
Step 1: Give the name by changing Untitled graph to something like ‘Jobs Completed.’
Step 2: Add Queue metrics to your widget by choosing MediaConvert, then Queue Metrics, and selecting all the queues that have the Queue Metric name ‘JobsCompletedCount.’
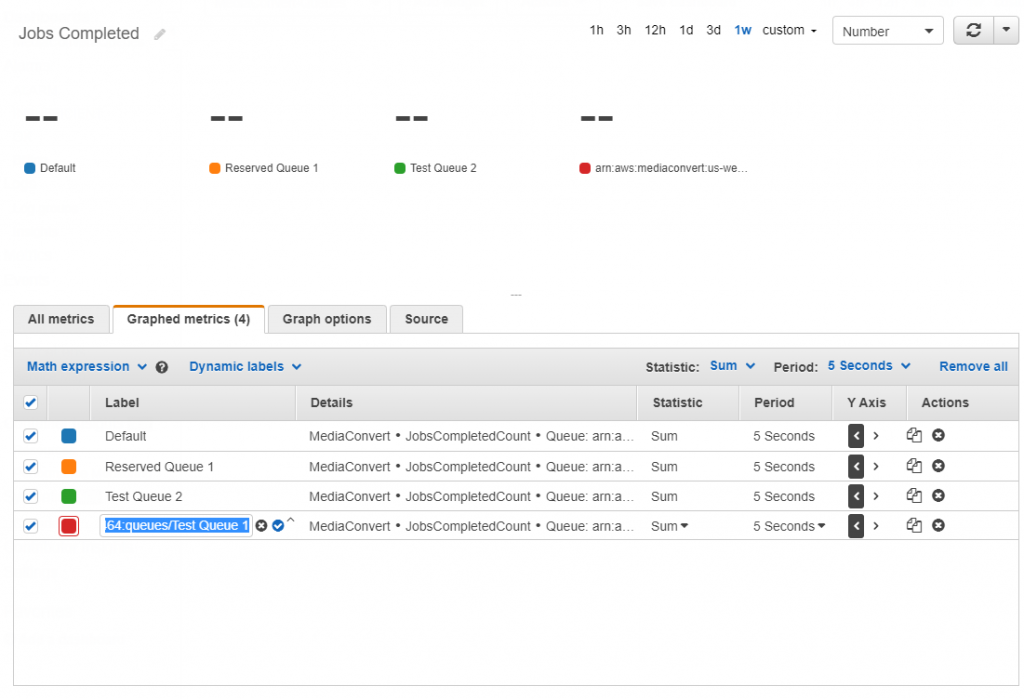
Step 3: Click the Graphed metrics tab, and change the dropdown options for Statistics to Sum and Period to 5 seconds.
Note: Because MediaConvert outputs can have varying transcode times from job to job, setting a lower Period allows us to see jobs that may have completed in a lower transcoding time.
Step 4: Change the labels from the Queue ARN, to the readable text name for the Queue by hovering the mouse over the metric Label and clicking the pencil icon.
 Step 5: Click the Graph options tab, and under the Value section, select Time range value. This allows you to use the time date picker in CloudWatch, and display metrics during those times.
Using math expressions in metrics
CloudWatch can apply statistic functions to metrics available from MediaConvert. This can be useful if you are trying to determine the percentage of job failures during a given time range, or if you are simply collapsing a total count of all metrics into one.
Step 1: Click on the Math expressions dropdown.
Step 2: Find the function you want to expose on your dashboard. In this example, select Sum.
Step 3: Add in the metric ids you are using functions against. To gather the sum of all metrics, use SUM([m1,m2,m3,m4]) in the details. You can check out the CloudWatch documentation on metric math works in the service.
Step 4: Give it a unique Label.

Once you have your widget data graphed to your liking, click the Create widget button.
Once the widget is saved, you will go back to the Dashboards page. You can repeat the steps above in order to create more widgets.
Pro Tip: To save time, use the Duplicate button to copy the widget you would like to use against other metrics.

Once all your widgets are set up, you can use the time picker on your dashboard to select time ranges to view metrics data.

Alarms
Alarms are useful in maintaining the real-time health of your solution. For example, you may have an AWS Lambda script looping invocations that is creating many jobs in error, clogging up the transcoding resources in your queue. Alarms can be set up to alert you to this type of situation. The StandbyTime metric can be used to measure the seconds before a job starts transcoding. If there is a large delta in this metric, there are normally jobs waiting in a queue with the SUBMITTED job status.
Creating an alarm
Step 1: Log into your AWS Account and go to the CloudWatch console.
Step 2: On the left hand navigation bar, click on Alarms.
Step 3: Click the Create alarm button.
Step 4: Under Metric, click the Select Metric button.
Step 5: In the Search for any metric, dimension, or resource id field, type StandbyTime.
Step 6: Select the queue you want to create an alarm for and click Next.

Step 7: Under the Metric section, do not change any of the options.
Step 8: Under the Conditions section, set Threshold type to Static, Whenever StandbyTime is… to Greater and fill in the than… text field with 300. This will alarm if a job takes over 5 minutes to go from a SUBMITTED to PROGRESSING status. Click Next.
Note: It’s advised when you are setting up your alarms that you look at the average standby time of your queues. Setting the threshold too low may cause false positives in your alerting.

Step 9: Under Notification, set the Alarm trigger to ‘In alarm.’
Step 10: Alarms can trigger Amazon Simple Notification Service (Amazon SNS) notifications that can alert you via email, SMS, or any of the supported topic protocols. You must set up an Amazon SNS topic, or use an existing one. Check out the Amazon Simple Notification documentation on creating SNS topics from scratch. Once an Amazon SNS topic is created. Click Next.

Step 11: Give the alarm a name and click Next.
Step 12: You will need see all configurations to review for your new alarm. Click Create alarm.
Adding to your dashboard
To add your alarms to your dashboard, perform the following steps:
Step 1: Go to your dashboard in CloudWatch.
Step 2: Click Add widget.
Step 3: Select Alarm status and click Next.
Step 4: Select all the alarms you would like to include, and click Create widget.
Step 5: Give the widget a title and click the Add to dashboard button.

CloudWatch widget templates
For the widgets used in this post, check out the AWS Elemental MediaConvert Tools GitHub page for templates to modify for your own dashboards.