AWS for M&E Blog
Monitoring Amazon Interactive Video Service with a CloudWatch Dashboard
Introduction
Amazon Interactive Video Service (Amazon IVS) is a managed live streaming solution that is quick and easy to set up, and ideal for creating interactive video experiences. You can send your live streams to Amazon IVS using streaming software and the service does everything you need to make low-latency live video available to any viewer around the world, letting you focus on building interactive experiences alongside the live video.
Once you build your live streaming experience, you may want to monitor usage, changes in stream state, and breaches of limits of your live streams. To enable this, Amazon IVS provides metrics via Amazon CloudWatch and events via Amazon EventBridge.
In this blog post, we show you how to create a CloudWatch dashboard that monitors the performance of your Amazon IVS live streams using these metrics and events. We also explore creating alarms to detect if your streams experience a failure or otherwise move outside of normal performance expectations.
Deploying the dashboard
To deploy the CloudWatch dashboard described in this article to your own account, click on the Region specific ‘Launch stack’ link from the following table:
| Region | CloudFormation Template |
| EU (Ireland) | |
| US East (N. Virginia) | |
| US West (Oregon) |
The source code to the template, along with additional technical documentation, is available in the GitHub repository:
Once deployed, the CloudFormation template publishes custom CloudWatch Metrics from events provided by Amazon IVS to Amazon EventBridge, and combines these with service-published metrics in a pre-configured CloudWatch dashboard. You can navigate to the dashboard two ways: 1) follow the link under the “Outputs” tab for the CloudFormation Stack you just deployed; 2) open the CloudWatch Management Console, select “Dashboards” from the menu on the left and click on the dashboard name prefixed with the CloudFormation Stack name you just deployed.
A tour of the dashboard
The Amazon IVS CloudWatch dashboard is organized into sections, each helping you answer a different question about the performance of your live streams. All metrics shown on the dashboard reflect the cumulative (global) state of all channels operating in your account in the Region the dashboard is deployed to.
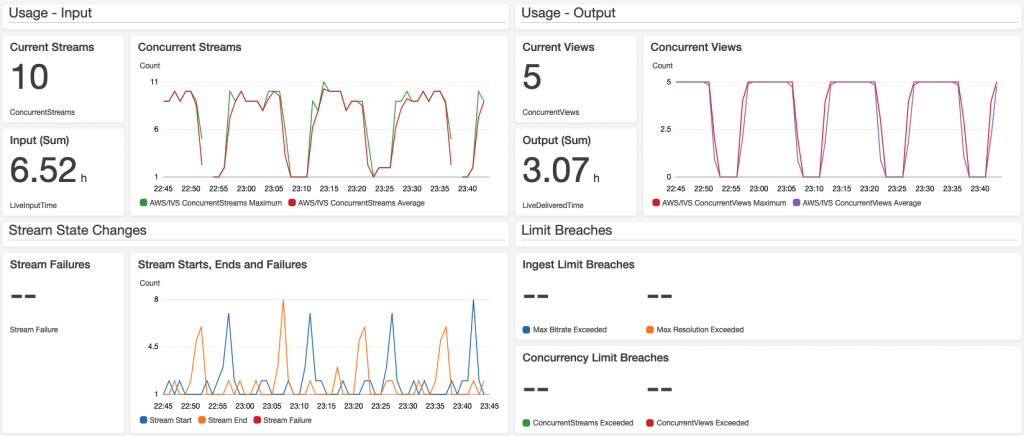
CloudWatch dashboard with 4 sections
Usage – Input
The Usage – Input section of the dashboard monitors how much you, or content creators using your service, are streaming to Amazon IVS.
- Current Streams provides a count of live channels currently streaming video to Amazon IVS.
- Video Input provides the total duration of video streamed to Amazon IVS over the period selected.
- Concurrent Streams graph shows how the number of channels streaming changes over time.
Example use-cases for this section include:
- real-time monitoring of the number of channels streaming
- identifying patterns in when your users stream
- determining how many channels are concurrently streaming at peak
- calculating how much video your users streamed during a given period
Usage – Output
The Usage – Output section of the dashboard monitors how your viewers are consuming content from your live streams.
- Current Views provides a count of active views across all of your streams.
- Video Output provides the total duration of video delivered to your viewers.
- Concurrent Views graph shows how the number of views changes over time.
Example use-cases for this section include:
- real-time monitoring of viewership for your live streams
- identifying patterns in when your audience is most engaged with your live streams
- calculating how much video your audience consumed during a given period
Stream State Changes
The Stream State Changes section of the dashboard monitors the number and frequency of Amazon IVS streams that start or stop streaming, in addition to how many experience a failure.
Example use-cases for this section include:
- monitoring patterns to validate normal behavior
- identifying unexpected events such as a large number of streams ending simultaneously
Limit Breaches
The Limit Breaches section of the dashboard monitors if your account is exceeding Amazon IVS limits defined in Service Quotas. To review the limits for your account, open the Service Quotas Management Console and navigate to Amazon Interactive Video Service under the AWS Services link on the left.
Example use-cases for these metrics include:
- monitoring limit breaches to ensure your streamers’ and viewers’ experience are not impacted by service limits. If you find you are approaching or exceeding service limits for Concurrent Viewers or Broadcasters (active streams), you can request an increase to these limits using the Service Quotas console.
Dashboard architecture and costs
This CloudWatch dashboard combines custom CloudWatch Metrics from events provided by Amazon IVS to Amazon EventBridge with service-published CloudWatch Metrics.
The CloudFormation template creates Amazon EventBridge Rules to capture events emitted by Amazon IVS. These events correspond to changes occurring in Amazon IVS such as streams starting, streams stopping, and service limits being exceeded. Each event is processed via Amazon API Gateway and custom CloudWatch Metrics corresponding to each event are created in your AWS Account. The CloudWatch dashboard visualizes these customer metrics.
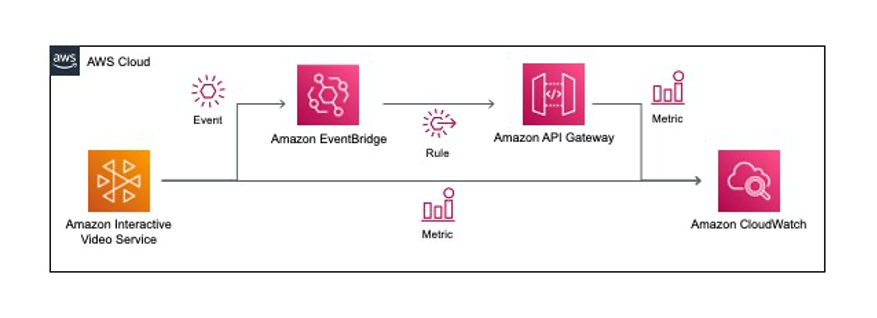
Architecture diagram of CloudWatch dashboard solution
The costs to deploy the CloudWatch dashboard vary depending on the volume of events occurring as you use Amazon IVS. To understand the costs, consider the following guidance:
- CloudWatch dashboard: $3.00 per dashboard per month (first 3 dashboards for up to 50 metrics per month are included in the AWS Free Tier)
- CloudWatch custom metrics: up to 7 metrics at $0.30 per metric per month (prorated per hour and only metered when metrics are delivered to CloudWatch)
- Amazon API Gateway: priced based on request volume. This solution deploys 2x API Gateway REST APIs to process events. Request pricing for this capability starts at $3.50 per million requests (events) per month. See API Gateway pricing for more details.
Creating alarms from the dashboard
Once you deploy the dashboard and can observe the performance of your Amazon IVS streams, you may want to create CloudWatch Alarms to send alerts under specific circumstances. We recommend you spend some time observing your CloudWatch dashboard to understand the behavior of metrics for your workload. Once you have determined this baseline, you may want to create alarms to identify particular scenarios that deviate from normal operating conditions. To get you started, the following are some sample alarms to consider deploying:
| Scenario | Key Metric(s) | Suggested Threshold |
| Approaching Service Limits: Viewers / Streams | Concurrent Views, Concurrent Streams | > 80% of Service Quota value |
| Streamers using unsupported bitrates or video resolution | Ingest Bitrate, Ingest Resolution | > 1 |
| Identifying viral or unusual viewer spikes | Concurrent Views | Enable Anomaly Detection with a Standard Deviation > 3 |
| Detecting the failure of a stream to start | Stream Failure | > 1 |
To create a CloudWatch Alarm from the dashboard:
- Mouse-over the specific metric you want to create an alarm for.
- Click on the three vertical dots in the top right corner of the metric window.
- From the drop-down menu, click on View in
- In the window that pops up, you see another view of the metric.
- Click on the bell icon located under the Actions column in the menu to create an Alarm for this metric.
- Set the conditions to correspond to the scenario you want to alarm on.
- As you adjust these values, you see a visual representation of the threshold, alongside your metric values, to help you tune the parameters.
- After clicking Next, you define the action to take when this Alarm is triggered. CloudWatch Alarms can trigger a wide variety of actions.
- For the purposes of this guide, we assume you want to receive an email if an Alarm fires. To configure this, select Create a New Topic in the Amazon Simple Notification Service (Amazon SNS) section and fill out a Topic Name and a comma separated list of email addresses you want to notify.
- For other methods of notification, see the CloudWatch Alarms user guide.
- Click the Create Topic button to complete the setup.
- After clicking Next, you need to set an Alarm name.
- Click Next and then deploy the Alarm.
Conclusion
The Amazon IVS CloudWatch dashboard provides you with a single view of the performance of your Amazon IVS channels in the Region it is deployed in. The dashboard can be used to monitor the day-to-day activity on your streams, measuring metrics like concurrent views and streams. You can use the dashboard to identify scenarios and thresholds you want to be alerted to with CloudWatch.