AWS Cloud Operations Blog
Distributed Tracing using AWS Distro for OpenTelemetry
More and more applications are being developed using serverless architectures with multiple microservices. Customers use managed AWS services including AWS Lambda, Amazon ECS and Amazon EKS running on Amazon Elastic Compute Cloud (EC2) and AWS Fargate for running their code along with services like Amazon API Gateway, Amazon SNS, Amazon SQS, Amazon DynamoDB, Amazon S3, and others. Developers use multiple SDKs and agents from different AWS monitoring services and partner solutions to collect and analyze different performance data for their applications. This increases the time it takes to build an application, and every time there is an update to any of the monitoring solutions, developers have to rebuild, retest, and redeploy the entire application. Running multiple agents also increases resource consumption and the cost of operating the application. Furthermore, customers spend a lot of time manually correlating the traces and metrics from different agents to achieve a comprehensive view of application performance. As a result, many customers want to leverage the new set of standardized OpenTelemetry agents, APIs, and SDKs to capture, correlate, and send application performance data to a variety of monitoring solutions.
OpenTelemetry is a collaborative effort by all of the tracing solution providers to create a common grounds for instrumentation. Instead of each provider having their own instrumentation, all support the common format defined by OpenTelemetry. At its core, OpenTelemetry is a specification describing how instrumentation should to done. There are also language-specific OpenTelemetry projects, for example in Java, that create an instrumentation framework (the OpenTelemetry SDK) along with integrations with popular libraries such as Spring, gRPC, and Flask. Apply instrumentation once, and you’ll have access to any tracing provider that fits your needs.
Today, AWS X-Ray is launching support for tracing applications running on Amazon EC2, Amazon ECS, Amazon EKS, and op-premises using open-source OpenTelemetry APIs and SDKs through AWS Distro for OpenTelemetry. AWS Distro for OpenTelemetry is an AWS distribution of OpenTelemetry that enables developers to use a standardized set of open source APIs, SDKs, and agents to instrument their application once and collect correlated metrics and traces for multiple monitoring solutions including AWS X-Ray for traces and Amazon CloudWatch for metrics. This is a performant and secure distribution of OpenTelemetry components that have been tested for production use and are supported by AWS. Developers can use the auto-instrumentation agent in Java to automatically detect and collect trace data from applications without any coding. The Distro for OpenTelemetry also provides Java and JavaScript SDKs to further instrument the application and collect more detailed, function-level metrics and traces. You can then use the monitoring solutions console to debug and triage applications.
Tracing support in AWS Distro for OpenTelemetry
With AWS Distro for OpenTelemetry, you can collect trace data from applications and send it to the destination for your choice, for example, AWS X-Ray. In future, we will add support for partner solutions and other AWS services. You can use the OpenTelemetry Java auto-instrumentation agent to collect trace performance data from applications without having to re-instrument the applications. In addition, you can further instrument your applications using Java and JavaScript SDKs to gather further business- and application-specific information such as creating additional spans and adding metadata and annotations that could further help in triaging applications. At the same time, we are working with the community to expand the SDK coverage and fast-follow on support for .NET, Python, Go, Ruby, and other languages supported by OpenTelemetry.
AWS Distro for OpenTelemetry is not a fork of the OpenTelemetry project, but a distribution.OpenTelemetry is a community effort to simplify observability instrumentation for all. As a committed, active member of that community, AWS follows an upstream-first approach where all our enhancements are first contributed upstream. Our distribution is then built using the upstream code.
The packages we have created and added upstream automatically enable detection of AWS metadata: for example, an EC2 instance identifier, ECS cluster name, Pod identifiers, and others. We have also added support for the AWS Trace Header, which X-Ray uses to propagate information about a request between AWS managed services – this ensures that you can see a complete trace, even when the request passes through managed services like Amazon API Gateway, AWS Lambda, and others.
Getting started with tracing using AWS Distro for OpenTelemetry in Java
Let’s walk through the steps of instrumenting a sample application is Java and collecting traces using OpenTelemetry for AWS X-Ray. In this example, we will use the sample Java application, instrument the application using the OpenTelemetry Java auto-instrumentation agent, and send data to AWS X-Ray using the OpenTelemetry collector provided by AWS Distro for OpenTelemetry.
Step 1: Download the sample Application
You can use any existing Java application or download the sample Spring PetClinic app. Let’s first build the app:
git clone https://github.com/spring-projects/spring-petclinic.git
cd spring-petclinic
./mvnw package
Step 2: Download and install the OpenTelemetry collector
Get the latest version of the OpenTelemetry collector from the AWS Distro for OpenTelemetry. Follow the Collector installation guide for your environment. The collector is already configured to send trace data to AWS X-Ray. Read Configuring Permission for the Collector to setup permissions for sending traces to AWS X-Ray.
Step 3: Download the Java auto-instrumentation agent and run the application
The Java Agent is an independent Java binary. When starting your application, register it by passing the -javaagent flag to the JVM. It will then automatically find supported libraries in your application and instrument them with OpenTelemetry – no code change needed at all. The latest release of the Java auto-instrumentation agent can be downloaded from the GitHub repo.
Now let’s start up the app. Note that you need to set the OTEL_RESOURCE_ATTRIBUTES variable similar to that shown below to name your service (the node within the larger set of services handling a request). We’ve set the exporter to “Otlp” for this demo. The agent forwards the trace data to the Collector. The Collector is configured to use the X-Ray receiver and the X-Ray exporter to send the collected trace data to X-Ray back-end service.
OTEL_RESOURCE_ATTRIBUTES=service.name=PetClinicService OTEL_EXPORTER=otlp java -javaagent:aws-opentelemetry-agent.jar -jar target/*.jar
Now navigate to the application using http://localhost:8080/ in your browser. Try using some pages, for example “Find Owners”. Then open up the AWS X-Ray management console. You should see the Service Map. You can also analyze individual traces using the Traces view shown below.

AWS X-Ray Service Map showing traced requests

Trace map with Segment timeline
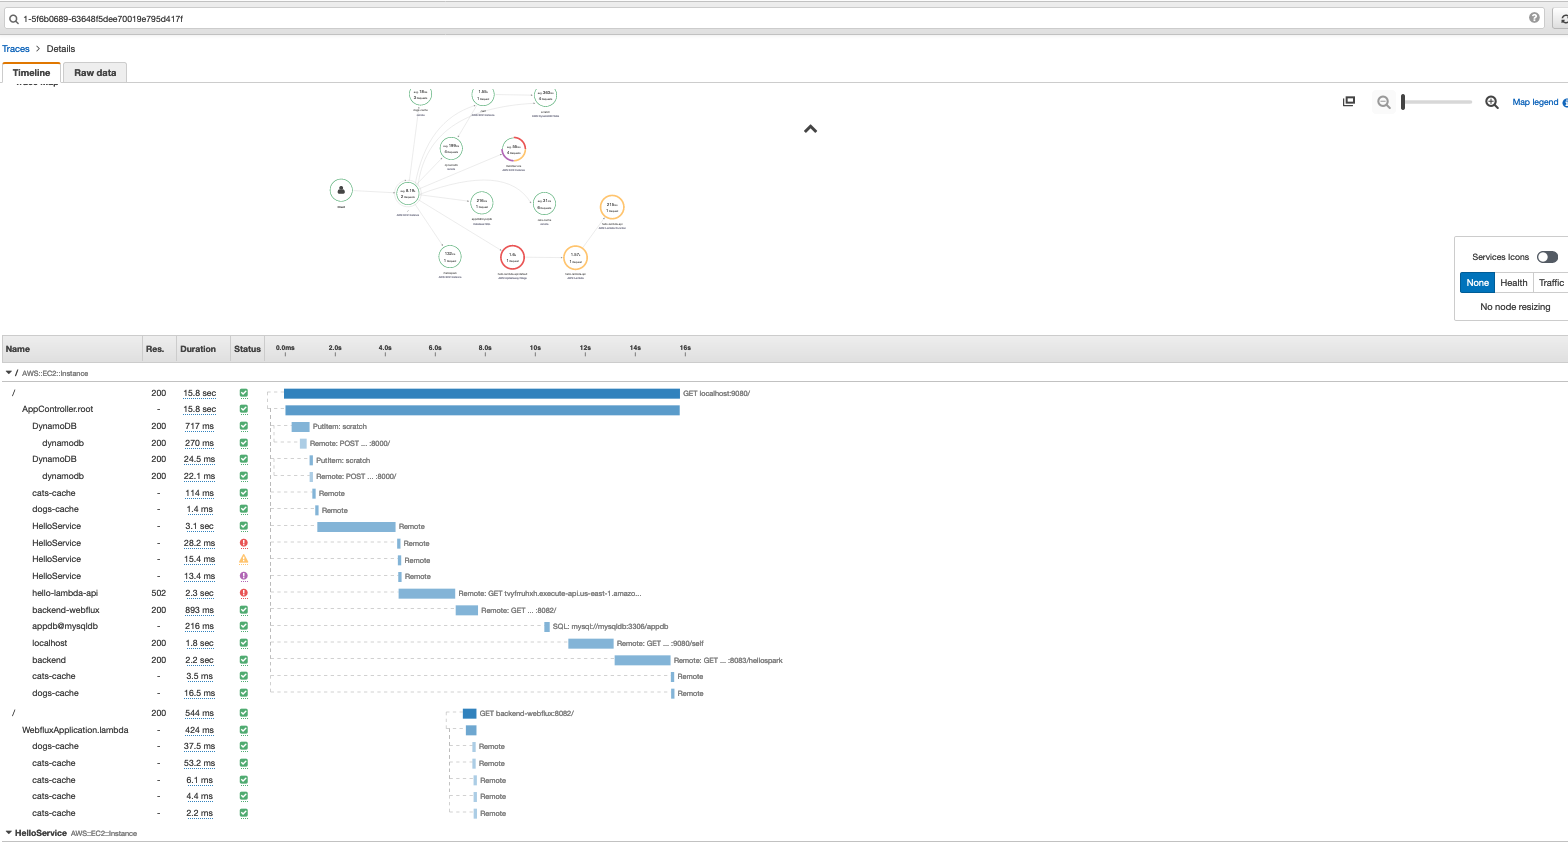
Trace map with Segment timeline details
Spring, gRPC, MySQL, Redis, the AWS SDK, and others all show up, all automatically instrumented by the agent. You can see a list of supported instrumentation on the opentelemetry-java-instrumentation repository. You can also enhance the instrumentation by adding annotations and metadata, and create custom spans using open-source OpenTelemetry APIs.
Summary
With AWS Distro for OpenTelemetry, developers can instrument their applications once using open source OpenTelemetry APIs and SDKs, and send traces and metrics to one or more monitoring backends. For distributed tracing, we walked through an example on how to use the Java auto-instrumentation agent to send data to X-Ray. The requests can pass through a mix of AWS managed services and applications, running on compute services instrumented using OpenTelemetry. Developers can then using the AWS X-Ray management console to debug and triage issues, determine root causes and end users impacted. Learn more about AWS Distro for OpenTelemetry and how to get started using tracing on different compute services in our developer portal. You can connect with us and provide feedback in our forum. If you are interested in contributing to an open source project, find the OpenTelemetry repository for your favorite language and check out the issues list.
Author

Nizar Tyrewalla is a Principal Product Manager in AWS focused on monitoring distributed applications built using microservices architecture. Currently, he is leading the distributed tracing service with AWS X-Ray and ingestion of Observability data using open source tools and frameworks like OpenTelemetry.