AWS Cloud Operations Blog
Easy management and monitoring using AWS System Manager and Amazon CloudWatch Application Insights
As builders, we sometimes run into situations where we don’t have enough time or system knowledge to configure monitoring on our applications. It’s also essential to have a centralized way to monitor and resolve issues in all applications, but they’re not always readily available. Although there are third-party libraries and Windows-based tools to monitor health, it’s burdensome to configure these and challenging to configure them correctly.
AWS has integrated tools to make setting up monitoring for your applications easy, and more importantly, they have the depth and breadth you need to observe their health. From within AWS Systems Manager Application Manager, you can select a button to automatically configure monitoring for your applications via Amazon CloudWatch Application Insights. When you do this, Application Insights will analyze your workloads and setup the recommended metrics, telemetry, and alarms for your applications and resources.
To demonstrate how this works, I’ve built a .NET application that was used as part of builders’ fair IoT security solution at AWS Reinvent 2021. The application uses ASP.NET Core 3.1 to create a dashboard that shows the temperature and humidity readings for the IoT devices attached to a colonial pipeline. To deploy the application on AWS, I used AWS Elastic Beanstalk, a managed service for deploying and scaling web applications. Since I was working under a tight timeline, I didn’t have time to devise a plan or mechanism for monitoring the components of this solution. To overcome this challenge, I used the new one-click monitoring set up option in Application Manager under Systems Manager. This will set up monitoring and aggregate operations information from multiple AWS services and Systems Manager capabilities to a single AWS Management Console.
Application Manager is a capability of AWS Systems Manager that helps DevOps engineers investigate and remediate issues with their AWS resources in the context of their applications and clusters.
In this post, I’ll walk you through the steps I took to deploy the ASP.NET Core application and configure monitoring on the application.
The solution uses an Application Load Balancer (ALB) with two Amazon Elastic Compute Cloud (Amazon EC2) instances in an Amazon EC2 Auto Scaling Group. It connects to Amazon DynamoDB to store IoT Assets readings. Connection strings and IoT asset-level metadata persist in AWS Secrets Manager.
Architecture
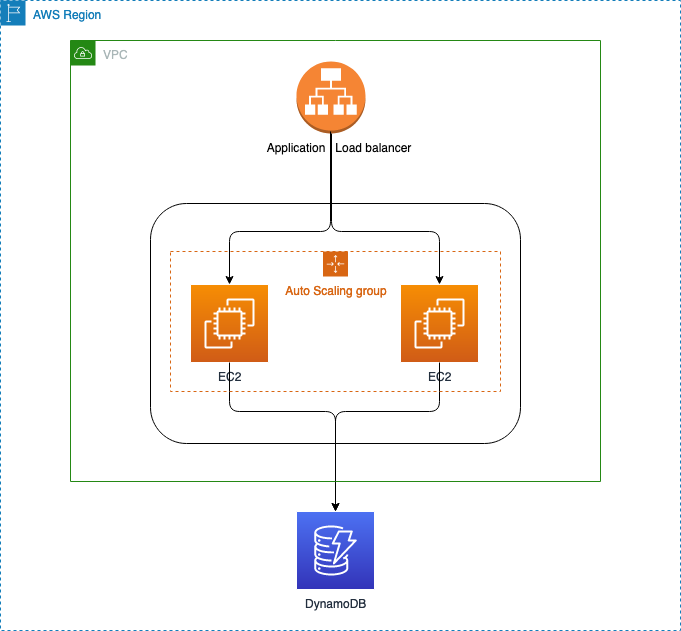
Figure 1: Application deployed on Amazon EC2 instances with an Elastic Load Balancer and DynamoDB
Prerequisites
The following prerequisites are required to follow along with this post:
- Developer machine with Visual Studio (2019 and above) installed
- Sample web application using ASP.NET Core
- Clone the GitHub repo using the steps under Open a project from a GitHub repo
Deploy an application to Elastic Beanstalk
To start, I deployed the application to Elastic Beanstalk through Visual Studio by installing the AWS tool kit for Visual Studio. The following are the steps to deploy:
- Right-click on the visual studio solution and select Publish to Elastic Beanstalk.
- Create or select an existing environment with the above or similar architecture.
- Select an ALB under application options to scale.
- Review the configuration and deploy.
More information about .NET deployment on Elastic Beanstalk
Add tags to solution components
I enabled monitoring for this solution based on tags in the Application Manager console. The following are the steps to add tags to solution components.
- Open the deployed environment under Elastic Beanstalk.
- Under tags, add the necessary tag for Amazon EC2 instances.
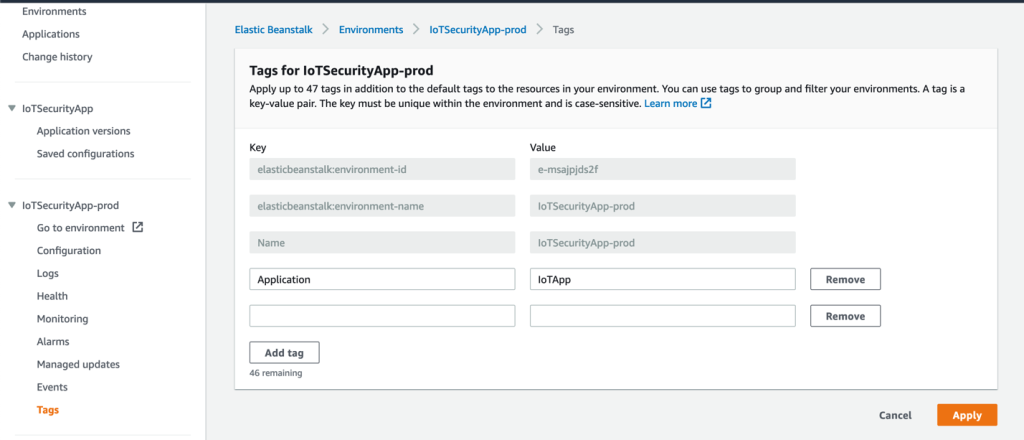
Figure 2: Application tags for Elastic Beanstalk environment
- For DynamoDB, under the tables menu, select the required tables.
- Select Actions and Add Tag to selection to add the necessary tags.
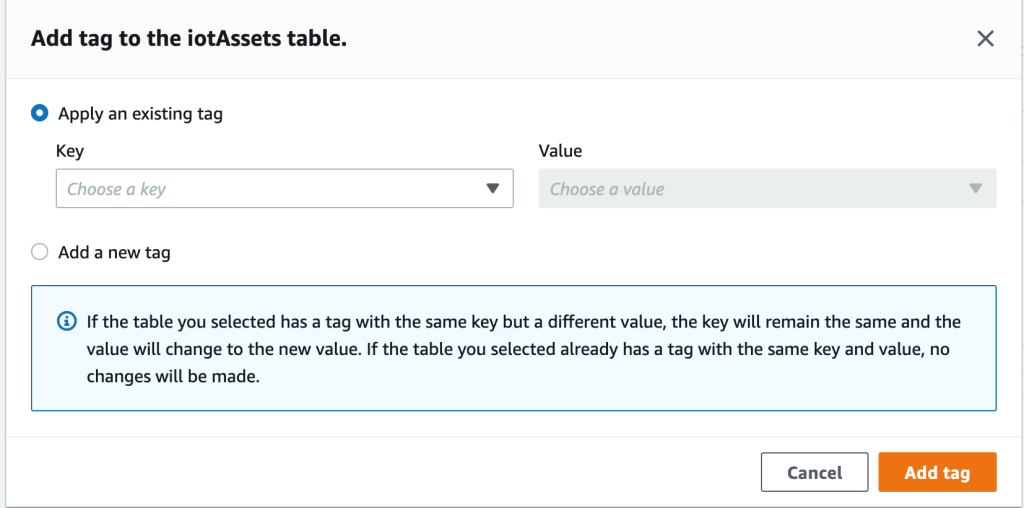
Figure 3: Add a tag for DynamoDB
Create application under Application Manager
For applications, Application Manager imports metadata about all of your AWS resources that you organize into Resource Groups. Each resource group is listed in the Custom applications category as a unique application. It also automatically imports resource metadata from AWS CloudFormation, AWS Launch Wizard, Amazon Elastic Container Service (Amazon ECS), Amazon Elastic Kubernetes Service (Amazon EKS), and AWS AppRegistry.
Suppose you want to provide more context about a collection of resources. In that case, you can manually create an application in Application Manager and move resources or groups of resources into that application. This capability lets you view operations information in the context of an application.
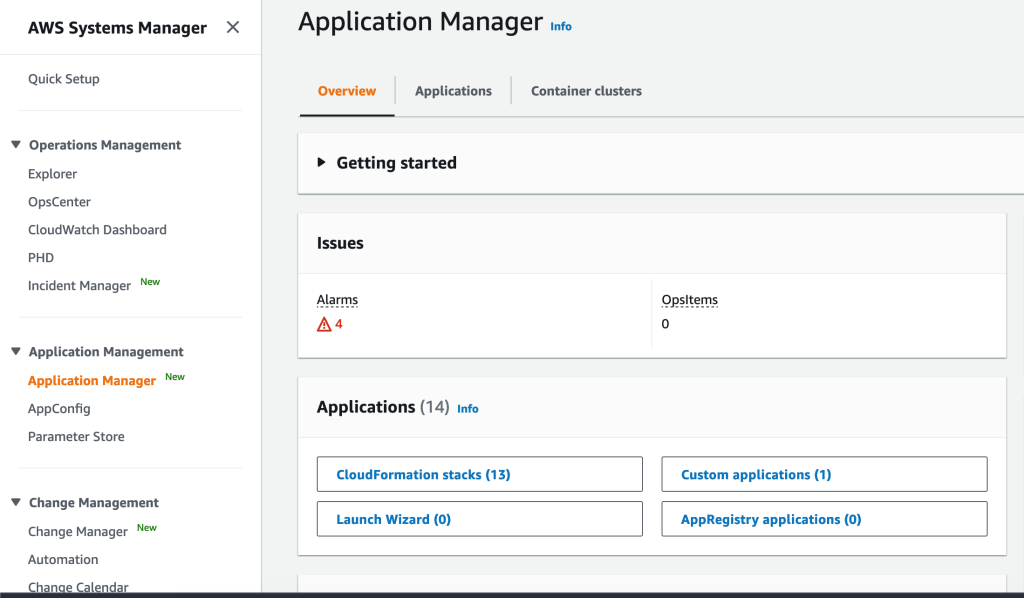
Figure 4: Application Manager under AWS Systems Manager
I created a custom application under Application Manager and selected the application based on tags. You can choose the components based on Resource Groups or CloudFormation stacks.
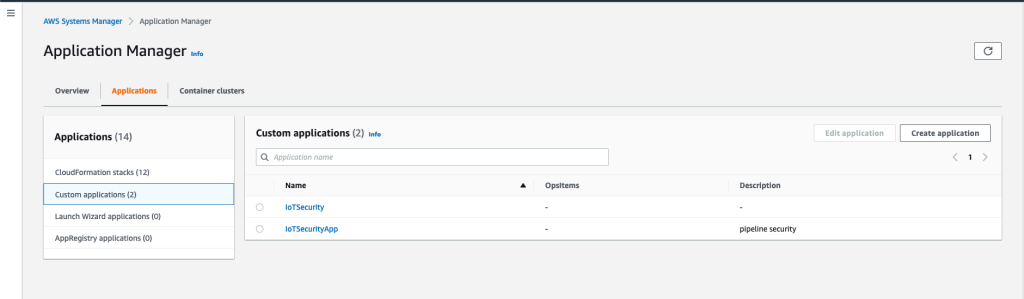
Figure 5: Custom applications dashboard
Click create application and add application details. Select “Choose based on tags” under application components.
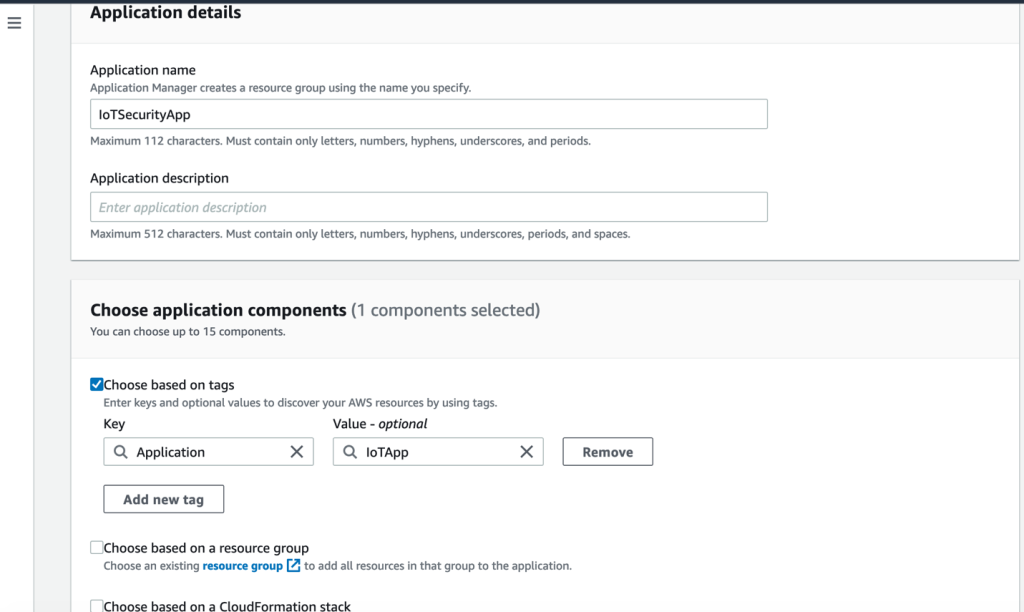
Figure 6: Add a custom application based on tags
To see the details of an application, select the application name. Under the resources tab, you can choose a resource name and view contextual and operational information provided by AWS Config and AWS Cost Explorer without leaving Systems Manager.
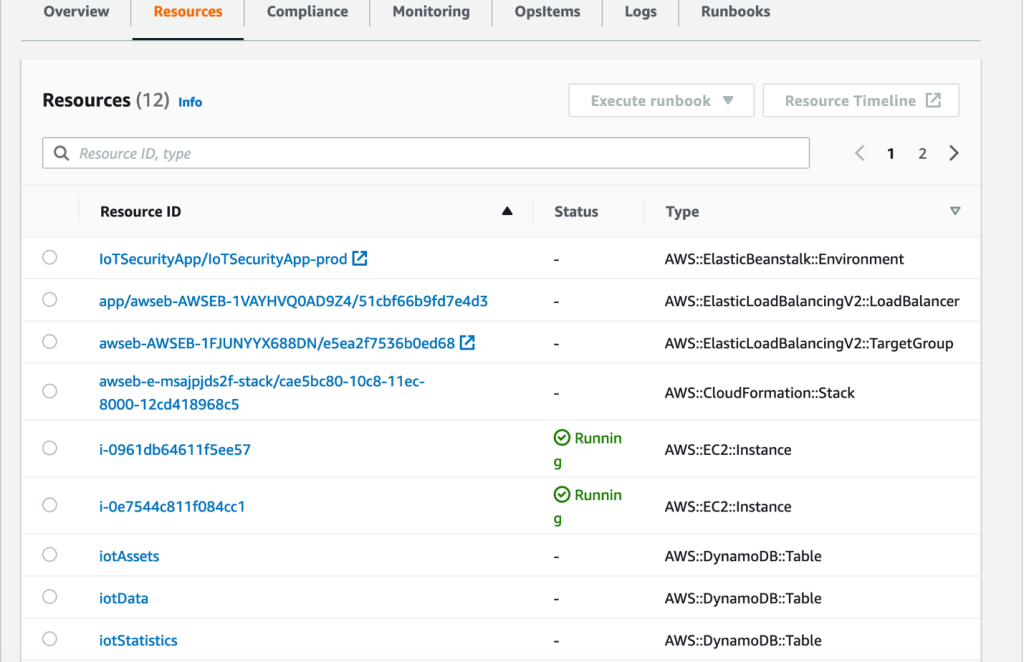
Figure 7: Resources based on tags attached
In the Monitoring tab, you can auto-configure the application for monitoring. The monitoring tab provides the integration point for application monitoring via CloudWatch Application Insights. If monitoring is not configured, you’ll be presented with a one-click option to set up monitoring for your application automatically. When you choose to set up monitoring, it will identify your workloads and the underlying resources. Then, based on this, you’ll set up the recommended metrics, logs, and alarms to monitor these.
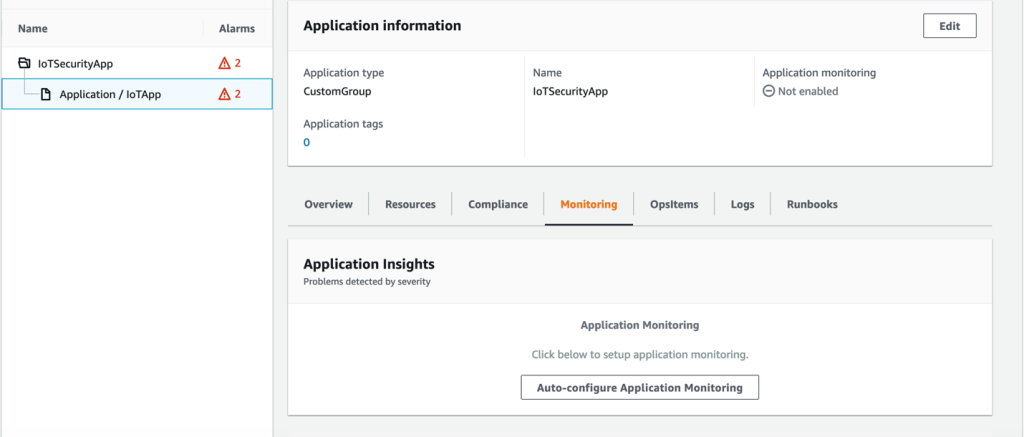
Figure 8: Auto-configure application monitoring
Click on “Auto-configure Application Monitoring” for configuring application monitoring via CloudWatch Application Insights.
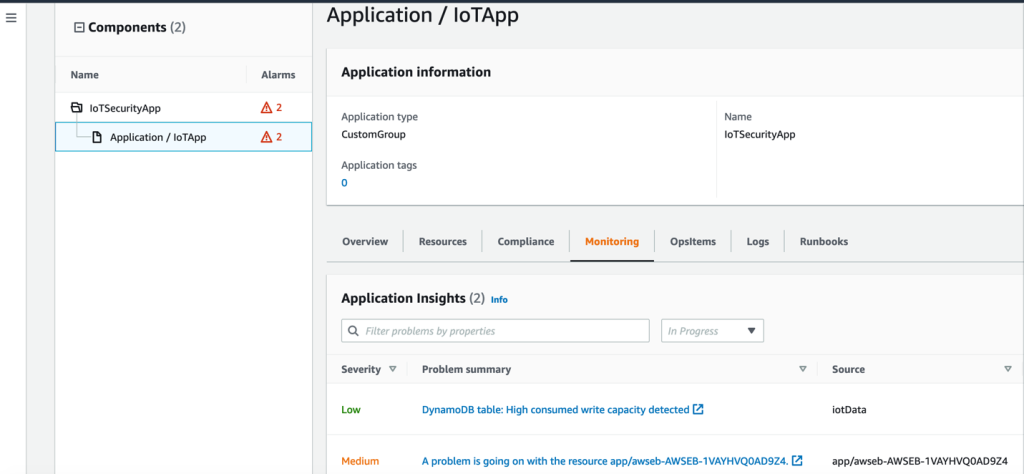
Figure 9: Custom application with application insights
Once the monitoring set up is complete, or if you’ve set it up earlier, you’ll see summaries of any issues discovered in the monitoring tab. You can check the details of these issues by selecting the problem summary, which takes you directly to the CloudWatch Application Insights dashboard. Alarms by service information are also provided in the following dashboard with metric level details for recent alarms.
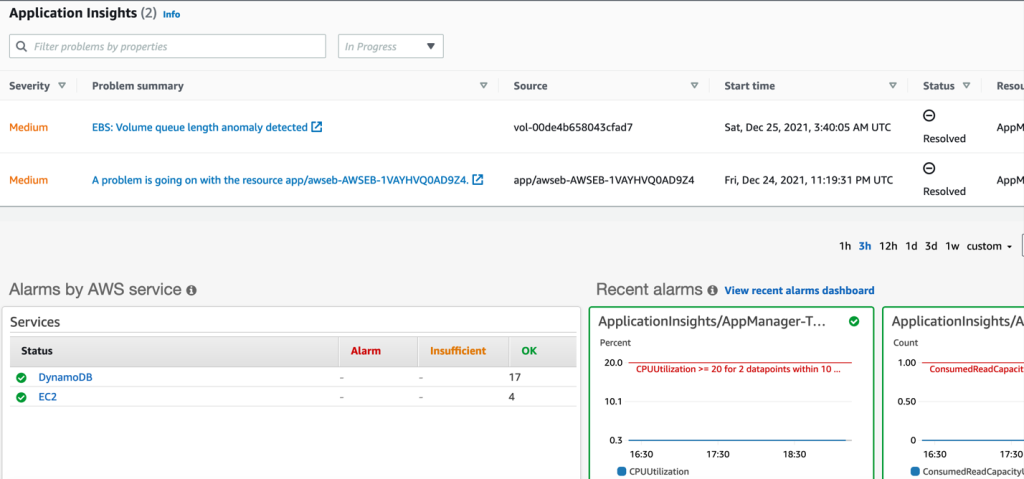
Figure 10: Application Insights details with alarms by AWS services
View and manage OpsCenter OpsItems
Application Manager also integrates with AWS Systems Manager OpsCenter to provide a list of operational work items (OpsItems) for your applications and clusters. The list reflects automatically generated and manually created OpsItems for the application. You can view details about the resource that created an OpsItem and the OpsItem status, source, and severity.
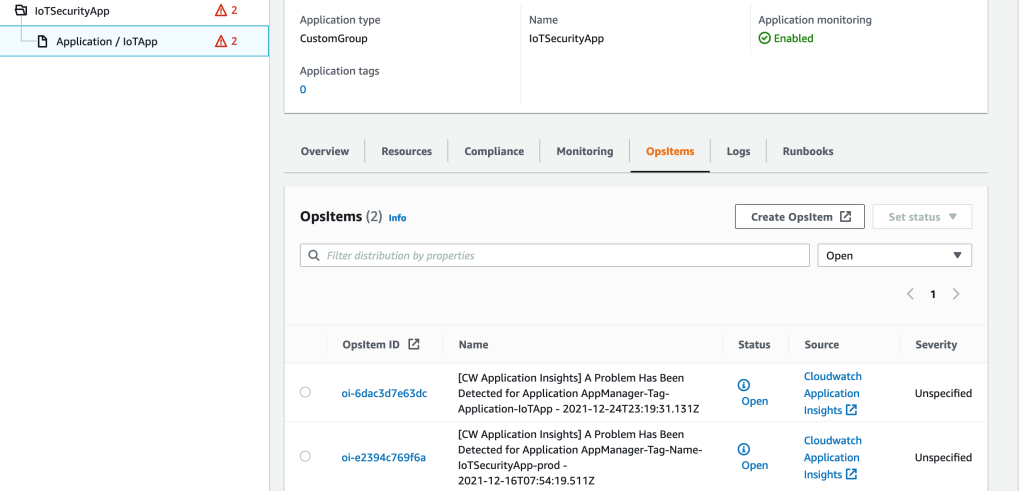
Figure 11: OpsItems info created for custom application automatically
For this application, a couple of Opsitems were automatically created. By selecting the OpsItemID, you’ll be taken to the OpsCenter dashboard in Systems Manager, where you can look at the related resource details.
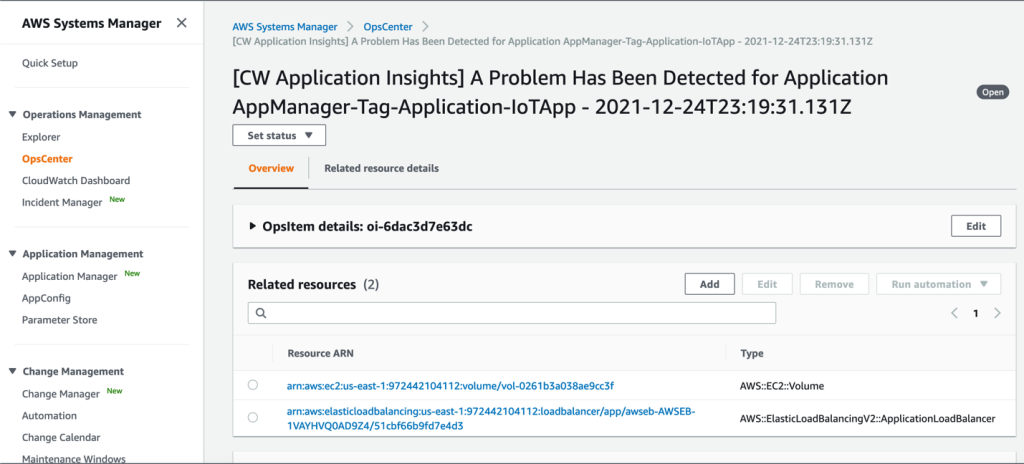
Figure 12: OpsItems details directed to OpsCenter
View log data for the application
Amazon CloudWatch Logs is another service integrated with Application Manager that provides log data in the context of your application without having to leave Systems Manager. The Logs tab displays a list of log groups from CloudWatch Logs.
Each separate source of logs in CloudWatch Logs makes up a separate log stream. A log group is a group of log streams that share the same retention, monitoring, and access control settings. You can define log groups and specify which streams to put into each group.
For example, AssetReadingsLogGroup is used to capture application-level logs. This action takes you to a CloudWatch dashboard to display log streams based on the event when it happened.
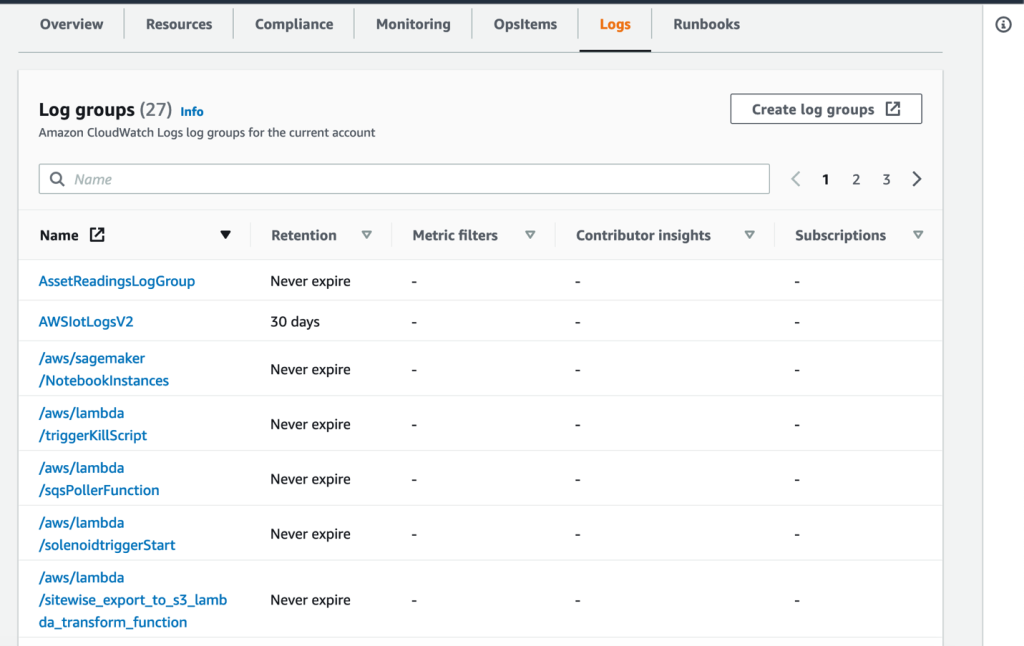
Figure 13: Logs information for resources
Add runbooks to remediate issues
Application Manager lets you run predefined Systems Manager Automation runbooks to remediate common AWS resource issues. You can also perform operational tasks with runbooks, e.g., create a DynamoDB backup.
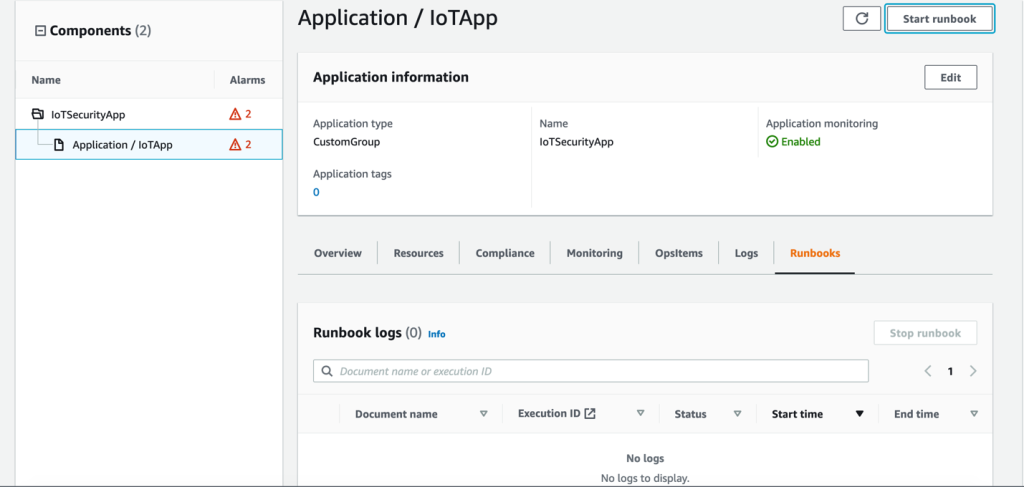
Figure 14: custom application automated runbooks
To use these, you can choose a resource in Application Manager and select a runbook that performs the desired remediation task.
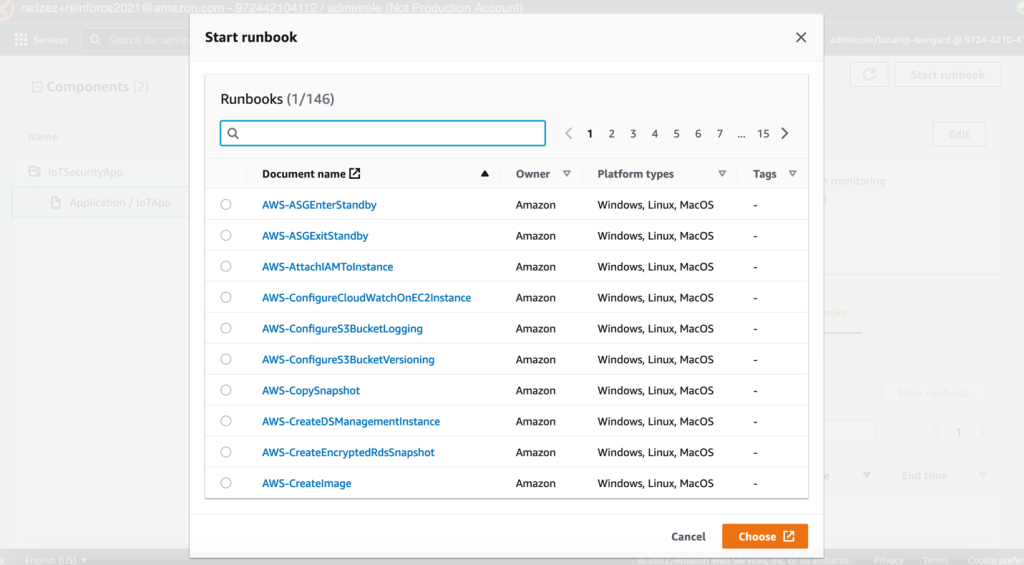
Figure 15: runbook for custom application resources
For example, you can start a runbook for enabling encryption on the following DynamoDb table.
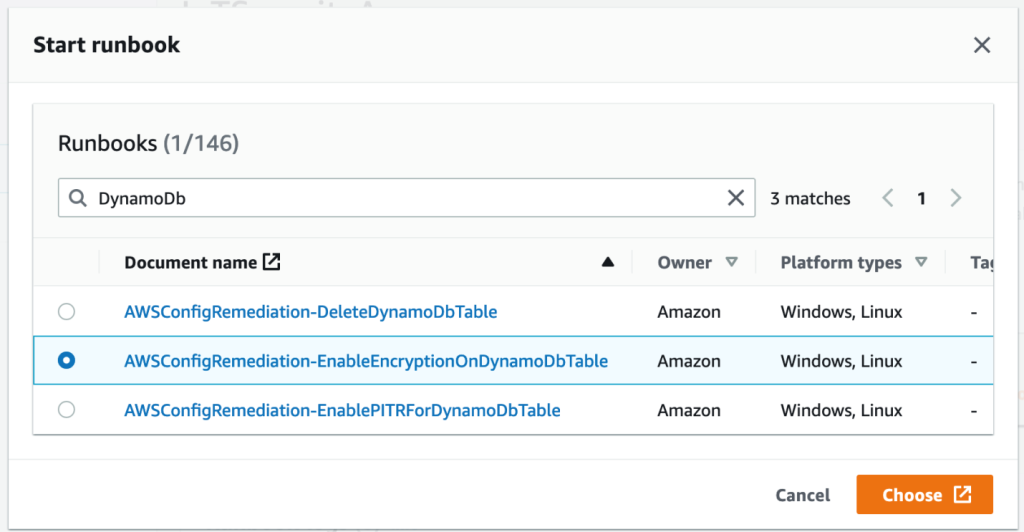
Figure 16: runbook remediation enables encryption on DynamoDB table
View resource compliance details for application
The compliance details of your resources are available under the Compliance tab. I’ve created some compliance rules under the Config Rules Compliance section for Dynamo DB tables. In the following screenshot, some tables aren’t compliant, as they don’t have PITR (point-in-time recovery) enabled.
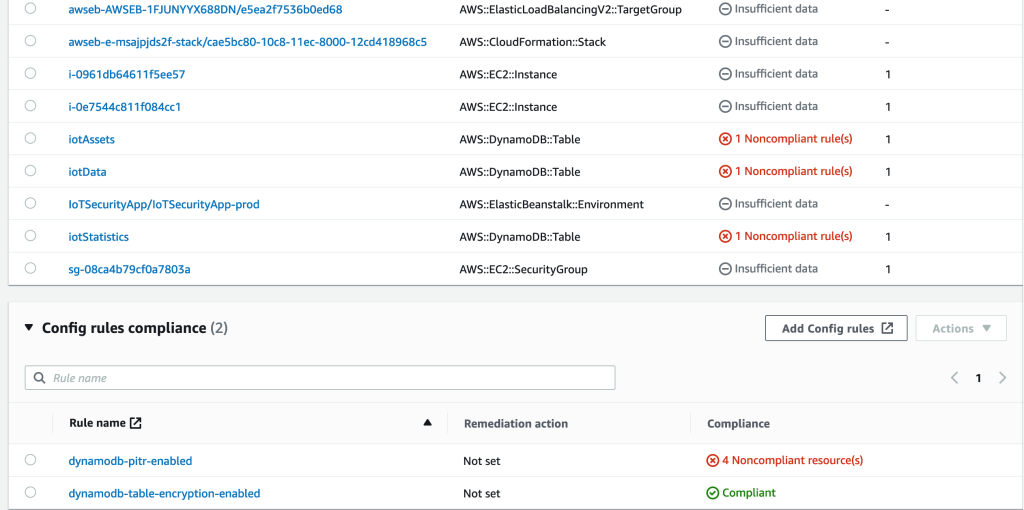
Figure 17: compliance details for resources
View resource cost details for the application
Yet another service integrated with Application Manager is AWS Billing and Cost Management through the Cost Explorer widget. After enabling Cost Explorer in the Billing and Cost Management console, the Cost Explorer widget in Application Manager shows cost data for a specific non-container application or component.
I have activated an application tag under cost allocation tags. After selecting the tag for activation, it can take up to 24 hours for the tags to show the total cost in the cost explorer.
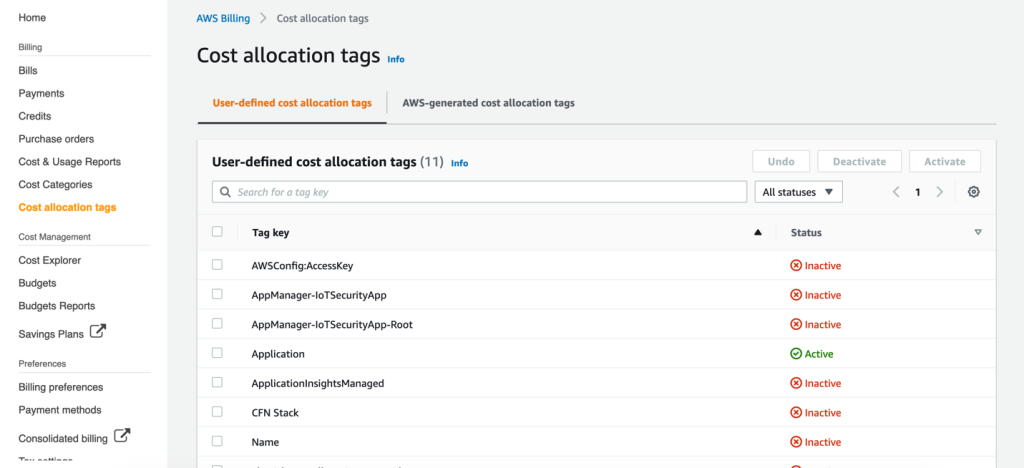
Figure 18: Activate cost allocations tags
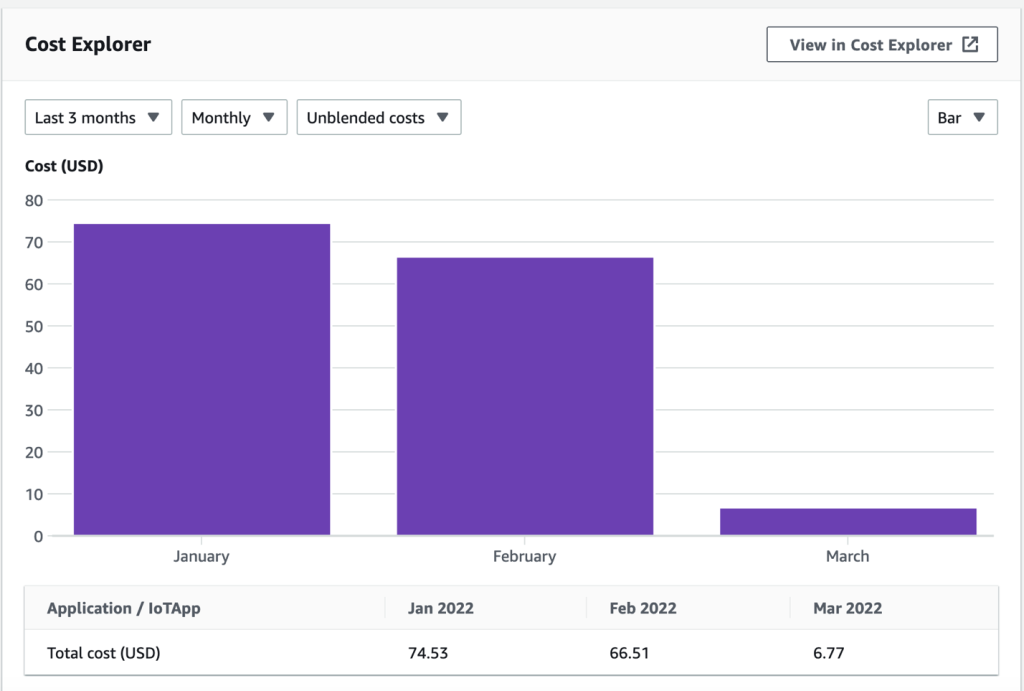
Figure 19: Cost explorer dashboard for all resources under custom application
Conclusion
In this blogpost we have provided a step by step to quickly set up and centrally monitor your applications. With the integrated CloudWatch Application Insights service, easily add Opsitems, check compliance, and see cost details, you get a centralized view of the health of your applications and resources and the ability to analyze and remediate problems quickly. There is no price for monitoring assistance, compliance, and analysis. Still, you do pay the standard pricing for the OpsItems and monitoring data (metrics, logs, and alarms) as per public CloudWatch pricing.
Authors: