AWS Cloud Operations Blog
Monitoring best practices for AWS Outposts
AWS Outposts allows you to run AWS infrastructure and services on-premises for a consistent fully managed hybrid experience. Outposts supports workloads and devices requiring low latency access to on-premises systems, local data processing, data residency, and application migration with local system inter dependencies.
Outposts offers customers Amazon CloudWatch metrics and AWS Health events to effectively observe as well as manage their Outposts. This blog post highlights observability and event management best practices specific to Outposts. It covers operational strategies such as centralized notifications across accounts, dashboards and actions that can be customized with AWS Health Aware. Setting up the right monitoring, alerting, and automation is critical to ensuring the high availability and operational excellence of your systems.
Leverage Outposts metrics for capacity and networking
Outposts publishes data points to Amazon CloudWatch for your Outposts. CloudWatch enables you to retrieve statistics about those data points as an ordered set of time series data, known as metrics. You should use these metrics to set up alarms with the right thresholds, dashboards and alerting for all the AWS services (e.g. EC2) you use on Outposts.
Due to the on-premises nature of Outposts, it’s important to monitor the utilization of capacity of both EC2 and EBS resources across the Outposts to manage capacity, especially if multiple teams are using the Outpost. In addition to the individual resource level capacity CloudWatch metrics, CapacityExceptions are also populated and detailed in CloudWatch metrics for AWS Outposts.
CloudWatch dashboards are customizable home pages in the CloudWatch console that you can use to monitor your resources in a single view. These dashboards are useful for regular reviews of metrics (e.g. weekly) to review trends which is a best practice highlighted in the Well Architected Framework’s Operational Excellence Pillar. An example of an Outpost capacity dashboard is shown as follows and detailed steps to setting it up are shown in our blog on Monitoring AWS Outposts capacity. An Outposts specific CloudWatch Dashboard can be created using the methods shared in our blog on Deploying an automated Amazon CloudWatch dashboard for AWS Outposts using AWS CDK

Figure 1: CloudWatch dashboard showing capacity metrics
Since Outposts is connected to an AWS Region, monitoring the network is important to ensure that all the Outposts capabilities are available. The service link is a connection from your Outpost back to your chosen AWS Region or Outposts home Region. The ConnectedStatus metric shows the status of an Outpost’s service link connection and hence is an important one to monitor.
The local gateway for your Outposts rack enables connectivity from your Outpost subnets to all AWS services that are available in the parent Region. A Local Network Interface (LNI) for your Outposts servers connects an EC2 instance to your on-premises network. We recommend monitoring the BGP status of the local gateway or LNI from your network device peered with the Outposts rack or servers. Additionally, we also provide IfTrafficIn and IfTrafficOut to provide you with the bitrate of the data coming to and from Outposts over the local gateway. Amazon CloudWatch offers Metric math which enables you to query multiple CloudWatch metrics and use math expressions to create new time series based on these metrics. Metric Math can be used to provide you aggregate traffic bit rates.
It’s a best practice to set up alarming for metrics that can impact your operations. Amazon CloudWatch allows to setup metric alarms (watches a single CloudWatch metric or the result of a math expression based on CloudWatch metrics). You can also set up composite alarms (rule expression that takes into account the alarm states of other alarms that you have created) as explained in our guide on using Amazon CloudWatch Alarms. We show an example of setting up an alarm for the Outposts service link ConnectedStatus metric as follows.
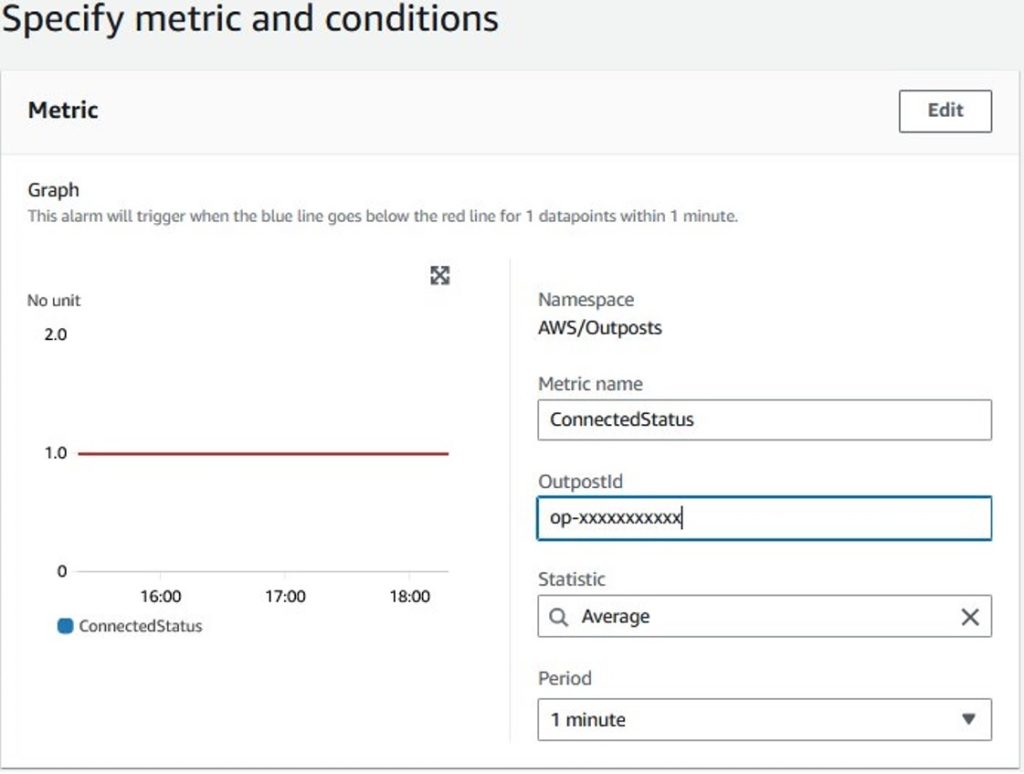
Figure 2: Outposts connectedStatus CloudWatch metric alarm creation
Metrics across all the services that you use on Outposts should be monitored e.g. EC2, RDS, ALB. AWS Managed Services (AMS) have years’ worth of experience with monitoring as well as alarming and have posted default thresholds in their guide on Alerts from baseline monitoring in AMS. One service metric that’s particularly important to monitor on Outposts is the EC2 system reachability status metric which monitors the AWS systems on which your instance runs. This is useful to determine if the underlying system for your resources is unhealthy and requires failover as well as replacement.
Manage events, set up alerting and automation
There are key events relevant to efficient operations of Outposts that require monitoring. Many of these are surfaced on AWS Health. AWS Health provides ongoing visibility into your resource performance and the availability of your AWS services and accounts. You can use AWS Health events to learn how service and resource changes might affect your applications running on AWS. AWS Health provides relevant and timely information to help you manage events in progress. AWS Health also helps you be aware of and to prepare for planned activities. The service delivers alerts and notifications triggered by changes in the health of AWS resources, so that you get near-instant event visibility and guidance to help accelerate troubleshooting. There are two critical events that must be monitored:
EC2 Retirement: The AWS_EC2_INSTANCE_RETIREMENT_SCHEDULED Health event means that an instance is scheduled to be retired when AWS detects irreparable failure of the underlying hardware that hosts the instance. With Outposts, this event means that we need to work with you to replace the hardware that is unhealthy. It’s important to ensure that you have enough capacity on the Outpost to handle the failover from the failed hardware and it’s recommend to have automated failover for high availability. You should order enough compute capacity to support an N+M availability model, where N is the required number of servers and M is the number of spare servers provisioned to accommodate server failures. If AWS detects an irreparable issue with hardware hosting EC2 instances running on your Outpost, we will send you an instance-retirement notice for the affected instance detailed in the Outposts maintenance page.
Service Link down: AWS_OUTPOSTS_SERVICE_LINK_DOWN Health event means that the Outposts service link is down and hence there is no connectivity from the Outposts to the Region. Existing resources will continue to run but new AWS resources that require API calls (e.g. ec2 run-instances) can’t be executed until service link connectivity is restored. The AWS Health event is created in addition to the ConnectedStatus CloudWatch metric and we recommend setting up alerting using at least one option. This event should trigger some action from your network teams to investigate the issue. A guide on troubleshooting the service link is available on the AWS Outposts rack network troubleshooting checklist.
These AWS Health events are surfaced via AWS Eventbridge, AWS Health API and email. We recommend updating the correct contact information, especially the operations contact as described in our accounts documentation so that the correct individuals receive these events. AWS Health Aware allows you to customize AWS Health Alerts for Organizational and Personal AWS Accounts. It’s a powerful tool when you need customized notifications, alerts, and automation. Further examples of automating AWS Health events and customizing notifications are available at AWS Health Tools (e.g. Amazon Simple Notification Service (SNS) notifications and Slack integration).
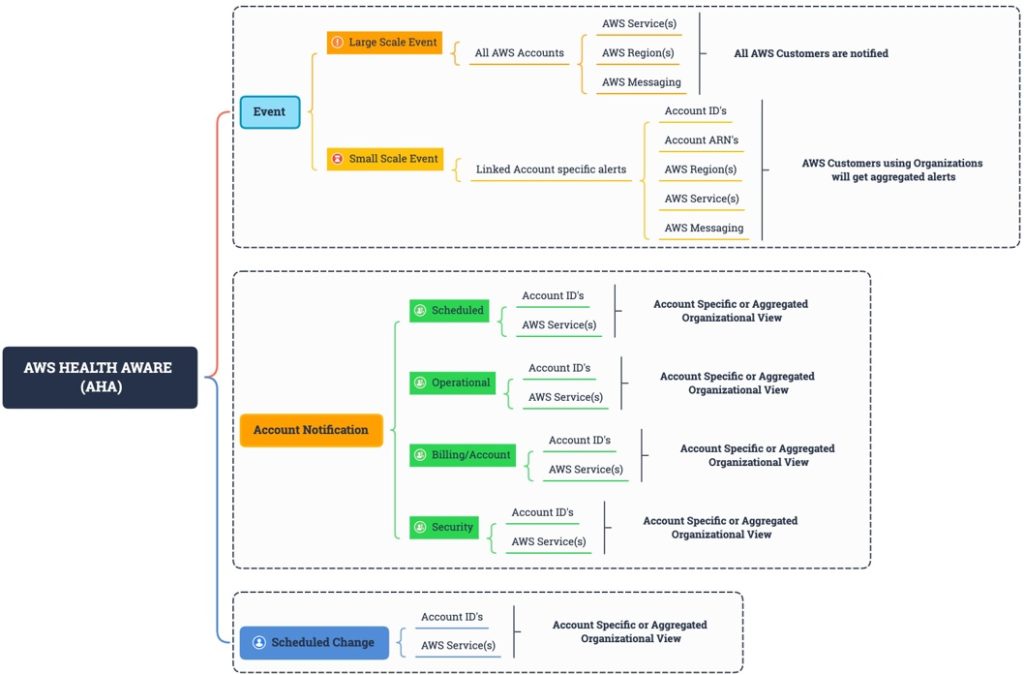
Figure 3: AWS Health API events are outlined across accounts and services
Leverage AWS monitoring and analytics tools
In addition to CloudWatch and AWS Health, it’s important to know what other tools are available for monitoring and diagnostics. Many third-party partner monitoring products also integrate with Amazon CloudWatch and AWS Health to help provide you and end-to-end picture of your applications health on Outposts. Here are some additional capabilities from AWS to add to your monitoring toolkit:
CloudTrail logs
Use AWS CloudTrail to capture detailed information about the calls made to AWS APIs. You can store these calls as log files in Amazon S3. You can use these CloudTrail logs to determine such information as which call was made, the source IP address where the call came from, who made the call, and when the call was made. The CloudTrail logs contain information about the calls to API actions for AWS Outposts. They also contain information for calls to API actions from services on an Outpost, such as Amazon EC2 and Amazon EBS. For more information, see AWS Outposts information in CloudTrail. For API issues, running queries in AWS Cloudtrail Lake and quickly isolate which API calls are failing. For example, the following snippet shows how to show any security group changes that might have caused an issue:
SELECT eventname, useridentity.username, sourceIPAddress, eventtime, element_at(requestParameters, 'groupId') as SecurityGroup, element_at(requestParameters, 'ipPermissions') as ipPermissions
FROM $EDS_ID
WHERE (element_at(requestParameters, 'groupId') like '%sg-%')
and eventtime > '2023-05-01T00:00:00Z'
order by eventtime asc;
VPC Flow Logs
Use VPC Flow Logs to capture detailed information about the traffic going to and from your Outpost and within your Outpost. A flow log record represents a network flow in your VPC. Each record captures a network internet protocol (IP) traffic flow (characterized by a 5-tuple on a per network interface basis) that occurs within an aggregation interval. Similarly you can use ELB access logs for inspecting detailed information about the requests sent to your Application Load Balancer on Outposts. Amazon Athena can make it easy to analyze flow logs using queries after an Athena table for Amazon VPC flow logs is created as explained in the VPC flow logs example documentation. For example, the following query lists all the rejected TCP connections and uses the newly created date partition column, date, to extract from it the day of the week for which these events occurred:
SELECT day_of_week(date) AS
date,
interface_id,
srcaddr,
action,
protocol
FROM vpc_flow_logs
WHERE action = 'REJECT' AND protocol = 6
LIMIT 100;
An example of an output to the the query showing rejected TCP connections is as follows:
| A | B | C | D | E | F | |
| 1 | day | date | interface_id | srcaddr | action | protocol |
| 2 | 2 | 5/4/2023 | eni-xxxxxxxxxx | 192.168.0.13 | REJECT | 6 |
Traffic Mirroring
Use Traffic Mirroring to copy and forward network traffic from Outpost to out-of-band security and monitoring appliances in Outpost. You can use the mirrored traffic for content inspection, threat monitoring, or troubleshooting.
AWS X-Ray
Use AWS X-Ray for a complete view of requests as they travel through your application and filters visual data across payloads, functions, traces, services. On Outposts, the AWS X-Ray daemon can listens for traffic on EC2 instances, gather raw segment data, and relays it to the AWS X-Ray API.
CloudWatch Synthetics
Proactive monitoring of your resources can be done using canaries. Amazon CloudWatch Synthetics can create canaries, configurable scripts that run on a schedule, to monitor endpoints and APIs. For example you can setup a canary testing HTTPS traffic from applications in the AWS region to the Outpost either via the service link or via the local gateway.
AWS Incident Detection and Response
AWS Incident Detection and Response offers AWS Enterprise Support customers proactive monitoring and incident management for their selected workloads on Outposts. AWS Incident Detection and Response is designed to help reduce potential for failures on workloads and to accelerate recovery from critical incidents.
Utilize multi-account capabilities
AWS Resource Access Manager (RAM) helps you securely share your resources across AWS Accounts. AWS Outposts owners can share their Outposts and Outposts resources, including Outposts sites and subnets, with other AWS accounts within an AWS Organization. As an Outpost owner, you can create and manage Outposts resources centrally, and share the resources across multiple AWS accounts within your AWS Organization.
An Outpost Owner can share Outpost resources with:
- Specific AWS accounts inside of its organization in AWS Organizations
- An organization unit inside of its organization in AWS Organizations
- Its entire organization in AWS Organizations
AWS Accounts that consume resources shared to them from the Outposts owner cannot view or modify resources owned by other AWS Accounts, and cannot modify the Outposts that are shared with them. You cannot share an Outpost resource that has been shared with you, and you can only share Outpost resources to accounts that are within your AWS Organization.
When you share Outposts resources with accounts in your organization, CloudWatch metrics that are associated with the Outposts resources are not available to the consumer account. With Amazon CloudWatch cross-account observability, you can monitor and troubleshoot applications that span multiple accounts within a Region. Seamlessly search, visualize, and analyze your metrics, logs, and traces in any of the linked accounts without account boundaries.
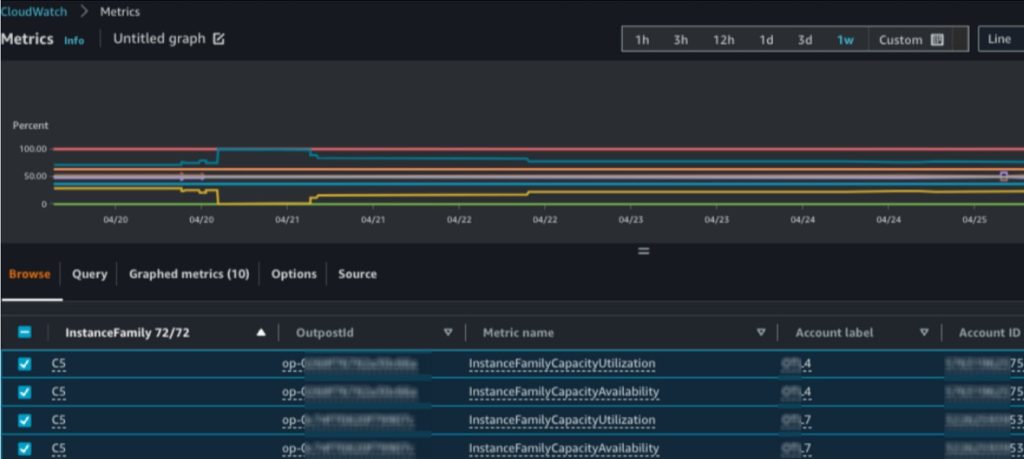
Figure 4: CloudWatch dashboard showing Outposts metrics across account and Outposts
Additionally, the consumer account will be able to run Outposts CLI commands to obtain the current instance types available on the Outpost. For monitoring events when using multiple accounts and shared resources on the Outposts, we recommend using AWS Health Aware to ensure the right owners are notified so that they can take actions or set up the right automation.
Conclusion
Setting up the right monitoring, alerting and automation is critical to ensuring the high availability and operational excellence of your systems. Due to the on-premises nature of Outposts, it’s important to monitor the utilization of capacity and health of the network across the Outposts.
Utilizing AWS Resource Access Manager, multiple teams can share Outpost resources securely, leveraging current AWS organizational strategies. Centrally managing CloudWatch metrics and alerts into a single monitoring account allows for a single view for your Outpost CloudWatch metrics, and will allow accounts within the AWS Organization to view metrics associated with their shared Outpost resources. AWS Health Aware empowers you to create custom notification and alerts across accounts in response to AWS Health events.
We hope you can now leverage AWS monitoring and analytics tools to set up Outposts metrics to monitor capacity and networking, manage events, and set up alerting and automation.