AWS Cloud Operations Blog
Monitoring GPU workloads on Amazon EKS using AWS managed open-source services
As machine learning (ML) workloads continue to grow in popularity, many customers are looking to run them on Kubernetes with graphics processing unit (GPU) support. Amazon Elastic Compute Cloud (Amazon EC2) instances powered by NVIDIA GPUs deliver the scalable performance needed for fast ML training and cost-effective ML inference. Monitoring GPU utilization gives valuable information for researchers working on GPU-accelerated ML workflows and infrastructure teams. Patterns in GPU metrics correlate with workload behavior and enable optimizing resource allocation, identifying anomalies, and improving the overall system performance and stability. However, given the significant difference between central processing units (CPUs) and GPUs form both design and functional perspectives, setting up robust observability for GPU workloads could be a daunting task.
We recently announced the release of the AWS CDK Observability Accelerator, a set of opinionated modules to help customers setup observability for Amazon Elastic Kubernetes Service (EKS) clusters. It simplifies observability provisioning and maintenance for Amazon EKS clusters using AWS Cloud Development Kit (AWS CDK) and CDK EKS Blueprints. The AWS CDK Observability Accelerator is organized around patterns, which are reusable units for deploying multiple resources. The open source observability set of patterns instruments observability with Amazon Managed Grafana dashboards, AWS Distro for OpenTelemetry collector to collect metrics and Amazon Managed Service for Prometheus to store them.
The NVIDIA Data Center GPU Manager (DCGM) is a set of low overhead tools that can perform a variety of functions including active health monitoring, diagnostics, system validation, policies, power and clock management, group configuration, and accounting. DCGM includes APIs for gathering GPU telemetry. The NVIDIA GPU Operator which installs DCGM Exporter uses Go bindings to collect GPU telemetry data such as memory utilization, and traffic interconnect from DCGM and then exposes it to an http endpoint (/metrics) which is remote written and stored in Amazon Managed Service for Prometheus. The NVIDIA GPU Operator add-on uses the operator framework within Amazon EKS, to automate the management of all NVIDIA software components needed to provision GPU, including DCGM and DCGM Exporter.
In this post, we’ll explore how to leverage the AWS CDK Observability Accelerator to quickly build observability for GPU workloads on Amazon EKS, using AWS managed open-source services and NVIDIA tools.
Solution Overview
The pattern we are going to deploy will provision the following components:
- An Amazon EKS cluster with a managed node group supported by GPU-based Amazon EC2 instances; the AMI type of the node group is AL2_x86_64_GPU AMI, which uses the Amazon EKS-optimized Linux AMI with GPU support
- AWS Distro For OpenTelemetry Operator and Collector for collecting metrics and traces
- AWS for FluentBit to capture and ingest logs into Amazon CloudWatch
- Grafana Operator to add AWS data sources and create Grafana dashboards in Amazon Managed Grafana
- Flux to perform GitOps sync to the EKS cluster of a Git repository hosting configuration of Grafana dashboards and AWS data sources. Please check our GitOps with Amazon Managed Grafana module in One Observability Workshop to learn more on this topic
- External Secrets Operator to retrieve and sync the Grafana API keys from AWS Systems Manager
- NVIDIA GPU Operator
In the following diagram, you can see the metrics from source to destination, through the main components of the pattern:
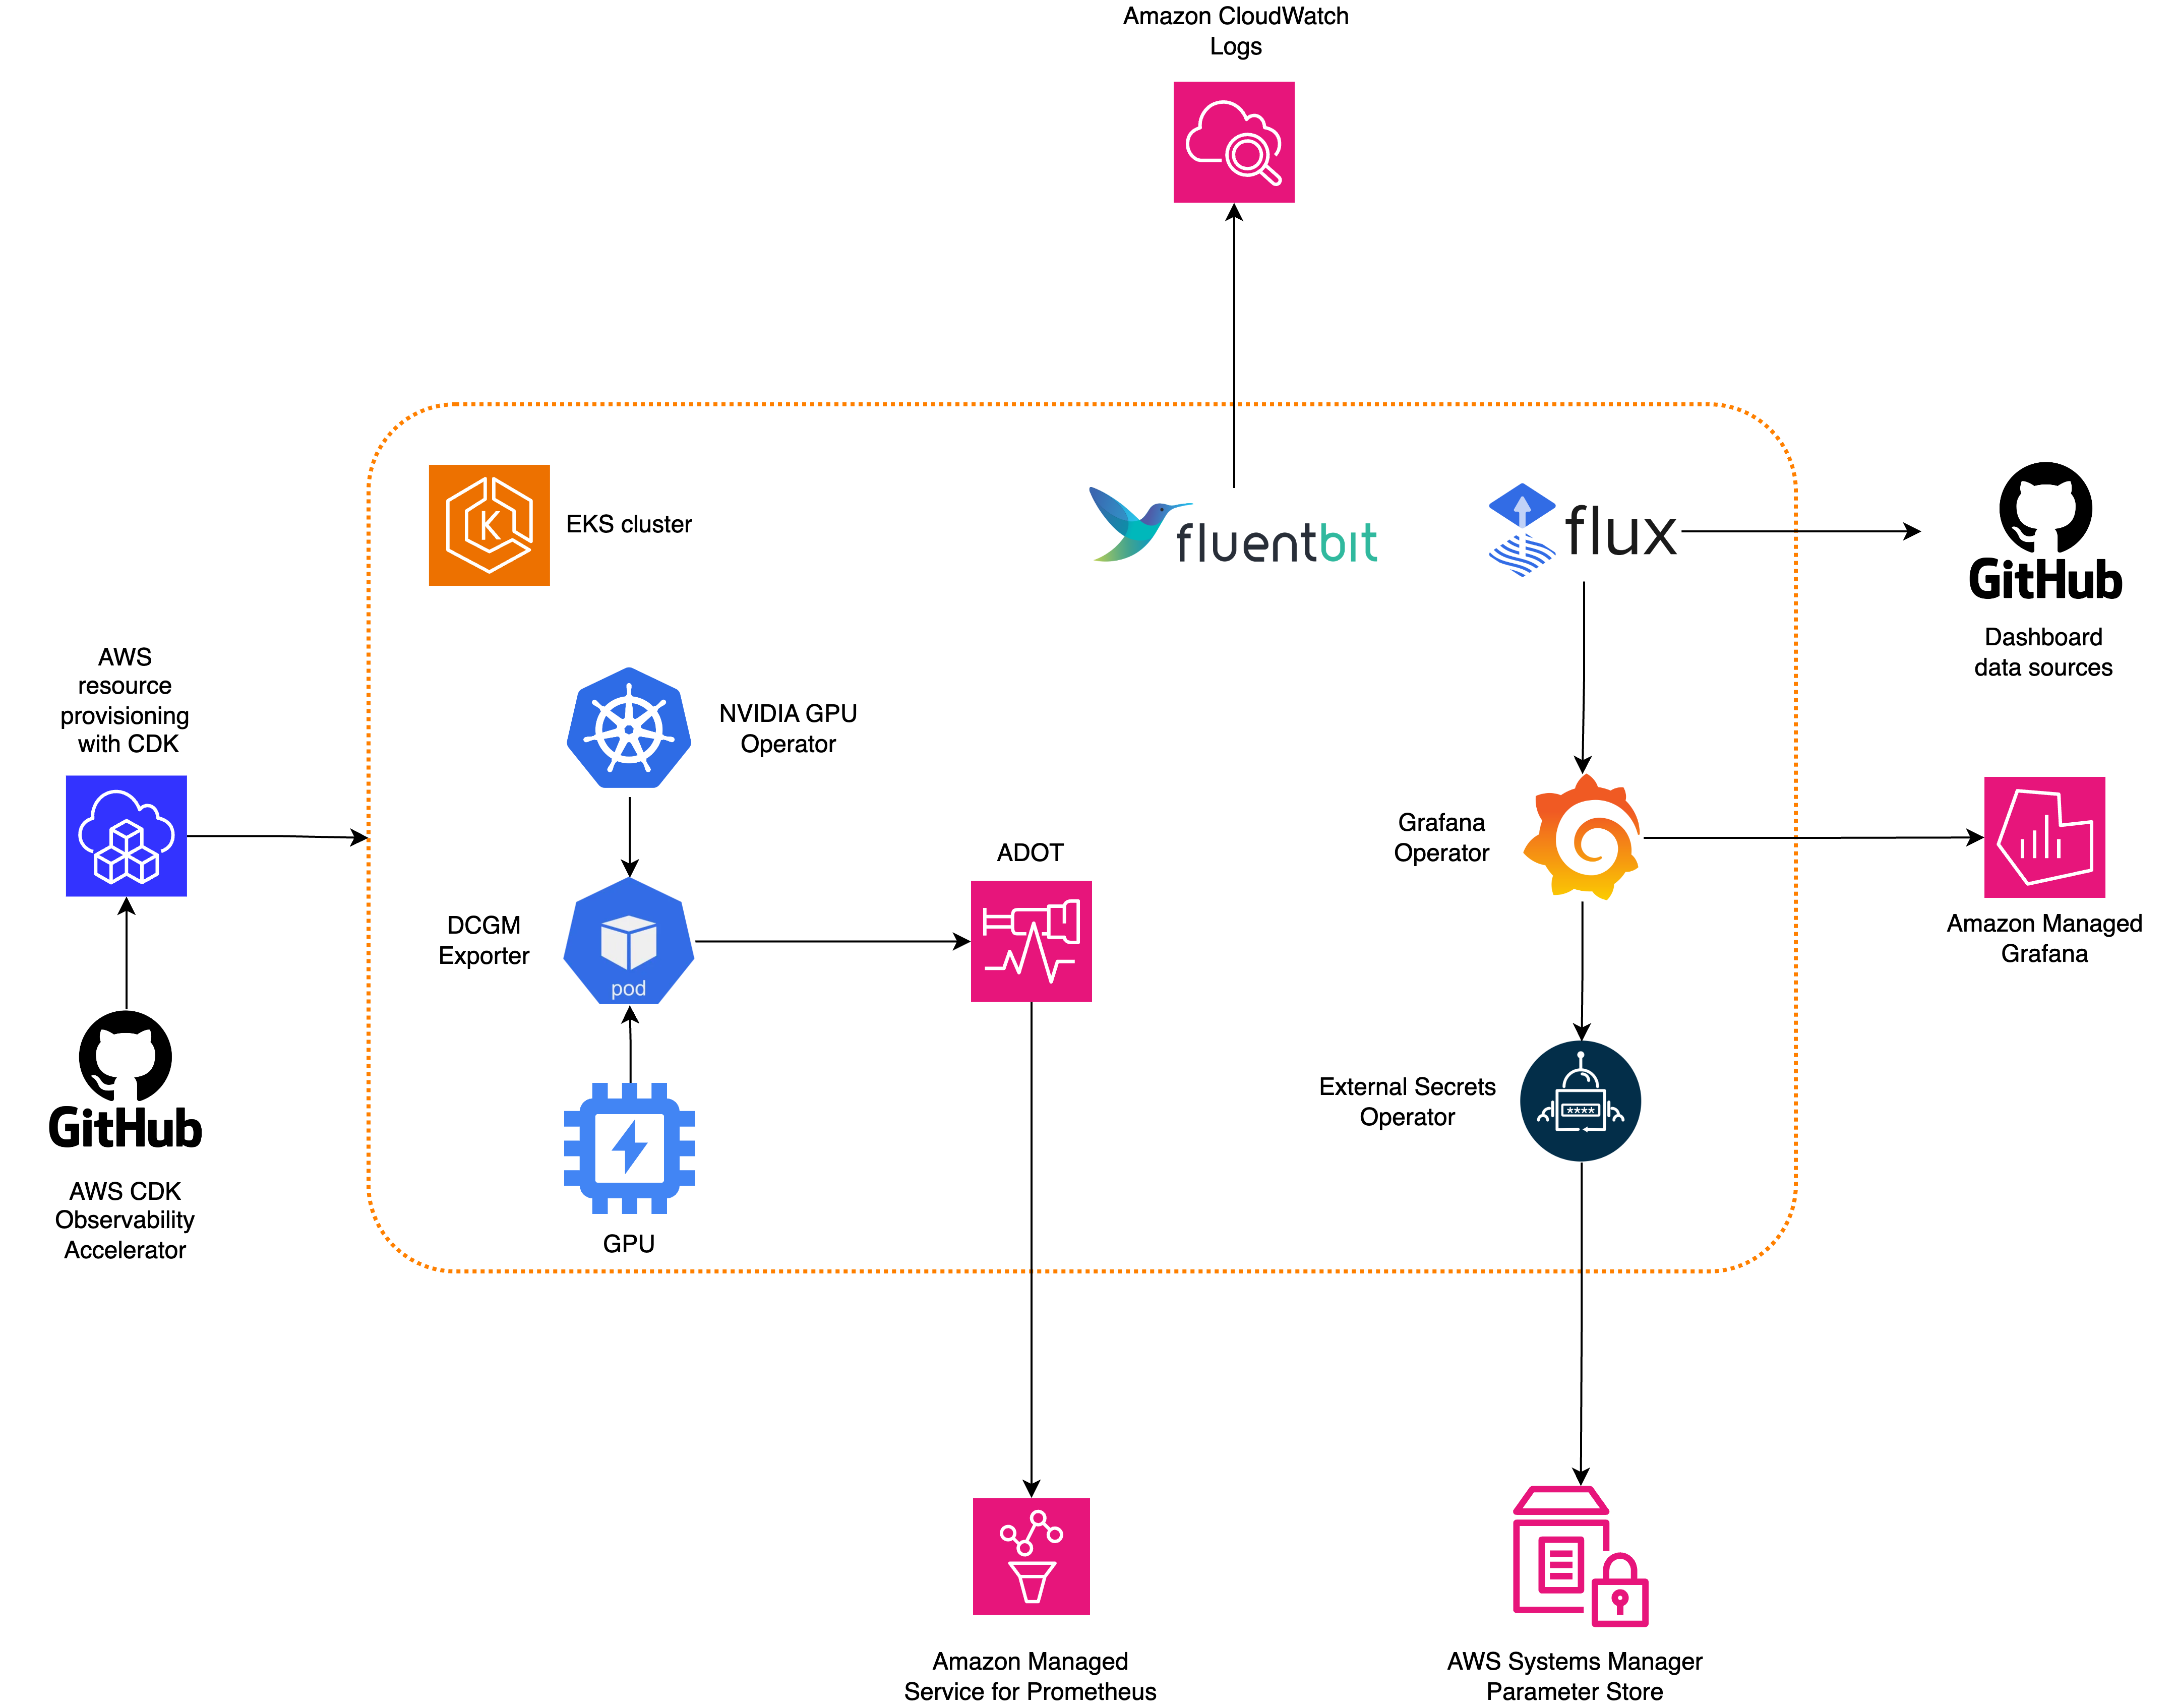
Figure 1: Architecture demonstrating Monitoring of GPU workloads on Amazon EKS using AWS managed open-source Services
Prerequisites
You will need the following to complete the steps in this post:
- AWS CLI version 2
- AWS CDK version 2.86.0 or later
- Homebrew to install required packages for macOS or Linux
- An existing Amazon Managed Grafana Workspace
- Node version 20.0.0 or later
- NPM version 10.0.0 or later
- Kubectl
- Git
- Make
Environment setup:
Next, let’s get the workspace id of any existing Amazon Managed Grafana workspace:
Next, let’s create a Grafana API key from Amazon Managed Grafana workspace and setup a secret in AWS Systems Manager. The secret will be accessed by the External Secrets add-on and made available as a native Kubernetes secret in the Amazon EKS cluster:
Bootstrap CDK
The first step to any CDK deployment is bootstrapping the environment. cdk bootstrap is a tool in the AWS CDK command-line interface (AWS CLI) responsible for preparing the environment (i.e., a combination of AWS account and AWS Region) with resources required by CDK to perform deployments into that environment. CDK bootstrapping is needed for each account/region combination, so if you already bootstrapped CDK in a region, you don’t need to repeat the bootstrapping process.
Execute the commands below to bootstrap the AWS environment in your region:
Deploy the open-source observability pattern
Clone the cdk-aws-observability-accelerator repository and install the dependency packages. This repository contains CDK v2 code written in TypeScript.
The settings for Grafana dashboard json files are expected to be specified in the CDK context. Generally, such settings are specified inside the cdk.context.json file of the current directory or in ~/.cdk.json in your home directory. You will need to update the context in cdk.json file located in cdk-aws-observability-accelerator directory. Please pay attention to gpuNodeGroup in the below to observe the instanceType used for GPU workloads along other with size definitions of the GPU nodes.
Settings for this deployment are:
Now, let’s run the below command to deploy the open-source observability pattern:
Once deployment completes, run update-kubeconfig command. You should be able to get the command from the CDK output message.
Validation
Validate the resources created by our deployment:

Figure 2: Resources deployed by the GPU Monitoring CDK Observability Accelerator Pattern.
Next, let’s verify that each node has allocatable GPUs:

Figure 3: Nodes having allocatable GPUs
nvidia-smi (also NVSMI) provides monitoring and management capabilities for each of NVIDIA’s devices from Fermi and higher architecture families. We can now deploy the nvidia-smi binary, which shows diagnostic information about all GPUs visible to the container:
Then request the logs from the Pod:

Figure 4: nvdia-smi logs from Amazon CloudWatch
Visualization – Grafana NVIDIA DCGM Exporter Dashboard
Login to your Amazon Managed Grafana workspace and navigate to the Dashboards panel. You should see a dashboard named NVIDIA DCGM Exporter Dashboard under the Observability Accelerator Dashboards folder. Grafana Operator and Flux always work together to synchronize your dashboards with Git. If you delete your Grafana dashboards by accident, they will be re-provisioned automatically.
To see some metrics in the dashboard, we need to generate some load. To accomplish that, we deploy a Pod with an image running dcgmproftester, a tool capable of generating deterministic CUDA workloads for reading and validating GPU metrics. The tool’s main parameters are: -t for generating load for a particular metric and -d for specifying the test duration. In our test, we set the metric to 1004, to generate a half-precision matrix-multiply-accumulate for the Tensor Cores, and we set the duration to 2 minutes.
Please run the following command from terminal:
To verify the Pod was successfully deployed, please run:

Figure 5: Screenshot showing load generation
After a few minutes, looking into the NVIDIA DCGM Exporter Dashboard, you should see the gathered metrics, similar to:

Figure 6: Amazon Managed Grafana workspace showing NVIDIA DCGM Exporter Dashboard

Figure 7: NVIDIA DCGM Exporter Dashboard with GPU SM Clocks and GPU Utilization metrics

Figure 8: NVIDIA DCGM Exporter Dashboard with GPU SM Clocks and GPU Utilization metrics
Looking at the graphs above, you can see that the curves span a 2 minutes time-frame, matching the -d 120 parameter we set earlier for dcgmproftester.
Clean up
You can teardown the whole CDK stack with the following command:
Conclusion
In this blog post, we showed you how to setup robust Observability for GPU workloads, deployed in an Amazon EKS cluster, running on Amazon EC2 instances, featuring NVIDIA GPUs. We described how the cluster is instrumented with NVIDIA GPU Operator add-on to deploy the software components, necessary to gather insightful GPU metrics. We explained the main operator’s components are DCGM and DCGM Exporter. We walked you through the deployment of the GPU Observability pattern and introduced the NVIDIA DCGM Exporter Dashboard. We are currently working on further patterns to capture telemetry from ML workloads running on other types of accelerated ML chips. We recommend that you try out all these patterns as we get these out and continue to support and contribute to our AWS CDK observability accelerator open source project.
For more information, see the following references:
- AWS Observability Best Practices Guide
- One Observability Workshop
- Terraform AWS Observability Accelerator
- CDK AWS Observability Accelerator
About the authors: