AWS Cloud Operations Blog
Monitoring the status of Windows services with Amazon CloudWatch
When you have an application that relies on a specific Windows service being up and running, knowing the status of this service can be a useful part of your observability solution. This service status data can be displayed on dashboards, used to create alarms, or used to trigger automated resolutions.
This post presents a solution for gathering this data from a Windows Amazon Elastic Compute Cloud (Amazon EC2) instance, utilizing a scheduled task to obtain regular heartbeat data on the service status, and sending this to Amazon CloudWatch. We’ll use this data to create a CloudWatch alarm to send an email notification when the service is not running.
We also share an AWS CloudFormation template which you can use to deploy the resources described in this post. Please note that the AWS CloudFormation template and resources created are not intended for production use, but merely as an example.
At the end of this post we’ll discuss some ideas for further work, and some other possibilities that may be useful for your situation.
Design Requirements
The solution for monitoring a Windows service status was expected to meet the following:
- Regular heartbeat signal
- Start/stop event signals cannot capture when the server is unable to send data to CloudWatch, so could miss a catastrophic failure.
- Regular heartbeats allow the current status to be known, and visualized.
- Easy to configure for many servers, and different services.
- Customer is not versed in writing code, but does have experience with PowerShell.
Solution Overview
Based on our design requirements, we chose the following solution:
Create the service status data on the Amazon EC2 instance.
- Create the required permissions.
- Create PowerShell scripts.
- Script 1: Captures the service status and write to a log file.
- Script 2: Creates a scheduled task to run script 1 on a regular basis.
- Use AWS Systems Manager to create the scheduled task on the desired Amazon EC2 instances.
Get the log data into CloudWatch.
- Install and configure the CloudWatch agent so the log file will be ingested into CloudWatch Logs.
Create a notification when the service is not running.
- Create CloudWatch Log Metric Filters to convert the log event into metric data.
- Create a CloudWatch alarm to send email notifications using Amazon Simple Notification Service (Amazon SNS).
We use AWS Systems Manager State Manager and Parameter Store to deploy our script and scheduled task to the Amazon EC2 instances so we can deploy to multiple servers at once, and don’t need to log onto the servers individually. Using State Manager also allows us to set a schedule to reapply our CloudWatch agent setup and scripts, allowing us to keep the CloudWatch agent up to date, and reapply the configuration and scripts in case they have been removed. If this is not desirable you can still use State Manager and not set a schedule.
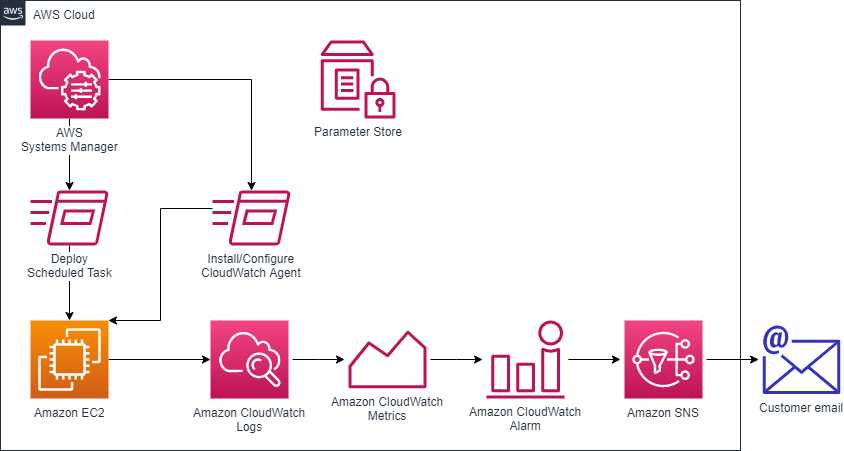
Figure 1: Architecture for collecting service status data, sending it to CloudWatch, and triggering an email notification when the service is not running.
Prerequisites
Systems Manager Agent: To use Systems Manager we need the Systems Manager Agent installed on the Amazon EC2 instances. In our case the Systems Manager agent was pre-installed. You can check the AWS documentation for the list of Amazon Machine Images (AMIs) with SSM Agent preinstalled, and if necessary install the agent: Working with SSM Agent on EC2 instances for Windows Server.
PowerShell version: The PowerShell scripts in this post were tested with PowerShell version 5.1.
If you’re following in your own account you should create a Windows Amazon EC2 instance which you can RDP into (to test as you go). As a reminder you can also use the CloudFormation template provided later in this document to create the EC2 and other resources described in the post.
1. Permissions
The Windows Amazon EC2 instances need to be granted the appropriate permissions. Create a role in AWS Identity and Access Management (IAM) console with the following AWS managed policies:
- AmazonSSMManagedInstanceCore
- Allow Systems Manager (SSM) to install/configure the CloudWatch agent.
- CloudWatchAgentServerPolicy
- Allow the CloudWatch agent to access the EC2 metadata, and write data to CloudWatch.
Attach this role to your Amazon EC2 instance(s).
More details are available in the AWS documentation on Create IAM roles and users for use with the CloudWatch agent and Attach an IAM role to an instance.
2. Create PowerShell Scripts
We create two PowerShell Scripts and deploy these to the server using Systems Manager State Manager, as shown in Figure 2:
- Script 1: Captures the service status and write to a log file.
- Script 2: Creates a scheduled task to run script 1 on a regular basis.
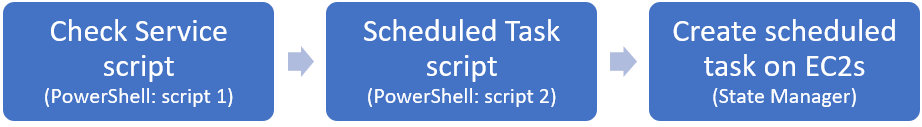
Figure 2: Block diagram showing the flow of creation and deployment of the PowerShell scripts.
Create script 1: check service and write log event
This script gets the current state of the specified service. The service name and state are written to a log file, along with the current timestamp and the Amazon EC2 instance id. The log event format is:
Example PowerShell script to check service status
$thisInstance = Get-EC2InstanceMetadata -Category InstanceId;
$Timestamp = (Get-Date).ToUniversalTime();
$myService = Get-Service -Name Spooler;
New-Item -ItemType Directory -Path "C:\temp" -Force
$ServiceName = ($myService.DisplayName).replace(' ','')
"$Timestamp $thisInstance $ServiceName $($myService.Status)" | Out-File "C:\temp\spooler-service-status.log" -Append -Encoding utf8;
In this script, we:
- find the instance id and current time (lines 1 & 2),
- find the Spooler service (line 3),
- create the directory we will write to, if it does not exist (line 4),
- strip any spaces from the service name (line 5),
- We’ll use this as a metric dimension, and these cannot contain spaces.
- write the log event to a file (line 6).
To monitor the status of a different service, modify lines 3 and 6 to reflect the new service name and log file name.
Testing
From your Amazon EC2 instance, save this file as C:\temp\checkservice.ps1 and test it by running .\checkservice.ps1 in a PowerShell window.
Remove the PowerShell file and log files after you finish testing so you have a clean slate for later tests.
Parameter Store
Create a parameter (of type string) in the Systems Manager console to save your service check script in. When we run script 2 using Systems Manager State Manager, we’ll get script 1 from Parameter store. For more details, see the AWS documentation on Creating Systems Manager parameters.
We called the parameter AmazonCloudWatch-CheckSpoolerService.
Create script 2: create scheduled task
We use a PowerShell script to create a scheduled task to specify how often to run script 1.
Example PowerShell script to create scheduled task
In this script, we:
- get script 1 from parameter store and save it as a file on the EC2 instance (line 1),
- specify the scheduled task name. If the scheduled task already exist, deletes it (lines 2-4),
- specify the configuration for the scheduled task (lines 5-8), including:
- the first time for the task to run (in 5 minutes time with
(Get-Date).AddMinutes(5)) (line 6), - the interval at which to re run script 1 (10 mins) (line 6).
- the first time for the task to run (in 5 minutes time with
- create the scheduled task using the configuration (line 9).
You can read the PowerShell documentation for more details on the ScheduledTasks cmdlet.
3. Use Systems Manager to create the scheduled task on the desired EC2 instances
We use Systems Manager to create the Scheduled task from the two PowerShell scripts. This allows us to deploy to multiple servers at once without needing us to log onto the servers.
Script 1 is already saved within Parameter Store.
We run Script 2 using Systems Manager State Manager.
Using State Manager also allows us to set a schedule to reapply our CloudWatch agent setup and scripts, allowing us to keep the CloudWatch agent up to date, and reapply the configuration and scripts in case they have been removed. If this is not desirable you can still use State Manager and not set a schedule.
Note: take care when copying and pasting values as this can result in pasting leading/trailing spaces which cause errors in the AWS Console.
- From the State Manager console, choose to Create association.
- Name: WindowsMonitorService
- Document: AWS-RunPowerShellScript
- Parameters: Paste script 2 into the Commands textbox.
- Target selection: Choose your servers – you can choose the instances manually, or by resource group or tags.
- Specify schedule: Rate schedule builder > Association runs every 30 minutes
- We have chosen a short time here so you can verify that your setup will reapply. It’s likely you will set a schedule in a low impact period, perhaps once a month over night, for which you might want to use the CRON/Rate expression setting.
You can leave everything else as default and choose to Create Association.
You will be returned to the State Manager Associations list – find the association (WindowsMonitorService) and wait until the status changes from Pending to Success.
Testing
From your Amazon EC2 instance, check the successful creation of the PowerShell file (C:\temp\checkservice.ps1) and the scheduled task (CheckSpoolerServiceRunning).
You can manually trigger the Scheduled Task and check that it populates the log file (C:\temp\spooler-service-status.log) with the service status event. Note: it may take a minute or two for the script to run and the event to be written to the log file.
4. Install and configure the CloudWatch agent
Figure 3 shows the workflow for installing and configuring the CloudWatch agent. We use the CloudWatch agent to ingest the log data into CloudWatch Logs. We need to install and configure the CloudWatch agent to ingest this log file. We can do both using Systems Manager State Manager. We also store the CloudWatch agent configuration in Parameter Store.
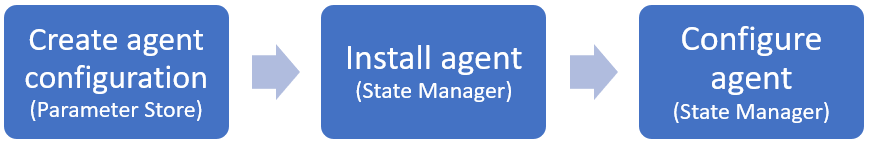
Figure 3: Block diagram showing the flow for installing and configuring the CloudWatch agent.
Create the CloudWatch agent configuration
The JSON configuration for the CloudWatch agent specifies the file to ingest data from (in file_path), the format of the timestamp, and the CloudWatch log group and log stream name that the log will be sent to. The last log stream name is a mandatory default.
Make sure the file path matches the log file created by script 1. Note the double backslashes in the file path.
For more details, read the AWS documentation on Manually create or edit the CloudWatch agent configuration file.
Example CloudWatch agent configuration
Store the CloudWatch Agent configuration in Systems Manager Parameter Store with the name AmazonCloudWatch-ConfigEC2WindowsServiceStatus (parameter type: string).
Install the CloudWatch agent
Install the CloudWatch agent by creating a State Manager Association with the following parameters:
- Name: WindowsMonitorServiceCloudwatchInstall
- Document: AWS-ConfigureAWSPackage
- Parameters:
- Action: Install
- Name: AmazonCloudWatchAgent
- Target selection: select the desired instances
- Specify schedule: Feel free to specify a short schedule to verify the setup reapplies. Otherwise feel free to choose No schedule.
You can leave everything else as default and choose to Create Association.
You will be returned to the State Manager Associations list – find the association (WindowsMonitorServiceCloudwatchInstall) and wait until the status changes from Pending to Success.
Configure the CloudWatch agent
Configure the CloudWatch agent by creating a State Manager Association with the following parameters:
- Name: WindowsMonitorServiceCloudwatchConfigure
- Document: AmazonCloudWatch-ManageAgent
- Parameters:
- Action: configure
- Mode: ec2
- Optional Configuration Source: ssm
- Optional Configuration Location: AmazonCloudWatch-ConfigEC2WindowsServiceStatus
- Optional Restart: yes
- Target selection: select the desired EC2 Windows Instances
- Specify schedule: Feel free to specify a short schedule to verify the setup reapplies. Otherwise feel free to choose No schedule.
You can leave everything else as default and choose to Create Association.
You will be returned to the State Manager Associations list – find the association (WindowsMonitorServiceCloudwatchConfigure) and wait until the status changes from Pending to Success.
The CloudWatch agent should now be running on your Amazon EC2 instances, ingesting any data sent to the log file at C:\temp\spooler-service-status.log into the CloudWatch log Group called Test/Windows/ServiceStatus.
For more details, read the AWS documentation on Installing the CloudWatch agent using AWS Systems Manager.
Test: check the logs are ingesting
If the scheduled task is running, you should have data in CloudWatch Logs.
Navigate to the CloudWatch console and choose Logs > Log groups from the left menu.
Find the log group and log stream you specified in the CloudWatch configuration file:
- Log group: Test/Windows/ServiceStatus
- Log stream: Test
Note: your log group and stream will only be created once the first event has been ingested.
Figure 4 shows an example of the log events you will see. Note that I have manually stopped the Print Spooler service to ensure I can see both service status values.
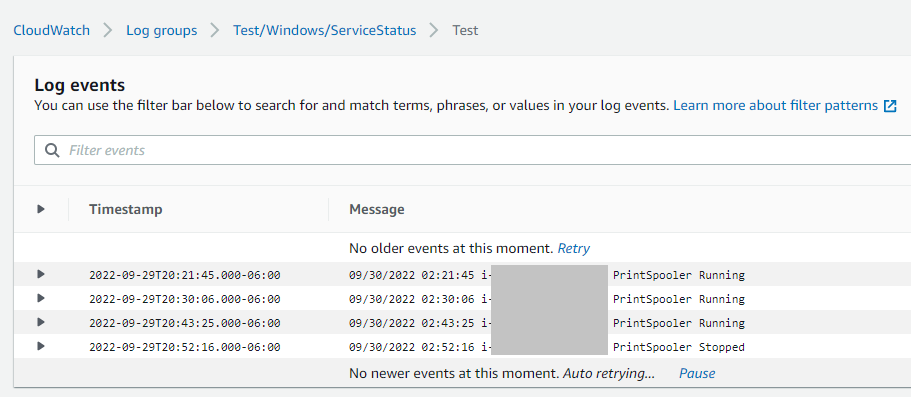
Figure 4: CloudWatch console showing the ingested log events in the CloudWatch Log group.
5. Create Metric Filters
We create CloudWatch alarms from metric data. So, we need to convert the CloudWatch Log events into CloudWatch metric data using metric filters. You create metric filter on a log group.
When we create a metric filter we specify a match to pattern. When a log event matches this pattern, the desired metric is created with the specified value.
A reminder of the format of our log events:
The event is space-delimited, so we can extract the fields with the following filter pattern:
We decided to create 2 metric filters to set the value of a single metric (called IsRunning).:
- any event with Running status – create a metric value of 1,
- any event with any other status – create a metric value of 0.
If there is no data in the metric, then our service status is unknown.
We add the condition to the filter pattern. For capturing events with a status of Running:
And to capture any other status:
In the CloudWatch console, navigate to the Log groups, and select the log group (Test/Windows/ServiceStatus). Under the Metric filters tab, choose to Create metric filter, and set the Filter pattern.
Note: As you create a metric filter you can test your pattern on real data in the Test pattern section. Use the Select log data to test drop down to choose the log stream to test the filter on (Test) and then choose to Test pattern. You will see a table with the matched events and the field value – see Figure 5.
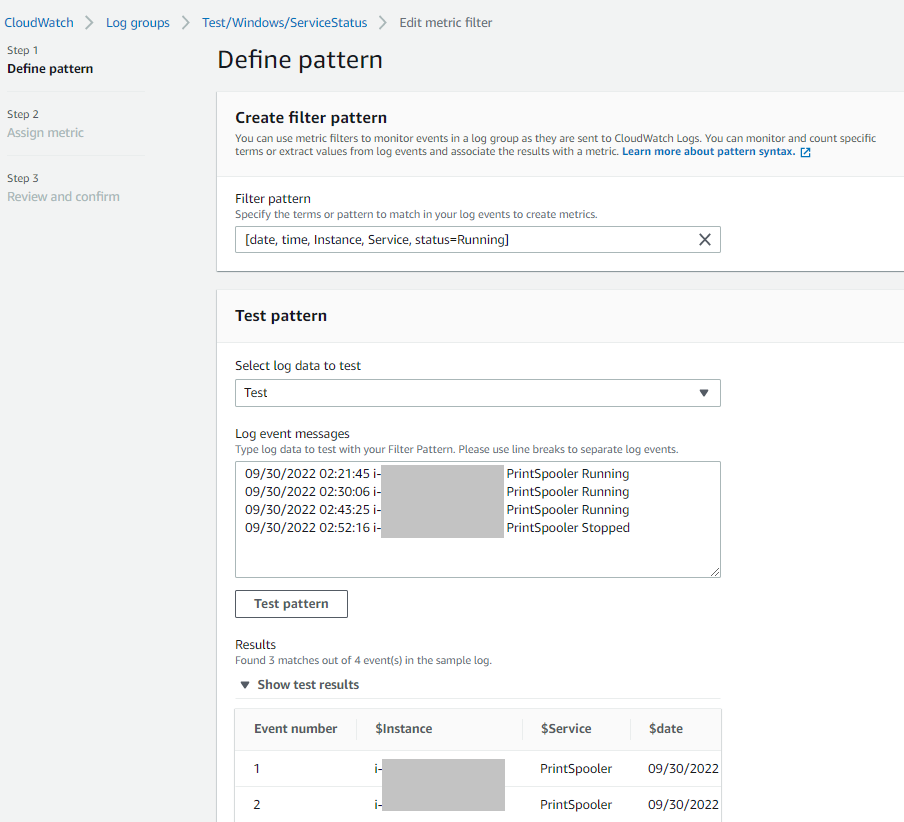
Figure 5: CloudWatch Console showing the testing of a Metric filter with data from the log group.
Move to the next screen and set the following:
- Filter name: ServiceStatus-Running
- Metric namespace: ServiceStatus
- Metric name: IsRunning
- Metric value: 1
- Dimensions
- Dimension Name: Instance; Dimension Value: $Instance
- Dimension Name: Service; Dimension Value: $Service
Using $Instance and $Service in the dimension values allows the field value to come from the data in the log event. This makes this a general metric filter for any instance and service.
Leave everything else as default and create the metric filter.
Similarly, create a metric filter to capture any event which has a status that is NOT Running. Recall that we are creating a single metric (called IsRunning), which will have different values depending on the service status, so leave the Metric name as IsRunning.
- Filter pattern: [date, time, Instance, Service, status!=Running]
- Filter name: ServiceStatus-NotRunning
- Metric namespace: ServiceStatus
- Metric name: IsRunning
- Metric value: 0
- Dimensions
- Dimension Name: Instance; Dimension Value: $Instance
- Dimension Name: Service; Dimension Value: $Service
Leave everything else as default and create the metric filter.
We have both metric filters adding data to the same metric (same namespace and dimensions), just with a different value. Every time the scheduled task runs, and creates a log event, the metric filters will create a metric with a value of 1 (running), or 0 (not running). If there is no metric data this is an indication that the scheduled task is not running on that instance for some reason, for example the instance itself is not running.
For more details, read the AWS documentation for Creating metrics from log events using filters and for Using metric filters to extract values from space-delimited log events.
Testing
Check if the metrics are being created from our log events: navigate to the CloudWatch console and choose Metrics > All metrics from the left menu. Choose the Custom namespace of ServiceStatus, and then dimensions of Instance, Service. You should have one entry for each Instance and Service you’re ingesting data for.
Note that metric filters only create metrics when a new log event is ingested, so you will need to wait for a new log event before there are any metrics.
Check the box beside the metric of interest to plot it on the chart. Figure 6 shows the selection of a metric and the chart. Here there is a change in the value between 1 to 0 where I stopped the Print Spooler service to test the metric filters.
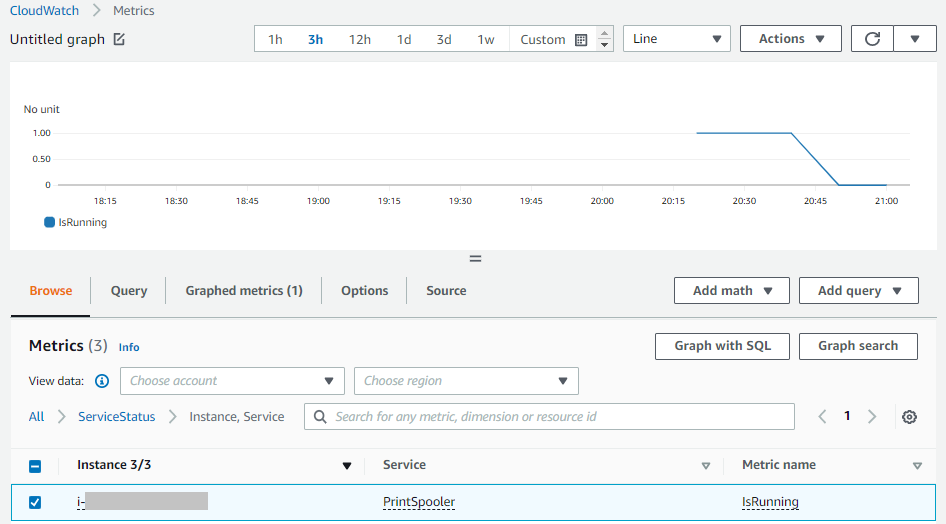
Figure 6: CloudWatch console showing the Metrics created for the service status.
6. Create a CloudWatch Alarm
Now we have the data as a metric we can create a CloudWatch alarm and an email notification.
From the CloudWatch console, choose Alarms > All Alarms > Create alarm.
Choose to Select metric and browse to the metric (as before: namespace of ServiceStatus, then dimensions of Instance, Service). Select the metric for one of the instances/services and choose to Select metric.
Choose the following settings for the alarm:
- Statistic: Average
- Period: 10 mins (by setting a custom period of 600 seconds)
- Conditions
- Threshold type: Static
- Whenever IsRunning is…: Lower (< threshold)
- than…: 1
- Additional Configuration
- Missing data treatment: Treat missing data as bad (breaching alarm)
- This will give a state of In alarm when no data is being sent, i.e. server is down.
- Missing data treatment: Treat missing data as bad (breaching alarm)
Choose Next and then for the actions:
- Notification
- Alarm state trigger: In alarm
- Select an existing Amazon SNS topic, or Create new topic as is appropriate.
- Alarm name: Print Spooler status — not running or unknown
- This will be the subject of the email, so use a name that is meaningful to your situation.
- Alarm description: this will appear in the email notification, so include relevant information for your audience.
Review your settings and chose to Create alarm.
For more details, read the AWS documentation on Using Amazon CloudWatch alarms.
Testing
Before testing your CloudWatch alarm, make should you have confirmed your subscription to the Amazon SNS topic – all emails on the SNS topic will have been sent an email.
Test your CloudWatch alarm and email notification by connecting to your Amazon EC2 and stopping the service. Once the next scheduled task has run, this will give a metric value of 0 (<1) and your alarm will change to In alarm state and trigger an email notification.
You may wish to check you get an alarm when the Amazon EC2 instance is stopped. Note that notification only get triggered when the alarm changes state, so restart your service first to put the alarm in an ok state before testing it for the case of the Amazon EC2 instance being stopped.
CloudFormation template
The resources created in the steps above are available for you to download as a CloudFormation template. Please note that the CloudFormation template and resources created are not intended for production use, but merely as an example.
We won’t go through how to create this template here, but you can explore the AWS documentation on CloudFormation if you’re interested in learning more.
You can work through the steps described below to create the resources yourself, deploy the template in your own account and let it create the resources, or use the template as an example of Infrastructure as code for these resources.
If you want to RDP onto the instance created through the CloudFormation you can RDP using Fleet Manager (within AWS Systems Manager).
Note that we leave you to update the CloudWatch alarm with the notification actions to avoid unnecessary initial noise when no data is available for the service status checks.
- Download the yaml file.
- Navigate to the CloudFormation console in your AWS Account.
- Choose Create stack.
- Choose Template is ready, Upload a template file, and navigate to the yaml file you just downloaded.
- Choose Next.
- Give the stack a name.
- Under Parameters choose:
- A KeyPair which you can use to RDP into your EC2 instance to explore what has been created and test the various steps. Create a key pair if you do not have one.
- The VPC and Subnet to deploy the Windows EC2 instance into.
- The LatestAmazonWindowsAmiId should be populated for you, with the latest Windows Server 2022 instance for you to use
- Choose Next.
- Add tags if desired, and Next.
- Scroll to Capabilities at the bottom of the screen, and check the box I acknowledge that AWS CloudFormation might create IAM resources with custom names, and Create stack.
- Wait for the stack creation to complete.
The Resources tab will show you what has been created. The resources in the CloudFormation template have names consistent with the steps in this post.
Note that the State Manager Associations will run as soon as they are created, and as a result some may fail as there are dependencies on other resources which are not ready, for example the CloudWatch installation needs to happen before the configuration.
Before you can continue you need to wait for the EC2 instance to register with Systems Manager. You can check this in the console in Systems Manager > Fleet Manager. Once the EC2 instance is visible in the list of managed nodes this means it has successfully registered with Systems Manager. You can now apply the State Manager Associations these in the order shown below. The association name is shown in brackets. Wait until each one completes successfully before moving on.
- Create Scheduled task on the EC2 instance (WindowsMonitorService)
- Install CloudWatch agent (WindowsMonitorServiceCloudwatchInstall)
- Configure CloudWatch agent (WindowsMonitorServiceCloudwatchConfigure)
To control the order of these operations you create single composite document with multiple steps. For more details see the AWS documentation on Creating composite documents. Download an example of a composite document for the steps in this post.
What next?
Here are some ideas of other things you might wish to enhance this solution with.
Visualize your data: Now you have both log and metric data, you can visualize this in CloudWatch dashboards, adding widgets like those shown in Figure 7. Here we have widgets to display the history of the service status, the current status, the alarm status, and a text widget giving some context to the data.
You can explore more on CloudWatch dashboard and how to create your own widgets in the AWS documentation on Using Amazon CloudWatch dashboards.
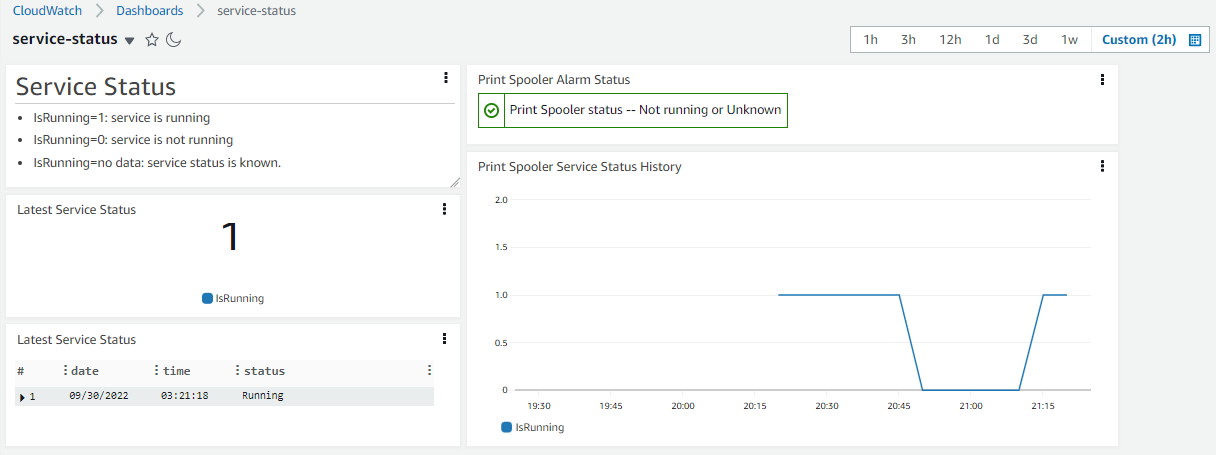
Figure 7: CloudWatch dashboard showing some of the options available for displaying the service status data.
Control your log storage: Whilst the log events generated are small, this will build up over time. Set an appropriate retention on the log group. This will reduce the storage load on your Amazon EC2 instance, and reduce your CloudWatch log storage costs. You may also wish to implement log rollover on your Amazon EC2 instances and delete old log files.
Add additional dimensions: Consider what meta data is important to you, and add it to your log event and the dimensions in your metric filter. Data like the environment the instance is in (e.g. qa, dev, prod), or the main application or workflow this instance belongs to etc. Adding a few extra key dimensions can enable you to use your solution more widely across multiple servers, environments, applications, without too much additional work.
Automate your actions: Are there actions you always need to take when the service stops? Instead of only sending an email notification, you could automate your actions. Directly from your alarm you have options beyond notifications, such as Amazon EC2 actions to reboot an instance, auto-scaling actions, and Systems Manager actions. If this doesn’t meet your needs, then you can use Amazon EventBridge to capture the Alarm event, and trigger other services, such as AWS Lambda, to carry out custom actions.
Further automate your deployment: Another step in simplifying your enterprise use would be to create a Systems Manager Automation Document. This could be a single document which completes all the steps required on your Amazon EC2 instance – CloudWatch agent install, configuration, and setup the scheduled task and PowerShell service check script.
Take some time to think about what is useful to you, what process it needs to fit into, and how you might wish to use this longer term.
Other approaches
As with most things technology related, there is more than one way to solve a problem. Here we briefly discuss some of the other options so you can make the best decision for you.
Use Windows Event Logs
You could choose to remove the task of creating the logs yourself and ingest the Windows Events from the system log. The CloudWatch agent can be set to ingest these events. This would remove the need for the two PowerShell script.
There are two reasons this approach wasn’t used here. Firstly, whilst you can configure which log to ingest (system) and which log level (INFORMATION), you cannot specify further granularity, so the volume of logs ingested (and therefore the cost) is hard to estimate. More importantly, this event log records a change in state (service has stopped, service has started) rather than a regular heartbeat approach. This is undesirable here as no data could either mean no state change, or could mean there is a problem with the data being generated on ingested.
If you’re interested in this approach you can use the windows_events section in the CloudWatch Agent configuration file. You can find more details in the AWS documentation at Manually create or edit the CloudWatch agent configuration file.
Write the log event using Embedded Metric Format
If you write your log events in the JSON Embedded Metric Format, then when the logs are ingested, CloudWatch automatically extracts the details for the metric and creates it. This removed the need to create metric filters, and you can still query the log data.
The creation of the JSON format is more involved, but there are client libraries available to support this. There is currently no library to support this with PowerShell, so it was decided the overhead in creation, and updating was too high.
Use AWS Lambda function to get the service status
You could avoid the creation and push of log events from the Amazon EC2 instances, to a pull model where a scheduled AWS Lambda function could request the service status from the instances. The Lambda function could then use the PutMetrics API to send the information straight to CloudWatch metrics. This approach only needs a Lambda function, a CloudWatch alarm, and the Amazon SNS topic. With a Lambda function you have flexibility in your choice of language to code in. This solution may be easier to maintain for your needs.
One way to get the data would be through Systems Manager. For example, if you’re writing your Lambda function in Python you might want to the boto3 ssm list_inventory_entries method. This lets you specify the instance id, a type of AWS:Service, and a filter with the name of the service you need the status for.
The main reason for not choosing this route was the requirement to keep the coding skills low and focus on PowerShell.
Cleanup
To avoid unnecessary charges you should remove the following resources:
- Delete the CloudFormation Stack if you used it.
If you created any resources manually, delete these:
- Any Amazon EC2 instances you used for testing.
- If you are keeping the Amazon EC2 instances:
- remove the scheduled task, and the PowerShell script and log files from the instance.
- Scheduled Task Name: CheckSpoolerServiceRunning
- PowerShell script: C:\temp\checkservice.ps1
- Log files: C:\temp\spooler-service-status.log
- Uninstall the CloudWatch Agent
- You can use the same Systems Manager State Manager association as we used to install the agent (AWS-ConfigureAWSPackage) and choose an Action of Uninstall and a Name of AmazonCloudWatchAgent.
- remove the scheduled task, and the PowerShell script and log files from the instance.
- Delete the log group: Test/Windows/ServiceStatus
- This will also remove the metric filters
- Delete the SNS topic.
- Delete the parameters from Systems Manager Parameter store
- PowerShell script to check service: AmazonCloudWatch-CheckSpoolerService
- CloudWatch configuration: AmazonCloudWatch-ConfigEC2WindowsServiceStatus
- Delete State Manager Associations
- WindowsMonitorService
- WindowsMonitorServiceCloudwatchInstall
- WindowsMonitorServiceCloudwatchConfigure
You cannot delete metrics, but there is no charge for metric storage, only ingestion.
Conclusion
In this post we have presented a solution for gathering data on Windows service status and using this to notify us when the service is not running. We have suggested some ways you may wish to build on this approach. Finally we explored other ways you may choose to implement this solution, depending on your requirements and resources
About the author: