AWS Cloud Operations Blog
Optimize Log Collection with Amazon CloudWatch Agent Log Filter Expressions
The Amazon CloudWatch agent is a software package that autonomously and continuously runs on your servers. You can install and configure the CloudWatch agent to collect system and application logs from Amazon Elastic Compute Cloud (EC2), on-premises hosts, and containerized applications. The logs collected by the CloudWatch agent are processed and stored in Amazon CloudWatch, which further helps with the performance and health monitoring of your infrastructure and applications.
Previously, the CloudWatch agent pushed all of the log lines from the configured log file to CloudWatch. Although this is ideal for many use cases, customers wanted a way to filter these log lines at the host to selectively include only specific log lines, or to exclude unwanted log lines or a combination of both.
In this post, we provide a brief overview of use cases for CloudWatch agent log filter expressions and walk through how to install and begin configuring the agent.
Overview
CloudWatch agent has added support for configurable log filter expressions. This new configuration option is intended for users who want to collect only log events that meet specified criteria.
Using this new functionality of the CloudWatch agent, you can specify “include” and “exclude” regular expressions for each log stream in the agent configuration file. This will cause the agent to evaluate each log event against the expressions to determine whether the log event should be sent to CloudWatch. Log events not sent to CloudWatch are discarded by the agent. Log filters help you to manage your log ingestion by processing only log events that meet the specified criteria, such as those that contain error codes or by eliminating verbose log events.
Installing CloudWatch Agent
The agent can be installed on Linux, Windows, and other supported operating systems by downloading the agent package from Amazon Simple Storage Service (Amazon S3), using AWS Systems Manager, AWS CloudFormation, or by installing it manually using the command line.
With the agent in the Amazon Linux 2 repository, the agent package can be installed on Linux hosts in a single step using the yum package manager:
On Windows Server systems, installation can be conducted by downloading the agent installer from Amazon S3 and running the installer:
Access to AWS resources requires permissions. Before starting the CloudWatch Agent, we must grant permissions that the agent needs to write metrics and logs to CloudWatch. Step-by-step instructions for installing the agent and granting permissions can be found in the Amazon CloudWatch Users Guide.
Getting started with configuring the agent
The agent configuration file is a JSON file that specifies the metrics and logs that the agent must collect. You can create it by using the wizard or by creating it yourself from scratch. You could also use the wizard to initially create the configuration file, and then modify it manually.
For the sake of this post, you can create or edit the CloudWatch agent configuration file manually. For simplicity in troubleshooting, we recommend that you name it /opt/aws/amazon-cloudwatch-agent/etc/amazon-cloudwatch-agent.json on a Linux server,and $Env:ProgramData\Amazon\AmazonCloudWatchAgent\amazon-cloudwatch-agent.json on servers running Windows Server.
You can use the following configuration document as the agent configuration file. Furthermore, you can copy it to other servers where you want to run the agent. If you plan to use the SSM Agent to install and configure the CloudWatch agent on the other servers, then after you manually edit the CloudWatch agent configuration file, you can upload it to Systems Manager Parameter Store.
Any time that you change the agent configuration file, you must restart the agent to have the changes take effect. To restart the agent, follow the instructions in Start the CloudWatch agent.
On an Amazon EC2 instance running Linux, enter the following command:
On an Amazon EC2 instance running Windows Server, enter the following from the PowerShell console:
Understanding the agent configuration file
The following excerpt of the CloudWatch agent configuration file will signal the CloudWatch agent to publish user activity log lines only from the ‘audit.log’ file.
The following are a few sample audit logs from an Amazon EC2 instance:
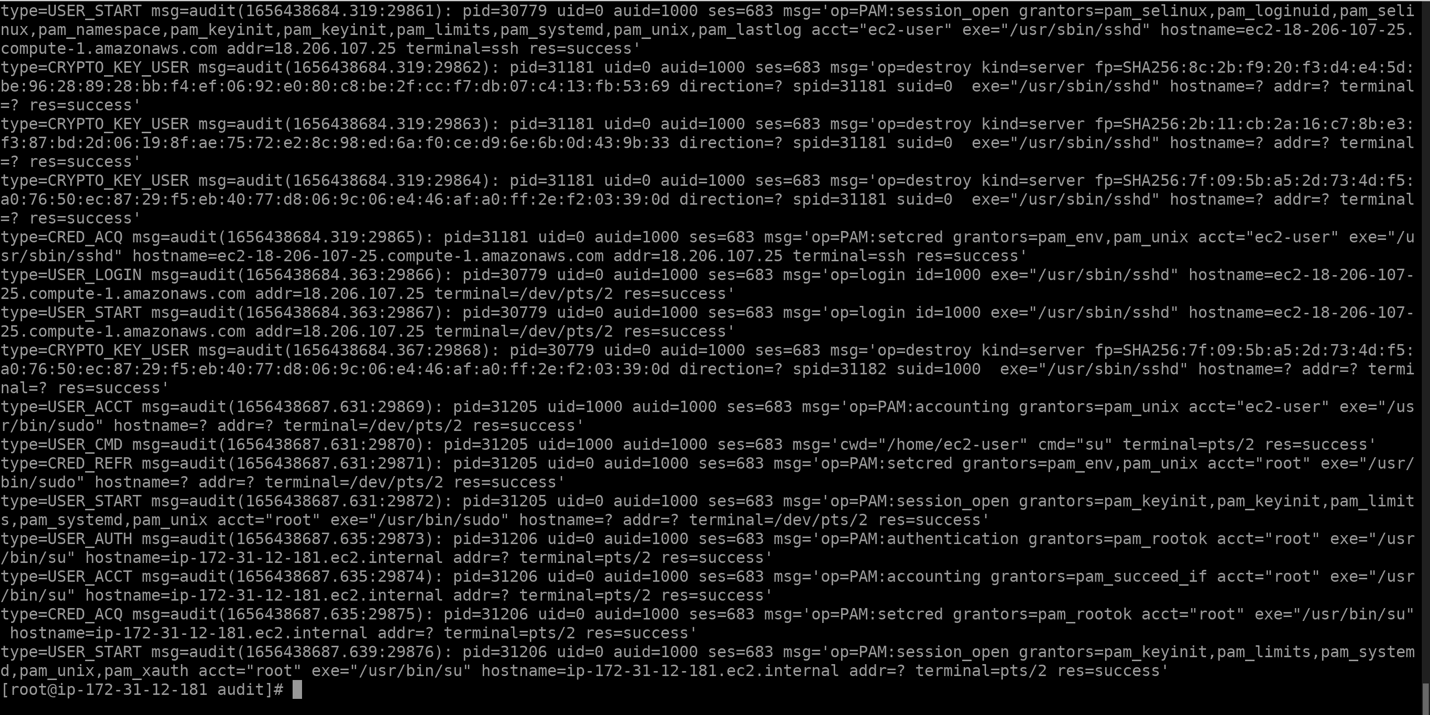
Figure 1: Amazon EC2 instance Audit logs
The ‘auditlogs’ log group is created as a result of the agent configuration. The log group has all of the log lines that contain the string ‘USER_’.
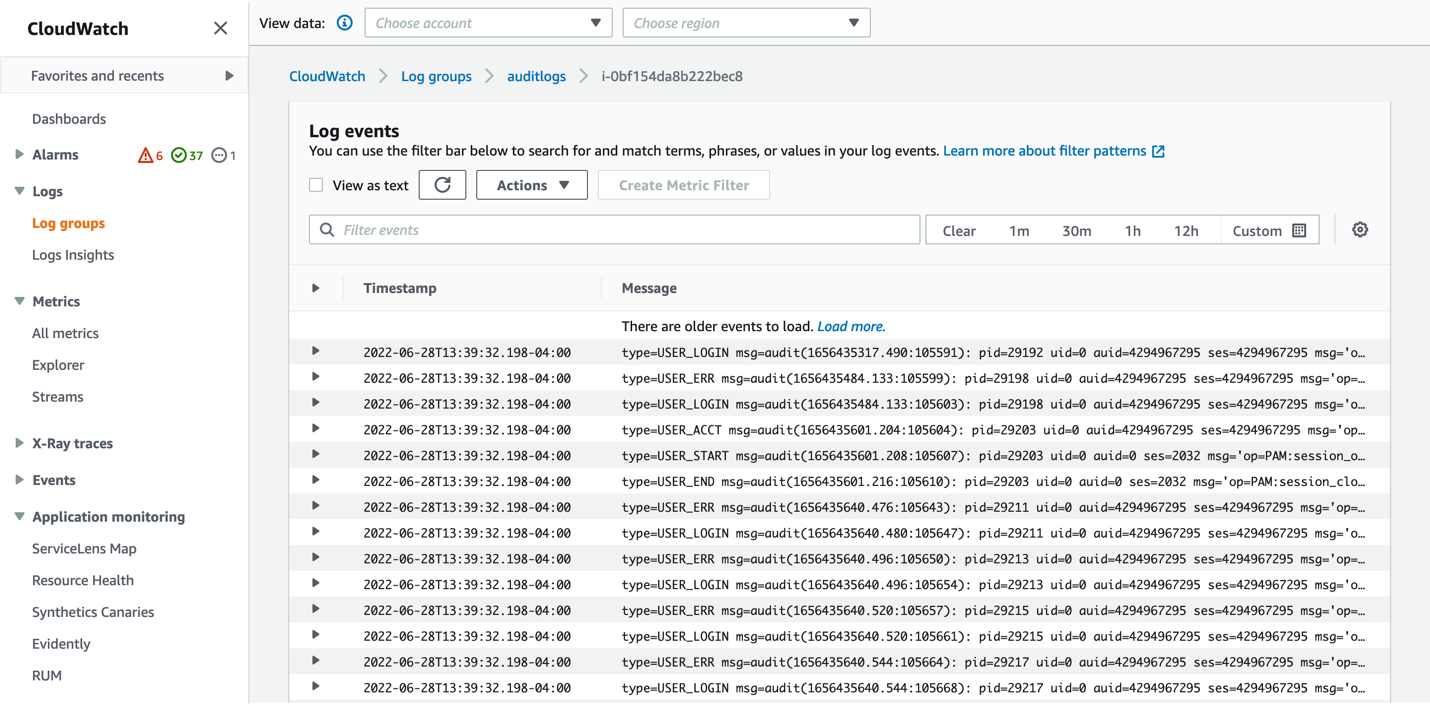
Figure 2: auditlogs Log Group
The following excerpt of the CloudWatch agent configuration file will signal the CloudWatch agent to discard all of the log lines except the ones that contain the string ‘systemd:’. Moreover, it filters these log lines to exclude the ones that contain the string ‘Message Of The Day’ before publishing them to CloudWatch.
The order of the filters in the configuration file matters for performance. In the following example, the agent drops all of the logs that don’t contain ‘systemd:’ before it starts evaluating the second filter. To cause fewer log entries to be evaluated by more than one filter, put the filter that you expect to rule out more logs first in the configuration file.
The following are a few sample system logs from an Amazon EC2 instance. This log file contains a mix of log lines that include dhclient, systemd, ec2net, etc. logs.
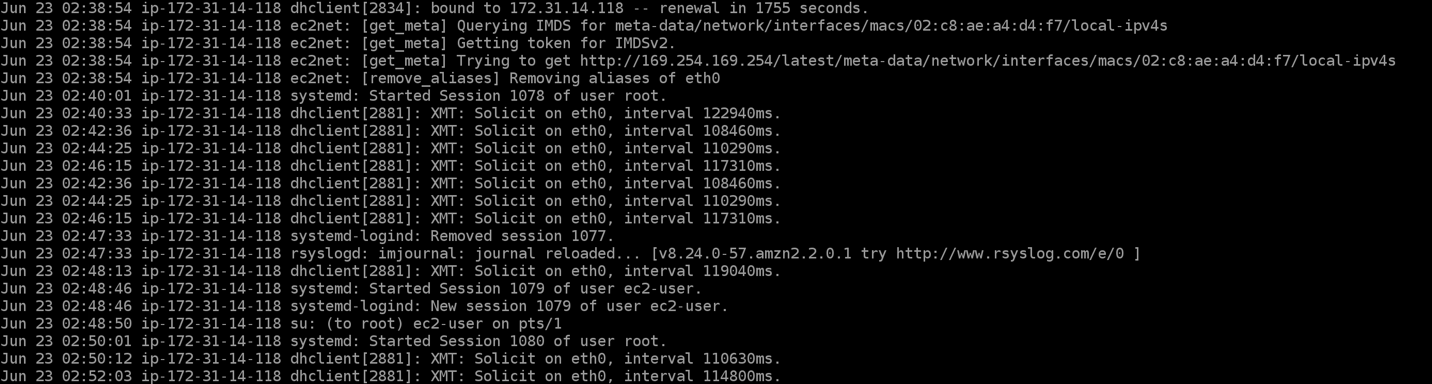
Figure 3: Amazon EC2 instance System logs
The ‘syslogs’ log group is created as a result of the agent configuration. The log group has all of the log lines that only contain the string ‘systemd:‘ in them. The log lines that contain the string ’Message Of The Day‘ are excluded.
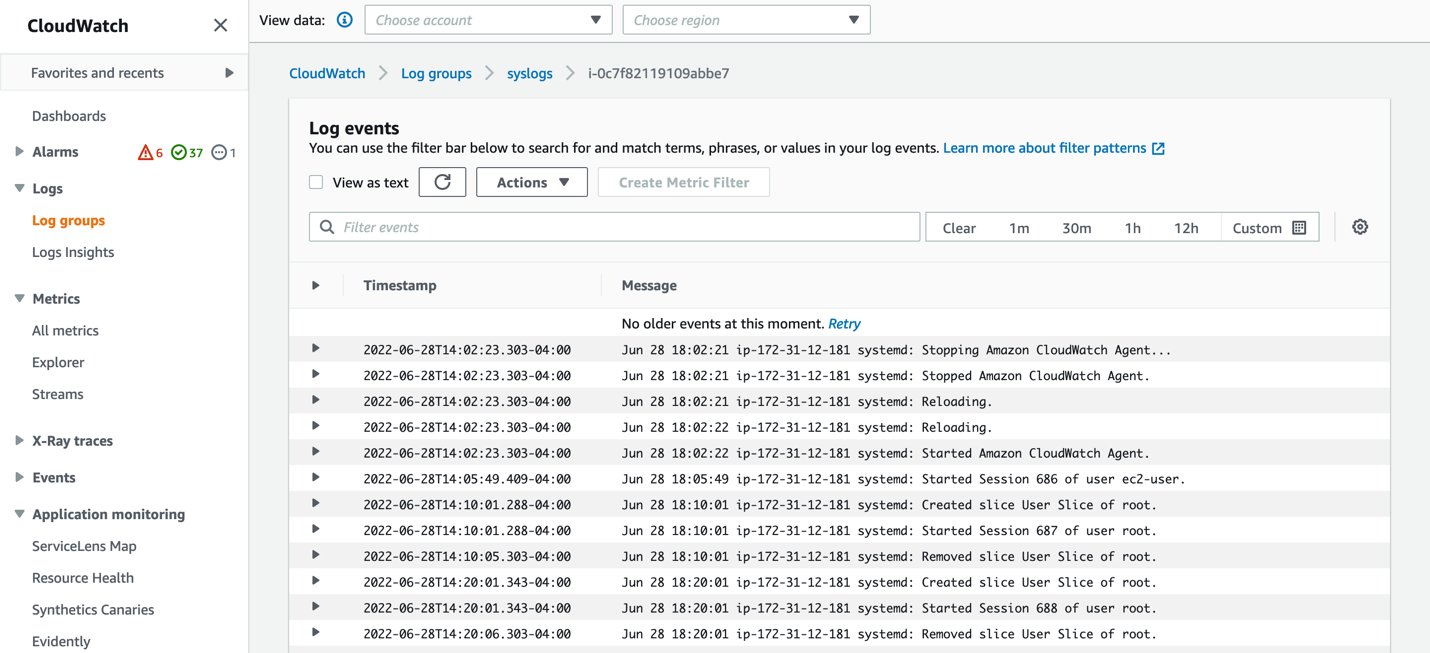
Figure 4: syslogs Log Group
In case you want to publish all of the log lines from the system logs file (var/log/messages), but also want to filter the noise caused by ‘ec2net:’ & ‘dhclient:’ log lines, append the following configuration extract to your agent configuration file:
Similarly, if you have HTTP access logs in the instance, and if you only want to filter and send the log lines for requests that have resulted in 4xx and 5xx response codes to CloudWatch, then the following excerpt of the CloudWatch agent configuration will help you achieve that.
These are sample HTTP access logs from an Amazon EC2 instance. The access logs contain requests that have various HTTP response codes.
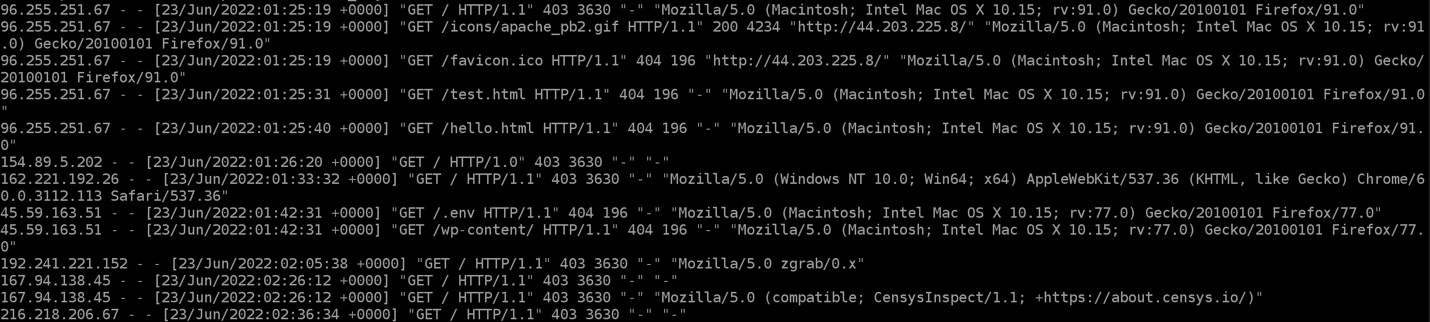
Figure 5: Amazon EC2 instance Access logs.
The CloudWatch log group will only receive log lines that have 4xx or 5xx response codes.
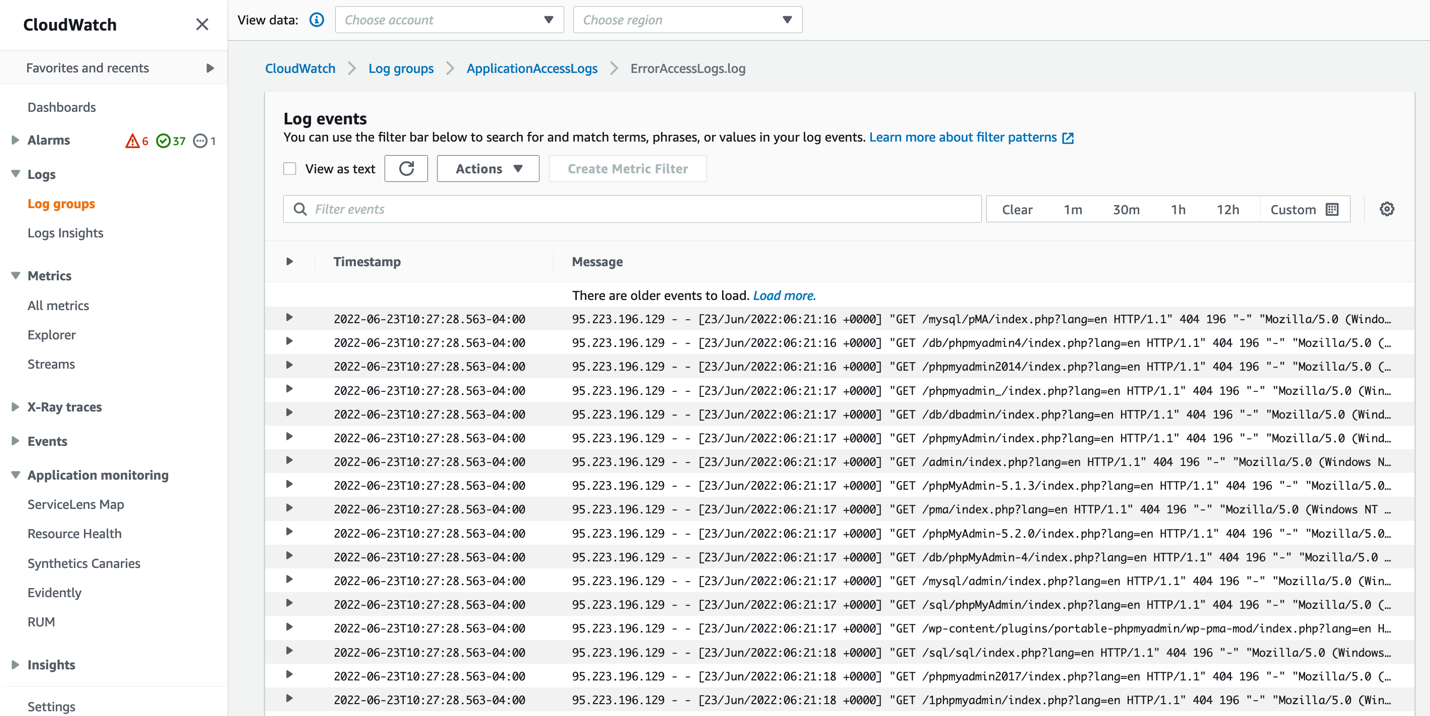
Figure 6: ApplicationAccessLogs Log Group.
Conclusion
This brief introduction to CloudWatch Agent’s configurable log filter expressions provides a starting point for more advanced and customized configurations. A complete description of the feature is available in the CloudWatch Users Guide.
Utilizing this feature, you can streamline your system and application logs published to CloudWatch, thereby enhancing your ability to effectively monitor the health and performance of your servers and applications running on them.
Reference documentation
https://docs.aws.amazon.com/AmazonCloudWatch/latest/monitoring/Install-CloudWatch-Agent.html
https://docs.aws.amazon.com/AmazonCloudWatch/latest/monitoring/Install-CloudWatch-Agent-New-Instances-CloudFormation.html
https://docs.aws.amazon.com/AmazonCloudWatch/latest/monitoring/troubleshooting-CloudWatch-Agent.html
Abouth the authors: