AWS Cloud Operations Blog
Use AWS Systems Manager Explorer to optimize your compute resources across your AWS Organizations
As a solutions architect with AWS, I work with customers to right-size their Amazon Elastic Compute Cloud (EC2) instances to achieve a balance between performance and cost.
Optimization is an iterative task that involves several cycles of making changes, analyzing results, and repeating until you reach a satisfactory state. You need to understand the details of your workload, specifically how it consumes server resources such as CPU, memory, disk I/O, and network bandwidth. After you understand the resource requirements, you make changes and repeat until you reach a satisfactory price and performance point. Iterations can be time-consuming and, if you accidentally under provision a critical resource or require frequent maintenance windows to make server changes, you negatively impact users.
Use machine learning to optimize
AWS Compute Optimizer helps reduce the complexity of this activity. The service uses machine learning to analyze historical utilization metrics. By applying the knowledge drawn from Amazon’s own experience running diverse workloads in the cloud, Compute Optimizer identifies workload patterns and provides three optimization scenarios. Each scenario can be visualized to help you understand the impact of changes on key metrics such as CPU, memory, network, and cost. I recommend the regular use of Compute Optimizer to customers.
In this blog post, I show how AWS Systems Manager provides a single dashboard for viewing the status of your EC2 instances and recommendations from Compute Optimizer. Although this post focuses on integration with Compute Optimizer, there are integrations available with other AWS services. For example, check the multi-account AWS Trusted Advisor summaries now available in AWS Systems Manager Explorer blog post.
Visualize your infrastructure
AWS Systems Manager gives you visibility and control of your infrastructure on AWS. It provides a unified user interface so you can view operational data from multiple AWS services. It also makes it possible for you to automate operational tasks across your AWS resources. AWS Systems Manager Explorer is a customizable operations dashboard that displays an aggregated view of operations data from across your AWS accounts and Regions. Explorer provides context into how operational issues are distributed, trend over time, and vary by category.

Figure 1: Explorer view of instance count, open OpsItems, and more
AWS Systems Manager Explorer collects data from multiple sources to provide a unified dashboard for understanding the status of your account.
Prerequisites
You need to first activate Compute Optimizer. Follow the steps in the AWS Compute Optimizer, your customized resource optimization service blog post.
To enable AWS Systems Manager, complete the setup steps in getting started with Systems Manager Explorer and OpsCenter in the AWS Systems Manager documentation.
If you are using AWS Organizations, you can configure AWS Systems Manager to retrieve details from all accounts within your AWS Organization or from different Organizational Units. Please refer to the Manage instances using AWS Systems Manager Quick Setup blog post. When you use the Quick Setup, Explorer uses default settings for AWS Identity and Access Management roles and AWS Systems Manager OpsData sources.
Explorer dashboard
After setup is complete, you can view the Explorer dashboard. The widgets are empty because it takes time to gather the information from the specified data sources. Some items, such as OpsItems, are populated in as few as 15 minutes. Others, such as EC2 instances and Trusted Advisor recommendations, can take up to six hours to be collected.
The widgets provide visibility into the data collected by Systems Manager Explorer. Click and drag the widgets to reorganize them and resize them using the anchor points in the bottom right. To remove a widget from the dashboard, use the Actions dropdown menu.
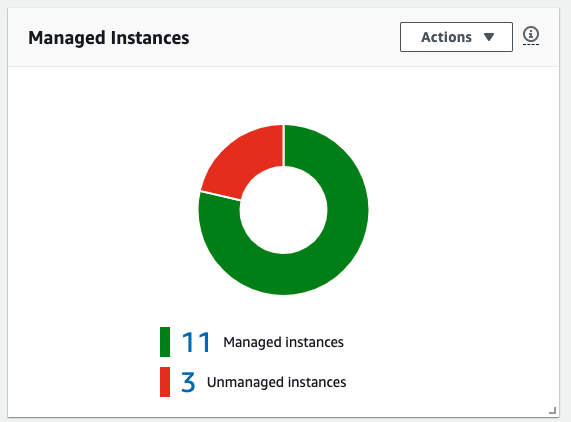
Figure 2: Managed instances
There are additional options for enabling and disabling the widgets on your dashboard. On the Explorer dashboard, choose Dashboard actions and then Configure Dashboard.
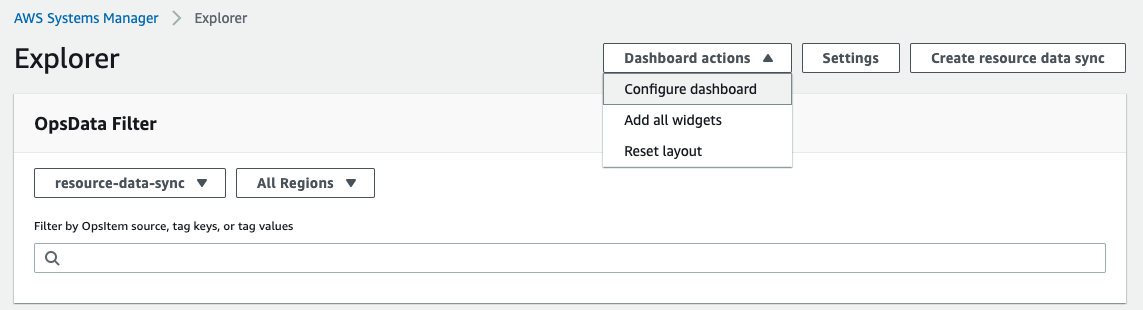
Figure 3: AWS Systems Manager Explorer Console
On the Configure OpsData sources and widgets page, you can enable or disable individual OpsData sources and control the visibility of associated widgets. The left side displays the OpsData sources. When you select an OpsData source row, you find all of the widgets for that source. You can then remove or add widgets for the selected OpsData source.
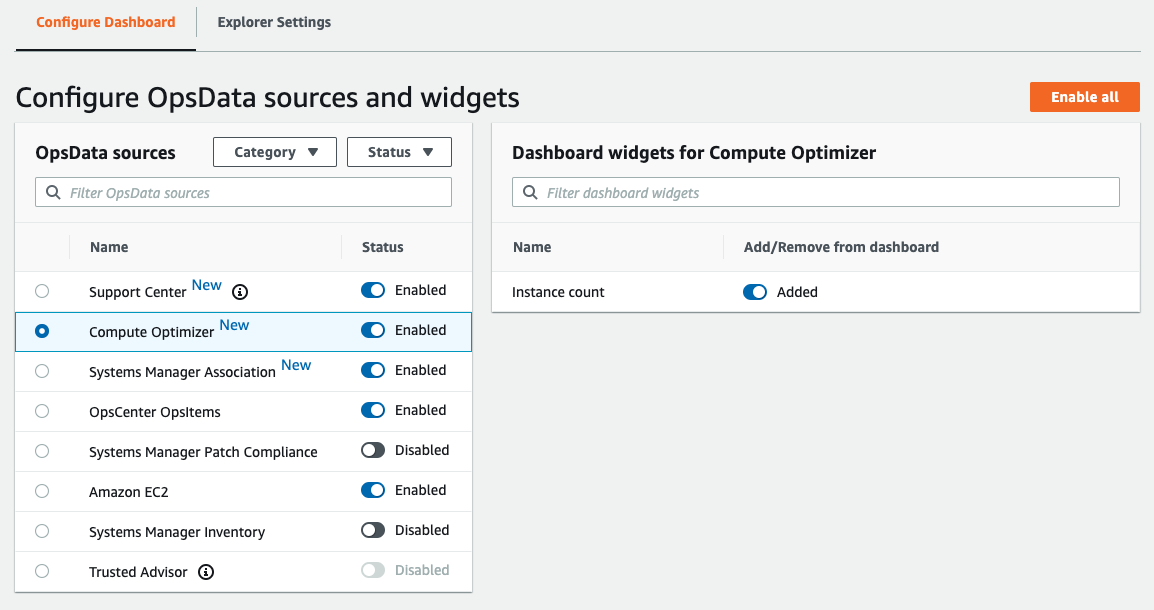
Figure 4: Detail displayed for AWS Compute Optimizer source
You can also filter the OpsData sources by category and status. For more information about customization options and OpsData sources, check customizing the display and using filters in the AWS Systems Manager documentation.

Figure 5: Dashboard widgets for Amazon EC2
But what about multiple AWS Regions and accounts?
By default, Explorer displays information for your account and currently selected Region only. To aggregate and view data from across Regions and accounts, you can create a Resource Data Sync. For more information, check setting up Systems Manager Explorer to display data from multiple accounts and Regions in the AWS Systems Manager documentation.
Figure 6 shows how I’ve selected a Resource Data Sync to pull in data from all Regions in my AWS Organization.
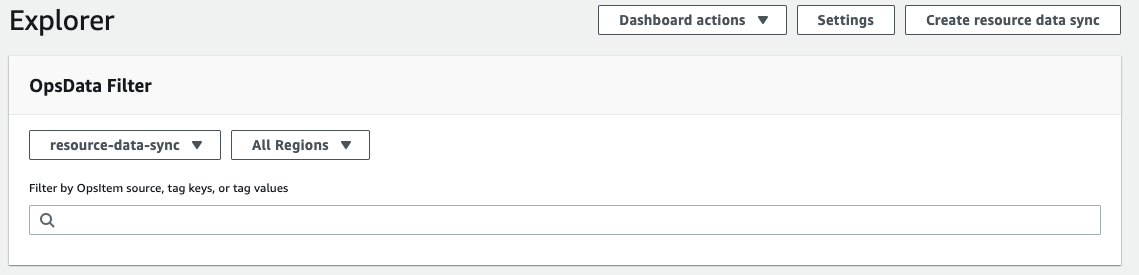
Figure 6: Explorer page showing Resource Data Sync from all Regions
Compute Optimizer summary
Refocusing on the Compute Optimizer, you will find recommendations within the Instance count widget. In my case, there are 14 instances in two different AWS Regions. In us-west-2, 11 instances are running, 3 of which are under provisioned and 1 of which is over provisioned. The remaining 7 instances are optimized.

Figure 7: Instance count section showing under provisioned and over provisioned instances
The information displayed on the AWS Systems Manager console is also available through the Systems Manager API. You can use the API to create your own dashboards or integrate this information into your operational tools and existing processes. For more information, check the GetOpsSummary API in the AWS Systems Manager API reference.
Compute Optimizer details
Those over provisioned instances grab my attention. When I click on the one over provisioned instance, I find recommendations that have been received from the Compute Optimizer. Figure 8 shows a list of the filters that have been applied (us-west-2 and OVER_PROVISIONED). The OpsData table shows columns of particular interest to me: Instance Id, Instance Type, Recommended Instance Type, and Price difference. You can find that I’m running an m5.large instance. If I were to change to a t3.nano instance, I would save $0.0908 per hour.
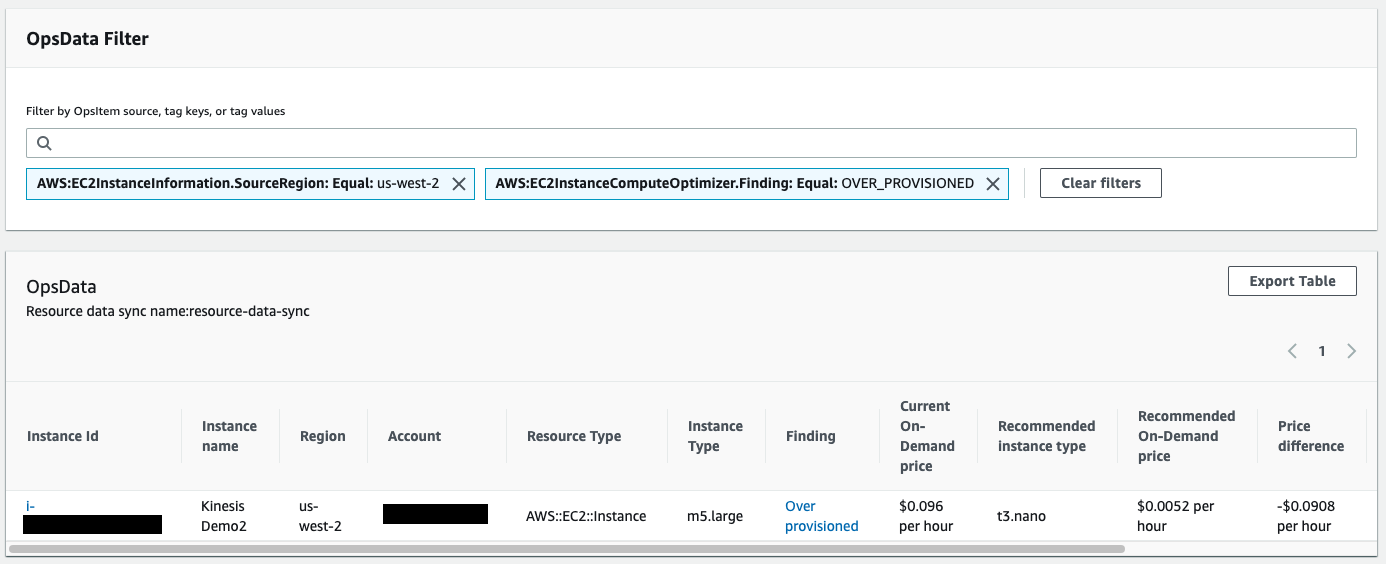
Figure 8: Compute Optimizer recommendation for over provisioned instance in us-west-2
You can use the Export Table button to send a CSV file to an Amazon Simple Notification Service (Amazon SNS) topic. You choose an Amazon Simple Storage Service bucket where the CSV file is stored, the SNS topic that receives the CSV file, and an optional message. After you choose Export Table, a Systems Manager Automation task starts and, in a few minutes, the subscribers to the SNS topic will receive a message. When you export the CSV file, an IAM role is created. This role has the permissions required to access the S3 bucket and SNS topic.
What happens when I change the instance type?
In the table of recommendations, there is a list of over provisioned instances. If I click the Over provisioned link shown in Figure 8, a new tab opens and displays Compute Optimizer details for the instance. There are three options for implementing the optimization and information to help me understand the price and resource differences between each instance type.
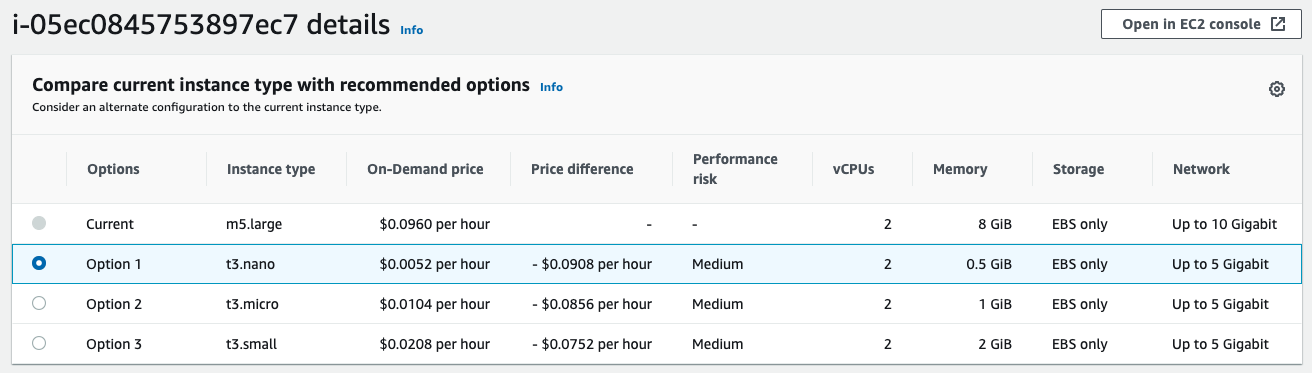
Figure 9: Comparison of current instance type with recommendations
What I find most interesting about this page is the list of metrics. These Amazon CloudWatch metrics display stats from the last two weeks and the predicted impact of changing the instance type. This helps me immediately find the impact of changing the number of CPUs and memory on various key metrics. I can use this information to predict if there will be impact on application performance. I’m okay with the higher memory usage for this workload, and from the top of the page, I choose Open in EC2 console and change the instance type.

Figure 10: Graphs of present CPU and memory utilization and more
Conclusion
In this post, I have shown how you can use Compute Optimizer to right-size EC2 instances to reduce costs and improve application performance. I also described the benefits of an aggregated view of operations data from across your AWS accounts and Regions available in the AWS Systems Manager Explorer dashboard. I encourage you to try these new features and share your feedback in the AWS Systems Manager forums or with your AWS Support contacts.
About the author

Michael Heyd is a Solutions Architect with Amazon Web Services and is based in Vancouver, Canada. Michael works with enterprise AWS customers to transform their business through innovative use of cloud technologies. Outside work he enjoys board games and biking.