Artificial intelligence (AI) and machine learning (ML) are gaining momentum in the healthcare industry, especially in healthcare imaging. The Amazon SageMaker approach to ML presents promising potential in the healthcare field. ML is considered a horizontal enabling layer applicable across industries. Within healthcare, this can serve analogous to a radiology or lab report as a key factor towards eventual diagnosis.
This blog post uses the UCI ML Dataset, which describes using ML in Orthopedics to automate the prediction of spinal pathology conditions. This technology presents an opportunity to take steps to minimize the number of visits and/or prescriptions by shortening diagnosis time and instilling rejection option techniques with ML. This will leave the difficult cases to the experts, such as the Orthopedists. Disc Hernia and Spondylolisthesis, the two diagnoses in the datasets, are among the spinal pathologies that can cause musculoskeletal pain disorders. There is opportunity within computer-aided diagnostic systems that use ML techniques to identify and treat patients-at-risk objectively and effectively to minimize opioid prescriptions for pain disorders.
For this blog post, I downloaded these datasets to present an example for predicting if a person has a normal or abnormal Orthopedic or spinal pathology (Hernia or Spondylisthesis) based on characteristics or features of their vertebral column. Preliminary diagnostic tools that take into account these features for these pathologies have high false positive rates. MRIs are used to detect containment of lumbar disc herniation; this technique has a ~33% false positive rate. Diagnostic spinal blocks (injections) carry a false positive rate of 22% to 47%. (Note: This will be used as a baseline when we evaluate the ML model.)
These datasets present both a multiclass and binary classification problem.
Creating an ML model in Amazon SageMaker for pathology prediction
In this post, we create two models—a multi-class categorical classification model and a binary classification model— and we evaluate both. The multi-class categorical classification will predict if a person has Normal, Herniated Discs, or Spondylolisthesis pathology. The binary classification will predict a binary response: 0 – Normal or 1 – Abnormal.
Here are the high-level steps we will follow to for this example:
- Prepare your Amazon SageMaker Jupyter notebook.
- Load a dataset from Amazon Simple Storage Service (S3) using Amazon SageMaker.
- Estimate a model using the Amazon SageMaker XGBoost (eXtreme GradientBoosting) algorithm.
- Host the model on Amazon SageMaker to make ongoing predictions.
- Generate final predictions on the test data set.
Setup
Download the first notebook and upload it to your SageMaker instance to follow along with this blog post. Let’s start by specifying the following:
- Specify the Amazon SageMaker role Amazon Resource Name (ARN) used to give learning and hosting access to your data. Note, if more than one role is required for notebook instances, training, and/or hosting, the boto3 call should be replaced with the appropriate full Amazon SageMaker role ARN string.
- Specify the Amazon S3 bucket that will be used for training and storing model objects.
You’ll also install liac-arff because Attribute-Relation File Format (ARFF) is the formatting we’ll use, given the dataset.
import os import boto3 import time import re
from sagemaker import get_execution_role
!pip install --upgrade pip
!pip install liac-arff #(install this package to import arff)

role = get_execution_role()
Now you need to import the relevant Python libraries that we’ll use throughout the analysis.
import pandas as pd                                     # For munging tabular data
import numpy as np                                      # For matrix operations and numerical processing
import matplotlib.pyplot as plt                         # For charts and visualizati ons
import io                                               # For working with stream data
from time import gmtime, strftime                       # For labeling SageMaker mod els, endpoints, etc.
import json                                             # For parsing hosting output
import sagemaker.amazon.common as smac                  # For protobuf data format
import arff                                             # For installing Liac-arff module (https://pypi.python.org/pypi/liac-arff) that implements functions to re ad and write ARFF files in Python
import csv                                              # For converting ARFF to CSV for AWS S3 to read
from random import shuffle                              # For randomizing or shuffli ng data
import requests, zipfile, StringIO                      # For unzipping and extracti ng files from zipped files
import sklearn as sk                                    # For access to a variety of machine learning models
from IPython.display import Image                       # For displaying images in t he notebook
from IPython.display import display                     # For displaying outputs in the notebook
from sklearn.datasets import dump_svmlight_file         # For outputting data to lib svm format for xgboost
import sys                                              # For writing outputs to notebook
import math                                             # For ceiling function
Let’s define the Amazon S3 bucket used for the example.
bucket = '<Your bucket name>'                      #enter your s3 bucket where you will copy data and model artifacts
prefix = 'sagemaker/xgboost-multiclass'    # place to upload training files with in the bucket
Data
Data comes in two separate files: column_2c_weka.arff and column_3c_weka.arff. The column names are in both files.
The hosted zip file (“vertebral_column_data”) consists of four data files, two of which contain the actual data and attributes: column_2C_weka.arff for binary classification and column_3C_weka.arff for categorical classification. The dataset consists of 310 rows representing 310 patient records.
Classes and attributes
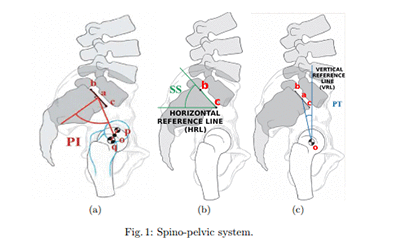 The dataset includes six biomechanical attributes of the patient and the outcome or pathology. The attributes describe the vertebral column (group of vertebras, invertebrate discs, nerves, muscles, medulla and joints). These spino-pelvic system parameters include angle of pelvic incidence (PI), angle of pelvic tilt (PT), lordosis angle, sacral slope (SS), pelvic radius, and grade of slipping.
Each patient has six biomechanical attributes derived from the shape and orientation of the pelvis and lumbar spine (in this order): pelvic incidence, pelvic tilt, lumbar lordosis angle, sacral slope, pelvic radius, and grade of spondylolisthesis. There is also a class or diagnosis for each patient–either binary: Normal (NO) and Abnormal (AB) or multiclass: DH (Disk Hernia), Spondylolisthesis (SL), Normal (NO).
Prepare
To get the data into Amazon S3 in a format that XGBoost can read, I extracted the relevant files from the zipped file, converted to CSV, and added them to the Amazon S3 bucket so that S3 and Amazon SageMaker can read them.
Extract files and read data pre-conversion
import requests, zipfile, StringIO
f_zip = 'http://archive.ics.uci.edu/ml/machine-learning-databases/00212/verteb ral_column_data.zip'

r = requests.get(f_zip, stream=True)
Vertebral_zip = zipfile.ZipFile(StringIO.StringIO(r.content)) Vertebral_zip.extractall()
##If extracting only particular file
#Vertebral_zip.extract('column_2C_weka.arff')

# Reading Arff --> Data --> Binary/Categorical Conversion --> CSV
data_dict = arff.load(open('column_3C_weka.arff', 'rb'))                 #Read arff for multiclass
data_arff = data_dict["data"]                                            #List of Datapoints only
Conversion
Now we take the extracted file and convert it into .csv files in the proper format (Ortho_dataset.csv for binary and Ortho_dataset_2.csv for multi-class). XGBoost requires binary attributes to be classified as 0 and 1. Therefore, in the binary classification file, I replaced “Abnormal” and “Normal” with “1” and “0” in the class variable column ‘diagnosis’, and in the multi-class categorical classification file, I replaced “Normal”, “Hernia”, and “Spondylolisthesis” with “0,” “1,” “2,” respectively.
See the following Python script to read the .arff file and convert it to .csv format.
shuffle(data_arff) #Shuffle the patients within the dataset
attributes_tup = data_dict["attributes"] #Extract attribute tuples
Attributes = []
for i in attributes_tup: #Extract only relevant attribute names
    for tup in i[::2]:
        Attributes.append(tup)

Ortho_dataset_2= [Attributes]+ data_arff


## Changing to categorical  values : "Hernia" to 1 and "Normal" to 0, "Spondylolisthesis" to 2
for row in Ortho_dataset_2:
    for i in row:
        if i == "Hernia":
            row.remove(i)
            row.append("1")
        if i == "Normal":
            row.remove(i)
            row.append("0")
        if i == "Spondylolisthesis":
            row.remove(i)
            row.append("2")

#Writing dataset to CSV
def writeCsvFile(filename, dataset):
    """
    @filename: string, filname to save it as
    @dataset: list of list of items

    Write data to file
    """
    mycsv = csv.writer(open(filename, 'wb'))
    for row in dataset:
        mycsv.writerow(row)

##For Multi-class:
writeCsvFile('Ortho_dataset_2.csv', Ortho_dataset_2)

# read the data
data = pd.read_csv('Ortho_dataset_2.csv', header = 0) #Header is zero to indicate first row's column headers

# save the data
data.to_csv("Mdata.csv", sep=',', index=False)

# read test data
data_test = pd.read_csv('Ortho_dataset_2.csv', header = 0, skiprows=0) #Header is zero to indicate first row's column headers

# set column names
data.columns = ["pelvic_incidence","pelvic_tilt","lumbar_lordosis_angle","sacral_slope","pelvic_radius",
                     "degree_spondylolisthesis","diagnosis"]


data_test.columns = ["pelvic_incidence","pelvic_tilt","lumbar_lordosis_angle","sacral_slope","pelvic_radius",
                     "degree_spondylolisthesis","diagnosis"]

##Create data bins to move diagnosis column to the first column
diagnosis_col = data.iloc[:,6]  #Diagnosis columns

#Creating new dataframe with diagnosis as first column

mdata_test_bin = pd.concat([diagnosis_col, data_test.iloc[:, 0:6]], axis=1)
mdata_bin = pd.concat([diagnosis_col, data.iloc[:, 0:6]], axis = 1)

# Set column names for dataframes

mdata_bin.columns = ["diagnosis","pelvic_incidence","pelvic_tilt","lumbar_lordosis_angle","sacral_slope","pelvic_radius",
                     "degree_spondylolisthesis"]
mdata_test_bin.columns = ["diagnosis","pelvic_incidence","pelvic_tilt","lumbar_lordosis_angle","sacral_slope","pelvic_radius",
                     "degree_spondylolisthesis"]
Data Exploration
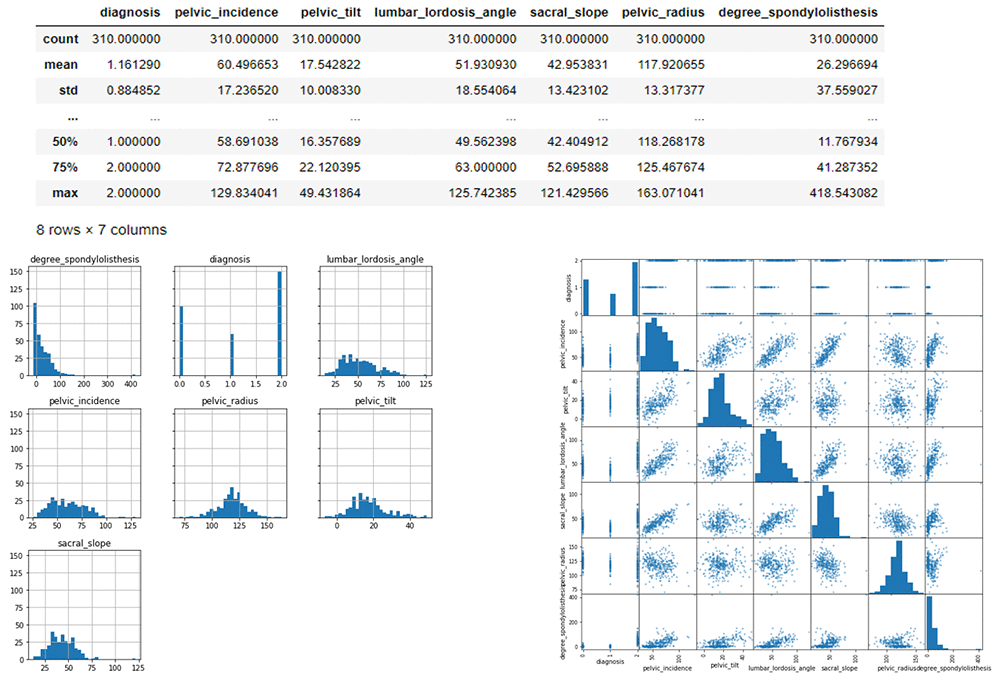
Now we’ll explore the dataset to understand the size of data, the various fields, the values that different features take, and the distribution of target values.
Data exploration and transformations
For an effective ML model and potentially for higher accuracy, the more data the better. Since the dataset we’re using in this blog post is quite limited, I didn’t remove any features. This methodology can be applied for larger data sets.
# set display options
pd.set_option('display.max_columns', 100)     # Make sure we can see all of the columns
pd.set_option('display.max_rows', 6)         # Keep the output on one page


# # display positive and negative counts
# display(data.iloc[:,6].value_counts())
display(data_test.iloc[:,6].value_counts())


#display the data sets post column changes
# display(mdata_bin)
# display(mdata_test_bin)

# count number of positives and negatives
display(mdata_bin.iloc[:,0].value_counts())
print("data_test:")
display(mdata_test_bin.iloc[:,0].value_counts())
Data histograms and correlation
Here we can visualize the data to see the spread of data within each feature in a histogram and scatter matrix. The scatter-plot matrix displays the correlation between pairs of variables. The matrix makes it easy to look at all pairwise correlations in one place.
# Histograms for each numeric features display(mdata_bin.describe())
%matplotlib inline
hist = mdata_bin.hist(bins=30, sharey=True, figsize=(10, 10))

##correlation display(mdata_bin.corr())
pd.plotting.scatter_matrix(mdata_bin,figsize=(12, 12)) plt.show()
Data Description
Let’s talk about the data. At a high level, we can see:
- There are 7 columns and 217 rows in the training data
- There are 7 columns and 93 rows in the test data
- Diagnosis is the target field
Specifics on the features:
- 6 out of 6 features are numeric
Target variable:
- diagnosis: MultiClass: Whether the patient has Hernia, Spondylosisthesis or is Normal or Binary: Whether or not the patient has an abnormal spine condition
Training
For our first training algorithm we use the xgboost algorithm. xgboost is an extremely popular, open-source package for gradient boosted trees. It’s computationally powerful, fully featured, and has been successfully used in many machine learning competitions. Let’s start with a simple xgboost model, trained using the Amazon SageMaker managed, distributed training framework.
First we’ll need to specify training parameters. These include the following:
- The role to use
- Our training job name
- The
xgboost algorithm container
- Training instance type and count
- S3 location for training data
- S3 location for output data
- Algorithm hyperparameters
The supported training input format is csv, libsvm. For csv input, we assume that the input is separated by delimiters (automatically detect the separator using Python’s built-in sniffer tool), without a header line, and the label is in the first column. The Scoring Output Format is csv. Our data is in CSV format, so we’ll convert our dataset to the way that the Amazon SageMaker XGBoost supports. We will keep the target field in first column and remaining features in the next few columns. We will remove the header line. We will also split the data into a separate training and validation sets. Finally, we’ll store the data in our S3 bucket.
Split the data into 70% training and 15% validation and save it before calling XGBoost
# Split the data randomly as 70% for training and remaining 30% and save them locally
mtrain_list = np.random.rand(len(mdata_bin)) < 0.7
mdata_train = mdata_bin[mtrain_list]
mdata_val = mdata_bin[~mtrain_list]
mdata_train.to_csv("mformatted_train.csv", sep=',', header=False, index=False)         # save training data
mdata_val.to_csv("mformatted_val.csv", sep=',', header=False, index=False)             # save validation data
mdata_test_bin.to_csv("mformatted_test.csv", sep=',', header=False,  index=False)      # save test data
Upload training and validation data sets in the S3 bucket with prefix below (i.e., ‘train/’)
mtrain_file = 'mformatted_train.csv'
mval_file = 'mformatted_val.csv'

boto3.Session().resource('s3').Bucket(bucket).Object(os.path.join(prefix, 'train/', mtrain_file)).upload_file(mtrain_file)
boto3.Session().resource('s3').Bucket(bucket).Object(os.path.join(prefix, 'val/', mval_file)).upload_file(mval_file)
Specify parameters based on the model
- Multiclass: objective: “multi:softmax”, num_class: “3”
- Binary: objective: “binary:logistic”, eval_metric: “error@t” (where t is the score threshold of error)
Mxgboost_containers = {'us-west-2' : '433757028032.dkr.ecr.us-west-2.amazonaws.com/xgboost:latest',
                    'us-east-1' : '811284229777.dkr.ecr.us-east-1.amazonaws.com/xgboost:latest',
                    'us-east-2' : '825641698319.dkr.ecr.us-east-2.amazonaws.com/xgboost:latest',
                    'eu-west-1' : '685385470294.dkr.ecr.eu-west-1.amazonaws.com/xgboost:latest'}
import boto3
from time import gmtime, strftime

mjob_name = 'Mxgboost-ortho' + strftime("%Y-%m-%d-%H-%M-%S", gmtime())
print("Training job", mjob_name)

mcreate_training_params = \
{
    "AlgorithmSpecification": {
        "TrainingImage": Mxgboost_containers[boto3.Session().region_name],
        "TrainingInputMode": "File"
    },
    "RoleArn": role,
    "OutputDataConfig": {
        "S3OutputPath": "s3://{}/{}/single-xgboost/".format(bucket, prefix),
    },
    "ResourceConfig": {
        "InstanceCount": 1,
        "InstanceType": "ml.m4.4xlarge",
        "VolumeSizeInGB": 1000
    },
    "TrainingJobName": mjob_name,
    "HyperParameters": {
        "max_depth":"5",
        "eta":"0.1",
        "gamma":"1",
        "min_child_weight":"1",
        "silent":"0",
        "objective": "multi:softmax", #for multiclass
        "num_round": "20",
        "num_class": "3", #remove if not multiclass
    },
    "StoppingCondition": {
        "MaxRuntimeInSeconds": 60 * 60
    },
    "InputDataConfig": [
        {
            "ChannelName": "train",
            "DataSource": {
                "S3DataSource": {
                    "S3DataType": "S3Prefix",
                    "S3Uri":  "s3://{}/{}/train/".format(bucket, prefix),
                    "S3DataDistributionType": "FullyReplicated"
                }
            },
            "ContentType": "csv",
            "CompressionType": "None"
        },
        {
            "ChannelName": "validation",
            "DataSource": {
                "S3DataSource": {
                    "S3DataType": "S3Prefix",
                    "S3Uri": "s3://{}/{}/val/".format(bucket, prefix),
                    "S3DataDistributionType": "FullyReplicated"
                }
            },
            "ContentType": "csv",
            "CompressionType": "None"
        }
    ]
}
%%time

region = boto3.Session().region_name sm = boto3.client('sagemaker')

sm.create_training_job(**mcreate_training_params)

status = sm.describe_training_job(TrainingJobName=mjob_name)['TrainingJobStatu s']
print(status) sm.get_waiter('training_job_completed_or_stopped').wait(TrainingJobName=mjob_name)
if status == 'Failed':
message = sm.describe_training_job(TrainingJobName=mjob_name)['FailureReas on']
print('Training failed with the following error: {}'.format(message)) raise Exception('Training job failed')

# Estimated Time: ~6 minutes
Hosting
Now that we’ve trained the xgboost algorithm on our data, let’s set up a model that can later be hosted. We will do the following:
- Point to the scoring container.
- Point to the model.tar.gz that came from
- Create the hosting model.
model_name=mjob_name + '-mdl' Mxgboost_hosting_container = {
'Image': Mxgboost_containers[boto3.Session().region_name], 'ModelDataUrl': sm.describe_training_job(TrainingJobName=mjob_name)['Mo
delArtifacts']['S3ModelArtifacts'], 'Environment': {'this': 'is'}
}

create_model_response = sm.create_model( ModelName=model_name, ExecutionRoleArn=role,
PrimaryContainer=Mxgboost_hosting_container)
print(create_model_response['ModelArn'])
print(sm.describe_training_job(TrainingJobName=mjob_name)['ModelArtifacts']['S3ModelArtifacts'])
After we set up a model, we can configure what our hosting endpoints should be. Here we specify the following:
- EC2 instance type to use for hosting.
- Initial number of instances.
- Our hosting model name.
from time import gmtime, strftime

mendpoint_config_name = 'MXGBoostEndpointConfig-' + strftime("%Y-%m-%d-%H-%M-%S", gmtime())
print(mendpoint_config_name)
create_endpoint_config_response = sm.create_endpoint_config(
    EndpointConfigName = mendpoint_config_name,
    ProductionVariants=[{
        'InstanceType':'ml.m4.xlarge',
        'InitialInstanceCount':1,
        'InitialVariantWeight':1,
        'ModelName':model_name,
        'VariantName':'AllTraffic'}])

print("Endpoint Config Arn: " + create_endpoint_config_response['EndpointConfigArn'])
Create endpoint
Finally, we create the endpoint that serves up the model, through specifying the name and configuration defined earlier. The end result is an endpoint that can be validated and incorporated into production applications. This takes about 7-11 minutes to complete.
%%time
import time

mendpoint_name = 'MXGBoostEndpoint-' + strftime("%Y-%m-%d-%H-%M-%S", gmtime())
print(mendpoint_name)
create_endpoint_response = sm.create_endpoint(
    EndpointName=mendpoint_name,
    EndpointConfigName=mendpoint_config_name)
print(create_endpoint_response['EndpointArn'])

resp = sm.describe_endpoint(EndpointName=mendpoint_name)
status = resp['EndpointStatus']
print("Status: " + status)

while status=='Creating':
    time.sleep(60)
    resp = sm.describe_endpoint(EndpointName=mendpoint_name)
    status = resp['EndpointStatus']
    print("Status: " + status)

print("Arn: " + resp['EndpointArn'])
print("Status: " + status)
Prediction
Here is the model that was created. This model will be used to predict values.
runtime= boto3.client('runtime.sagemaker')
# Simple function to create a csv from our numpy array

def np2csv(arr):
    csv = io.BytesIO()
    np.savetxt(csv, arr, delimiter=',', fmt='%g')
    return csv.getvalue().decode().rstrip() (csv, arr, delimiter=',', fmt='%g') return csv.getvalue().decode().rstrip()
# Function to generate prediction through sample data
def do_predict(data, endpoint_name, content_type):

    payload = np2csv(data)
    response = runtime.invoke_endpoint(EndpointName=endpoint_name,
                                   ContentType=content_type,
                                   Body=payload)
    result = response['Body'].read()
    result = result.decode("utf-8")
    result = result.split(',')
    preds = [float((num)) for num in result]
    return preds

# Function to iterate through a larger data set and generate batch predictions
def batch_predict(data, batch_size, endpoint_name, content_type):
    items = len(data)
    arrs = []

    for offset in range(0, items, batch_size):
        if offset+batch_size < items:
            datav = data.iloc[offset:(offset+batch_size),:].as_matrix()
            results = do_predict(datav, endpoint_name, content_type)
            arrs.extend(results)
        else:
            datav = data.iloc[offset:items,:].as_matrix()
            arrs.extend(do_predict(datav, endpoint_name, content_type))
        sys.stdout.write('.')
    return(arrs)
### read the saved data for scoring
mdata_train = pd.read_csv("mformatted_train.csv", sep=',', header=None)
mdata_test = pd.read_csv("mformatted_test.csv", sep=',', header=None)
mdata_val = pd.read_csv("mformatted_val.csv", sep=',', header=None)
# display(mdata_val.iloc[:,0].value_counts())
Generate predictions on train, validation, and test sets
mpreds_train_xgb = batch_predict(mdata_train.iloc[:, 1:], 1000, mendpoint_name, 'text/csv')
mpreds_val_xgb = batch_predict(mdata_val.iloc[:, 1:], 1000, mendpoint_name, 'text/csv')
mpreds_test_xgb = batch_predict(mdata_test.iloc[:,1:],1000, mendpoint_name, 'text/csv')
Evaluate model accuracy for multiclass categorical
There are many ways to compare the performance of a machine learning model.
For multiclass models, typically we use the F1 measure and not the AUC score, area under the ROC curve which is typically used in binary models. The F1 measure is a statistical measure of the precision and recall of all the classes in the model. The score ranges from 0 to 1; the higher the score, the better the accuracy of the model. For example, an F1 score of ~0.9 would indicate a better model than a score of 0.7.
Other evaluation metrics include Sensitivity, or true positive rate, and Precision, or positive predictive value. This will be covered more in depth in the binary classification example.
from sklearn import metrics
mtrain_labels = mdata_train.iloc[:,0];
mval_labels = mdata_val.iloc[:,0];
mtest_labels = mdata_test.iloc[:,0];

Training_f1 = metrics.f1_score(mtrain_labels, mpreds_train_xgb, average=None)
Validation_f1= metrics.f1_score(mval_labels, mpreds_val_xgb, average=None)
# fbeta_test= metrics.f1_score(mtest_labels, mpreds_test_xgb, average=None)
prec, rec, fbeta_test, support = metrics.precision_recall_fscore_support(mtest_labels, mpreds_test_xgb, average = None)
metrics.precision_recall_fscore_support(mtest_labels, mpreds_test_xgb, average = None)

print"Average Training F1 Score", (Training_f1[0]+Training_f1[1]+Training_f1[2])/3 ##0.95594
print"Average Validation F1 Score", (Validation_f1[0]+Validation_f1[1]+Validation_f1[2])/3 ##0.7922

print "Test Evaluation: "
print "Average F1 Score: ", (fbeta_test[0]+fbeta_test[1]+fbeta_test[2])/3 ##0.91
print "Normal F1 Score: ", fbeta_test[0] ## 0.8944
print "Hernia F1 Score: ", fbeta_test[1] ## 0.8524
print "Spondylosisthesis F1 Score: ", fbeta_test[2] ## 0.9832
print "Average Precision Score: ", (prec[0]+prec[1]+prec[2])/3 ##0.91
print "Average Sensitivity/TPR Score: ", (rec[0]+rec[1]+rec[2])/3 ##0.91
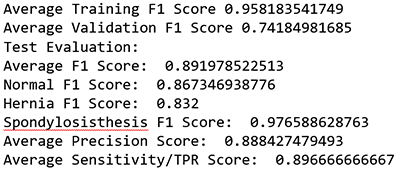
This ML model received an average F1 score of ~0.9.
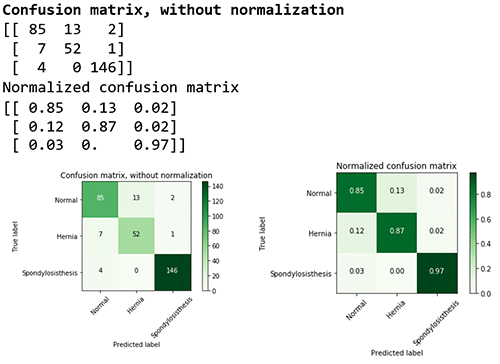
Confusion matrix
You can also delve into the performance for each class by looking at the confusion matrix.
The confusion matrix provides a visual representation of the performance based on the accuracy of the multiclass classification predictive model. In this table you can find the percentage of true positives and false positives.
import itertools

class_names = ["Normal","Hernia", "Spondylosisthesis"]
def plot_confusion_matrix(cm, classes,
                          normalize=False,
                          title='Confusion matrix',
                          cmap=plt.cm.Greens):
    """
    This function prints and plots the confusion matrix.
    Normalization can be applied by setting `normalize=True`.
    """
    if normalize:
        cm = cm.astype('float') / cm.sum(axis=1)[:, np.newaxis]
        print("Normalized confusion matrix")
    else:
        print('Confusion matrix, without normalization')

    print(cm)

    plt.imshow(cm, interpolation='nearest', cmap=cmap)
    plt.title(title)
    plt.colorbar()
    tick_marks = np.arange(len(classes))
    plt.xticks(tick_marks, classes, rotation=45)
    plt.yticks(tick_marks, classes)

    fmt = '.2f' if normalize else 'd'
    thresh = cm.max() / 2.
    for i, j in itertools.product(range(cm.shape[0]), range(cm.shape[1])):
        plt.text(j, i, format(cm[i, j], fmt),
                 horizontalalignment="center",
                 color="white" if cm[i, j] > thresh else "black")

    plt.tight_layout()
    plt.ylabel('True label')
    plt.xlabel('Predicted label')
For example, you can see that the class (or diagnosis) Spondylolisthesis had a high accuracy rate (97%), with 146 cases out of 150 cases predicted correctly in the evaluation dataset. The F1 score of 0.97 is also relatively high. However, class Hernia had a lower F1 score of 0.85 showing that the model confused it with the Normal pathology. For more information on multiclass model evaluation and insights, go to Multiclass Model Insights: https://docs.aws.amazon.com/machine-learning/latest/dg/multiclass-model-insights.html.
# Compute confusion matrix
cnf_matrix = metrics.confusion_matrix(mtest_labels, mpreds_test_xgb) np.set_printoptions(precision=2)

# Plot non-normalized confusion matrix plt.figure()
plot_confusion_matrix(cnf_matrix, classes=class_names,
title='Confusion matrix, without normalization')

# Plot normalized confusion matrix plt.figure()
plot_confusion_matrix(cnf_matrix, classes=class_names, normalize=True,
title='Normalized confusion matrix')

plt.show()
#Confusion matrix, without normalization
Once you are done, delete the endpoints by running the following command:
sm.delete_endpoint(EndpointName=mendpoint_name)
Binary classification model
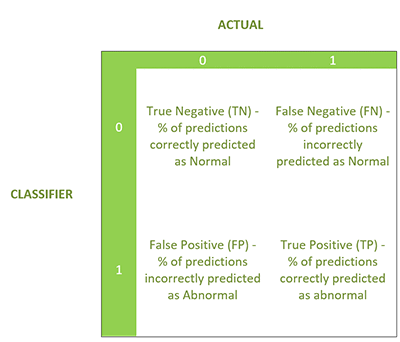
Now, we’re going to show the Binary Classification model which yields a binary response (0 or 1)—in this case, 0 was normal and 1 was abnormal. The evaluation produces the following four statistics in a similar confusion matrix.
Setup, data, and training
Setup for binary is similar to the setup for multiclass categorical. You can begin by downloading the notebook with Part 2 for this section. However, there are a few differences, which I will call out for you.
Extracting data files:
# Reading Arff --> Data --> Binary/Categorical Conversion --> CSV
data_dict = arff.load(open('column_2C_weka.arff', 'rb')) #Read arff for binary
Conversion:
## Changing to binary values : "Abnormal" to 1 and "Normal" to 0 for row in Ortho_dataset:
for i in row:
if i == "Abnormal": row.remove(i) row.append("1")
if i == "Normal": row.remove(i) row.append("0")
Ultimately the data set will have 310 rows with 200 as abnormal and 100 as normal.
When training, the hyperparameters will be different.
Specify parameters based on the model (example: objective: binary:logistic, eval_metric: error@0.40).
 "HyperParameters": {
        "max_depth":"5",
        "eta":"0.1",
        "gamma":"1",
        "min_child_weight":"1",
        "silent":"0",
        "objective": "binary:logistic", #for binary
        # "eval_metric": "auc", #for binary with no threshold adjustment
        "eval_metric": "error@.40", #for binary with threshold adjustment
        "num_round": "20",
Evaluation metrics for the binary classification model
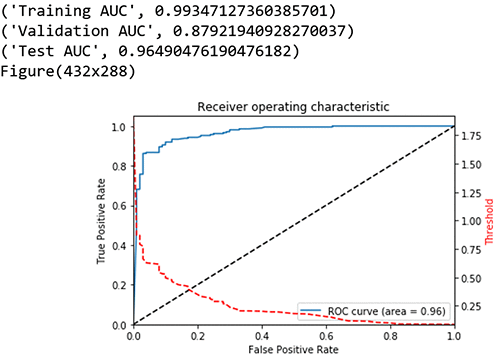
For the binary classification the model uses AUC, area under the curve, as the score. AUC is a metric used to measure the quality of a binary classification ML model. It ranges from 0.5 to 1; the higher the AUC score, the better the ML model quality. In this case, you can also adjust the score threshold.
Compute performance metrics on the training, validation, test data sets
I took a look at the graph plot of True Positive Rate vs. False Positive Rate based on varying thresholds. The goal is to have a high True Positive Rate (TPR or Sensitivity) and low False Positive Rate (FPR or Fall out) and thereby have a higher AUC.
from sklearn import metrics
from sklearn.metrics import roc_auc_score
train_labels = data_train.iloc[:,0];
val_labels = data_val.iloc[:,0];
test_labels = data_test.iloc[:,0];

##below is only for Binary
print("Training AUC", roc_auc_score(train_labels, preds_train_xgb)) ##0.9934
print("Validation AUC", roc_auc_score(val_labels, preds_val_xgb) )###0.8792
print("Test AUC", roc_auc_score(test_labels, preds_test_xgb) )###0.9649

fpr, tpr, thresholds = metrics.roc_curve(test_labels, preds_test_xgb)
roc_auc = metrics.auc(fpr, tpr) # compute area under the curve

plt.figure()
plt.plot(fpr, tpr, label='ROC curve (area = %0.2f)' % (roc_auc))
plt.plot([0, 1], [0, 1], 'k--')
plt.xlim([0.0, 1.0])
plt.ylim([0.0, 1.05])
plt.xlabel('False Positive Rate')
plt.ylabel('True Positive Rate')
plt.title('Receiver operating characteristic')
plt.legend(loc="lower right")

# create the axis of thresholds (scores)
ax2 = plt.gca().twinx()
ax2.plot(fpr, thresholds, markeredgecolor='r',linestyle='dashed', color='r')
ax2.set_ylabel('Threshold',color='r')
ax2.set_ylim([thresholds[-1],thresholds[0]])
ax2.set_xlim([fpr[0],fpr[-1]])

print(plt.figure())
Other model evaluation metrics
- F1 Score: Weighted average of the precision and recall
- Sensitivity, hit rate, recall, or true positive rate
- Specificity or true negative rate
- Precision or positive predictive value
- Negative predictive value (NPV)
- Fall out or false positive rate (FPR)
- False negative rate (FNR)
- False discovery rate (FDR)
- Overall accuracy
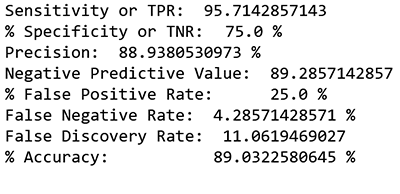
Here I can adjust the threshold to increase sensitivity and minimize the FNR in order to have close to zero false negatives.
In a false negative case or if a patient is diagnosed too late, costs and treatment can be more aggressive and could put patients’ lives in danger. Therefore, I will err towards minimizing false negatives closer to zero.
In this case, I adjusted the threshold toward the 4.3% false negative, with a high accuracy rate (89%) and the low error rate (11%) at cutoff 0.3. The error percentage indicates the rate at which the model made a prediction mistake. The error rate, or in this case also the false positive rate, sets at 25%. Comparing this false positive (FP) rate to the industry baseline of MRI (33% FP) and diagnostic blocks (22%-47% FP), using Amazon SageMaker-based models, with this dataset, produces results that are in the range of other tools typically used.
threshold = 0.30 pred_test_labels = []
for i in range(len(preds_test_xgb)): if preds_test_xgb[i] > threshold:
pred_test_labels.append(1) else:
pred_test_labels.append(0)

TN, FP, FN, TP = metrics.confusion_matrix(test_labels, pred_test_labels).ravel ()
metrics.confusion_matrix(test_labels, pred_test_labels)

# Sensitivity, hit rate, recall, or true positive rate Sensitivity	= float(TP)/(TP+FN)*100
# Specificity or true negative rate Specificity	= float(TN)/(TN+FP)*100
# Precision or positive predictive value Precision = float(TP)/(TP+FP)*100
# Negative predictive value NPV = float(TN)/(TN+FN)*100
# Fall out or false positive rate FPR = float(FP)/(FP+TN)*100
# False negative rate
FNR = float(FN)/(TP+FN)*100
# False discovery rate
FDR = float(FP)/(TP+FP)*100
# Overall accuracy
ACC = float(TP+TN)/(TP+FP+FN+TN)*100

print "Sensitivity or TPR: ", Sensitivity, "%"	##95.7142% print "Specificity or TNR: ",Specificity, "%" ##75%
print "Precision: ",Precision, "%"	##88.938%
print "Negative Predictive Value: ",NPV, "%" ##89.285% print "False Positive Rate: ",FPR,"%" ##25%
print "False Negative Rate: ",FNR, "%" ##4.2857% print "False Discovery Rate: ",FDR, "%" ## 11.0619% print "Accuracy: ",ACC, "%" ##89.0322%
Conclusion
As you can see in this blog post, the binary “abnormal” and “normal” pathology classification in Orthopedics can yield a decision-support system that labels critical cases (as opposed to categorically classifying them into exact pathologies). The ML filters leave the complex and critical cases for the human expert, such as an orthopedic surgeon. In addition, this approach provides factors for guidelines on when to prescribe opioids, thus narrowing the pool for opioid prescriptions. We are at the beginning of exploring the ways that ML can advance healthcare diagnosis. Look for more advancements as we continue to get more data and learn.
About the Author
 Sunaina Ahuja Rajani manages Video Games, Media, Toys GLs, as well as events and seasonality on Prime Now, a two hour delivery e-commerce channel. She received a BSc and Masters in fields of healthcare and cognitive neuroscience. She is from Texas and has lived in Utah, D.C., NYC, Cambridge, and now Seattle. Sunaina loves to read the Wall Street Journal, Healthcare and Tech news, and enjoys dancing, biking, investing, and the Matrix movies.