AWS Partner Network (APN) Blog
Graph Feature Engineering with Neo4j and Amazon SageMaker
By Ben Lackey, Director Global Cloud Channel Architecture – Neo4j
By Antony Prasad Thevaraj, Sr. Partner Solutions Architect – AWS
 |
| Neo4j |
 |
Featurization is one of the most difficult problems in machine learning (ML), second only to data wrangling in terms of the time it consumes. For many problems, featurization plays the largest role in determining model performance, greater even than choice of machine learning method.
There are many approaches to featurization. Some, like computing windows over time and exponential weighted moving averages, are extremely mature with literature dating back decades. Others are just emerging.
In this post, we will walk through how graph features engineered in Neo4j can be used in a supervised learning model trained with Amazon SageMaker. These novel graph features can improve model performance beyond what’s possible with more traditional approaches.
Neo4j is an AWS Data and Analytics Competency Partner that enables organizations to unlock the business value of connections, influences, and relationships in data.
Neo4j Enterprise Edition consists of three components:
- Neo4j Graph Database (GDB): Neo4j invented the graph database space over a decade ago. This database stores, retrieves, and manages data natively as graphs, enabling users to see and leverage the connections in their data.
- Neo4j Graph Data Science (GDS): Implementations of over 50 graph algorithms covering areas like embedding, link prediction, and community detection.
- Neo4j Bloom: A graph specific business intelligence (BI) tool.
Together, these components offer a graph platform that can be used to understand graph data and operationalize graph use cases. In this post, we’re doing each—both exploring a graph dataset and then building an ML model with embeddings computed from that dataset.
Graph Feature Engineering Architecture
The notebook underlying this post is available on GitHub. This walks you through setting up the architecture shown below.
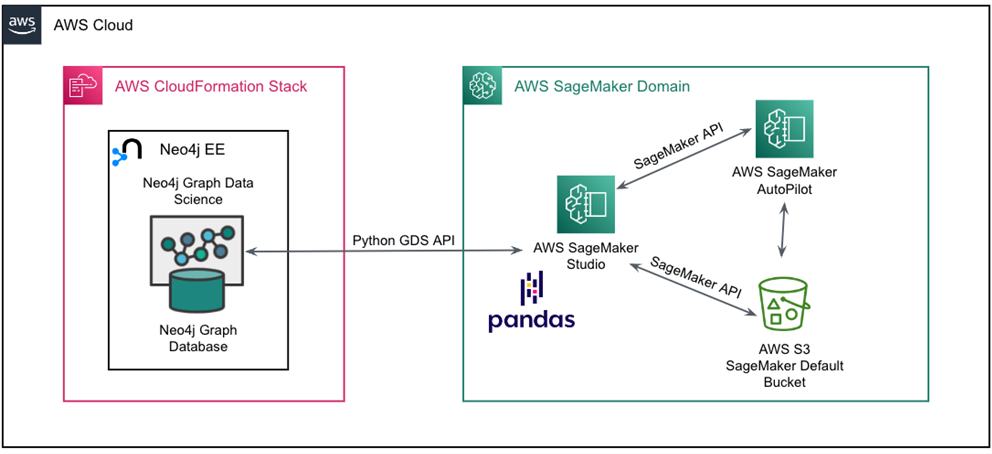
Figure 1 – Neo4j Enterprise Edition and Amazon SageMaker architecture.
Once we’ve completed a few prerequisites, the main steps in our flow will be:
- Import data from Amazon Simple Storage Service (Amazon S3) into Neo4j Graph Database using the Neo4j LOAD CSV function.
- Use an Amazon SageMaker Studio notebook to create a graph projection in Neo4j Graph Data Science. Within that projection, compute a graph embedding that will be our new feature, and then write the embedding back to GDB.
- Read the enriched dataset into Amazon SageMaker Autopilot and create a training job that trains a new supervised learning classifier.
The Dataset
The dataset we’ll be working with comes from the SEC’s EDGAR system, a collection of public regulatory filings. Specifically, we’re going to be looking at a year’s worth of Form 13 data.
Form 13 is filed quarterly by asset managers with $100 million or more assets under management (AUM). In the form, they are required to disclose current holdings of public equities. The data we’re going to be working with was scraped from EDGAR with these scripts and is available as a CSV file.
The dataset contains filings from Q1, Q2, and Q3 of 2021. There’s a target column that’s binary. ‘True’ indicates a given manager’s holdings of a particular stock increased in the next quarter, while ‘False’ indicates it decreased. We don’t include data from Q4, as that was used to compute the target column for Q3.
Deploying Neo4j
We’re going to need a Neo4j deployment. There are many ways to run Neo4j on Amazon Web Services (AWS). Through AWS Marketplace specifically, there are two options:
- Neo4j Enterprise Edition: Bring Your Own License (BYOL) listing that deploys Neo4j using an AWS CloudFormation template.
- Neo4j AuraDB Enterprise: A managed service for Neo4j GDB.
Because we want to use the GDS component, we’re going to deploy the Neo4j Enterprise Edition listing through AWS Marketplace. For users who prefer the command line, the same template in the Marketplace listing is available on GitHub.
To deploy Neo4j Enterprise Edition, simply navigate to the listing and click “Continue to Subscribe.” You’ll need to click through a few dialogs to subscribe before you land at a screen where you can configure your deployment. Be sure to set the following values:
- Stack name: neo4j-ee
- Graph Database Version: 4.4.9
- Install Graph Data Science: True
- Graph Data Science License Key: None
- Install Bloom: False
- Bloom License Key: None
- Node Count: 1
- Instance Type: r6i.4xlarge
- Disk Size: 100
- SSH CIDR: 0.0.0.0/0
You’ll need to pick a password, which will enable you to login to Neo4j browser later.
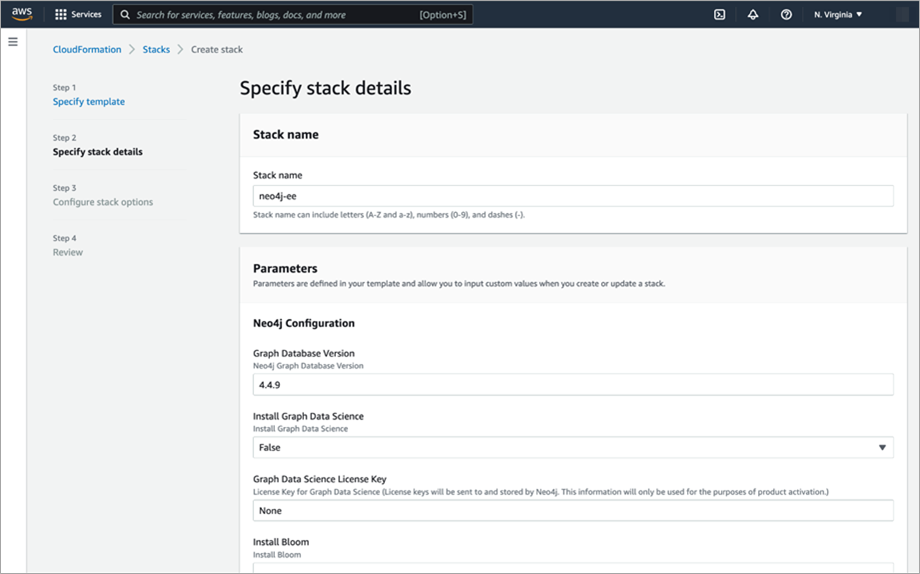
Figure 2 – Configuring Neo4j Enterprise Edition in AWS Marketplace.
With all of that done, click through to deploy; the deployment will take 3-5 minutes. Once the infrastructure is up, a cloud-init script will fire on your node. That installs and sets up Neo4j Enterprise Edition.
Log In to Neo4j
Now that we’ve deployed Neo4j Enterprise Edition, let’s log in.
We’re going to need to get the domain name service (DNS) record for the load balancer we deployed. To do that, open up the view of stacks in the AWS Management Console. Click on the stack you just deployed and view its output, and you’ll see a variable called Neo4jBrowserURL. Copy its value and paste that into a web browser.
That should present you with a login screen. If it doesn’t, it’s quite likely the cloud-init script hasn’t quite finished running. In that case, grab a cup of coffee and check back. If you need to debug, there are logs in /var/log/cloud-init-output.log and /var/log/neo4j/debug.log on the machine that can assist.
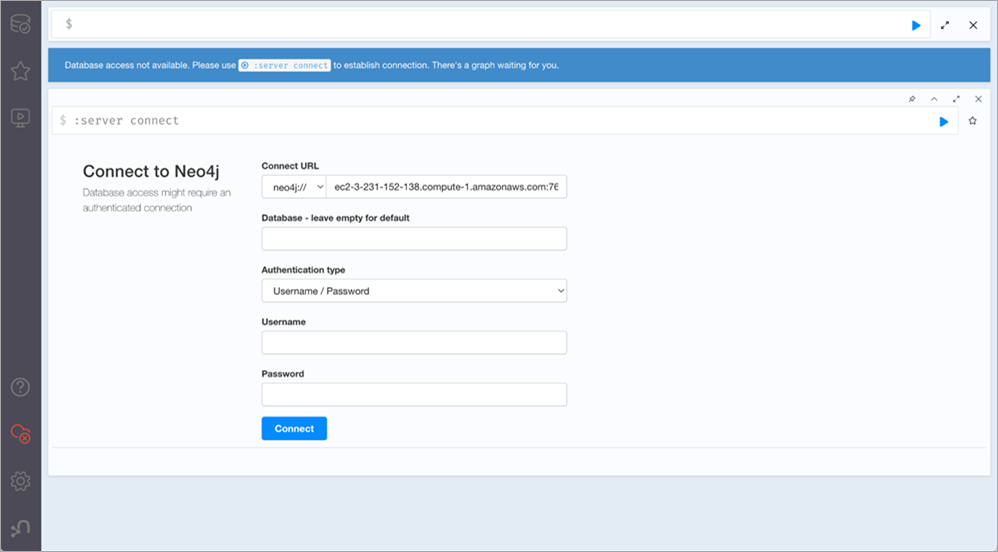
Figure 3 – Logging into Neo4j browser running on AWS.
Once you see a login screen, the default username is “neo4j.” The password will be whatever you passed into the CloudFormation template earlier. Once logged in, you’re presented with a screen where you can enter cypher queries and explore the database.
Load Data from Amazon S3
We don’t have any data yet, so let’s get some loaded into our database. While we could run those in the Neo4j browser, instead let’s open up Amazon SageMaker Studio and run them from within a Python notebook which is available in GitHub.
We’ll need to edit some variables so we can connect to our Neo4j deployment.
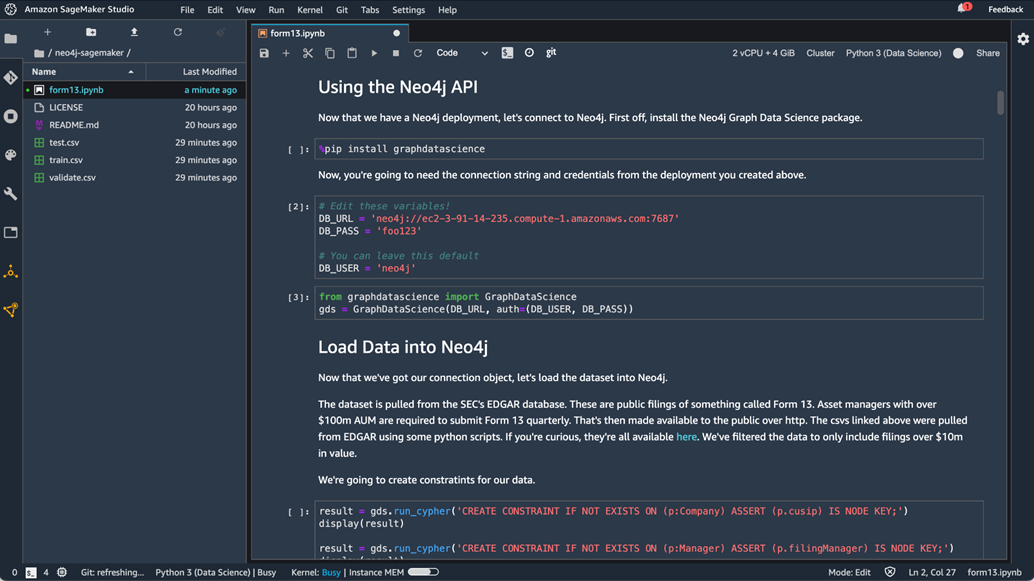
Figure 4 – Connecting to Neo4j from Amazon SageMaker Studio.
With that complete, we can load data. To pull it in from Amazon S3, we’re going to run a series of cypher commands which use the LOAD CSV command to import our data. These commands will create constraints on the data that ensure things are indexed properly.
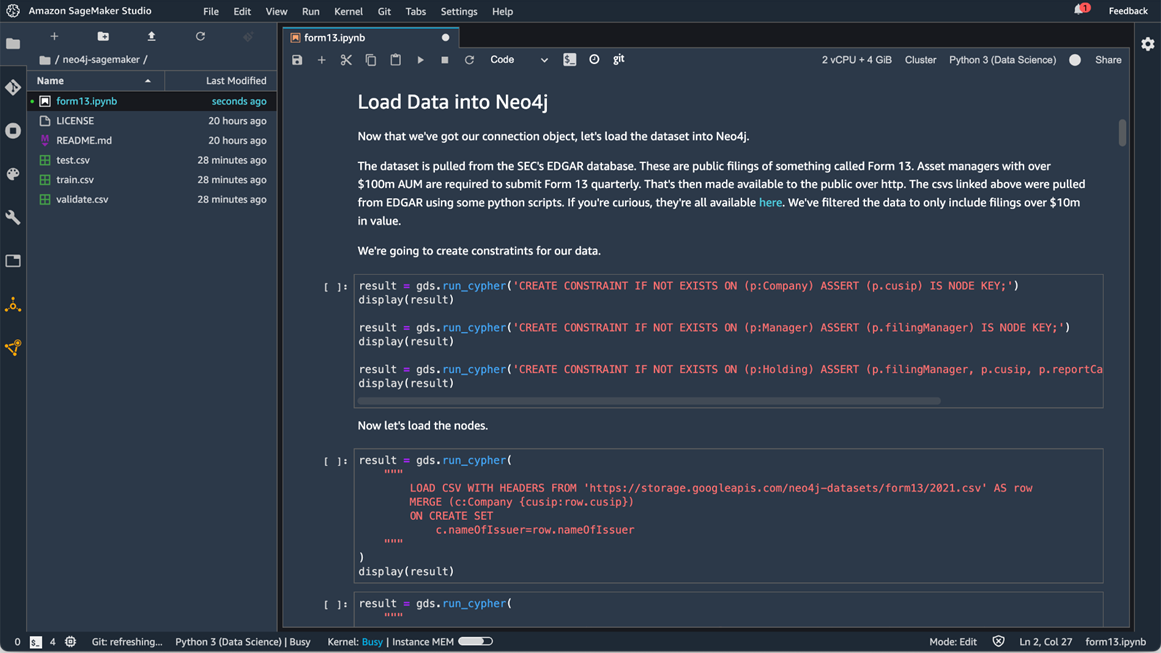
Figure 5 – Loading data into Neo4j with Amazon SageMaker Studio.
With that done, we have three kinds of nodes and two kinds of relationships. Those all have constraints that ensure we’re indexing according to cusip.
At this point, you may want to explore the dataset a bit to get familiar with it. To do so, simply click the database icon in the upper left. From there, you can select a node type such as “Company” that will generate an example query.
Create the Projection and Embedding
Next, we’re going to use Neo4j GDS to create a projection, compute graph embeddings, and then write that back to the database.

Figure 6 – Computing and embedding with Neo4j Graph Data Science.
The notebook then writes three CSVs to its local storage. There’s one for our training, testing and validation set.
Train a Model in SageMaker
We’ve enriched the dataset, and now the final step is to use that data to train up a new classifier. We’re going to use Amazon SageMaker Autopilot, which makes the job of building a machine learning model easy as it automates tasks related to model selection. To invoke SageMaker Autopilot, simply continue to run the notebook.

Figure 7 – Creating a session in Amazon SageMaker Studio.
With the model trained, we’ve now used graph features that we engineered with an embedding to enrich our machine learning model. We can poke around the model and the data that Amazon SageMaker used. Feel free to explore!
Conclusion
In this notebook, we deployed Neo4j Enterprise Edition. Within Amazon SageMaker Studio, we loaded a dataset in Neo4j Graph Database, and we used Neo4j Graph Data Science to compute a graph embedding on that dataset. We then ran a SageMaker AutoPilot job and inspected the output.
This same flow can be repurposed to add graph embeddings to your own ML jobs. Graph embeddings are just one sort of graph feature that can be used in machine learning. The approach we used here would apply to incorporating other features like betweenness or neighborhood as well.
You can work through the same data flow we discussed in this post, and the notebooks and data are all accessible on GitHub. Please reach out to ecosystem@neo4j.com with any questions.
.

.
Neo4j – AWS Partner Spotlight
Neo4j is an AWS Data and Analytics Competency Partner that enables organizations to unlock the business value of connections, influences, and relationships in data.