AWS Partner Network (APN) Blog
How Insider Learned to Scale a Production Grade Elasticsearch Cluster on AWS
September 8, 2021: Amazon Elasticsearch Service has been renamed to Amazon OpenSearch Service. See details.
By Deniz Parmaksız, Sr. Machine Learning Engineer at Insider
 |
| Insider |
 |
In this post, I will tell you about Insider’s two-year journey of scaling up a production Elasticsearch cluster, which is a vital element for our recommendation and search products.
I will also describe the problems we encountered and how we fixed them by changing the configurations and architecture.
Insider is an AWS ISV Partner with the Digital Customer Experience Competency. We are running our Elasticsearch clusters on Amazon OpenSearch Service (successor to Amazon Elasticsearch Service).
Amazon OpenSearch Service enables Insider to scale easily with almost zero downtime without the operational overhead and focus more on developing our products.
This post is written based on the knowledge and experiences of Insider’s machine learning engineers, and the main objective is to share the know-how and factors for Amazon Web Services (AWS) customers who are planning to conduct similar actions in the future.
Insider’s experiences in scaling Elasticsearch to cover increased customer usage can help you conduct in-depth research and identify the root causes of performance issues before making changes to increase the operational scalability of a technical component used in your business.
Insider’s Elasticsearch Architecture
Our Elasticsearch clusters are generally used by resources such as customer-facing APIs that are performing read operations, and Spark clusters that are performing write operations.
The Elasticsearch clusters are located within the same virtual private cloud (VPC) with other services that are using the cluster. It provides security, network cost optimization, and low latency.
Data-intensive clusters run on three AWS Availability Zones, use M5 series instances for master nodes, and I3 series instances for data nodes. We have lots of indices with a single sharding.

Figure 1 – Insider’s Elasticsearch architecture.
There are periodical heavy write workloads and always-on read operations, performed by multiple APIs and Spark clusters. Write operations are being queued on Amazon Kinesis Data Streams by producers, and executed by a single AWS Lambda function in batches.

Figure 2 – Insider’s Elasticsearch cluster architecture.
Why Do We Prefer this Architecture?
Our architecture did not spring to life out of the box, but evolved over time. At first, our primary cluster had M-series data nodes and no dedicated master nodes.
The write operations were being applied using direct database connection from the producer that wanted to operate write operations on documents. This was OK until the products that were using the cluster began scaling rapidly.
The Problem
When the number of partners using the product and their data size increased, the number and volume of write operations also increased. Eventually, we started to face instant spikes on CPU utilization from 20 percent to 90 percent on the cluster.
The Investigation
The first thing we did was analyze the correlation of health metrics. We realized that CPU spikes were matching with heavy write loads, so we investigated our pipeline.
The problem was that we were running too many parallel operations that were using the same database and performing direct batch writes at high volumes.

Figure 3 − Old pipeline architecture with multiple producers.
We took several actions to prevent the situation. One was a quick solution, and the other was the real solution.
Quick Solution: Update Elasticsearch Configurations
The fastest solution to apply was changing Elasticsearch configurations. When Elasticsearch performs a write operation, it should also index the document for search queries to find it. This is a costly operation.
The refresh interval configuration sets the duration between the indexing operations of recently updated documents. Default refresh interval for an index is one second, which may cause performance issues on production workloads. So, we increased the refresh interval of the indices to 10 seconds.
Real Solution: Refactor the Architecture
Configuring Elasticsearch indices was easy, but not enough to avoid another incident in the upcoming months. Therefore, we decided to refactor the pipeline architecture and perform write operations from a single point to the Elasticsearch cluster.
Since we had multiple parallel operations we had to queue their write requests somewhere and perform the write operations from another place. We selected Amazon Kinesis Data Streams to queue up the documents with their metadata about the index and document ID.
We used AWS Lambda to be triggered by Amazon Kinesis events, and perform write operations as batches to the Elasticsearch cluster, as shown in Figure 4. This introduces a little lag on write requests, but in our case, it was not a problem from the business needs perspective.
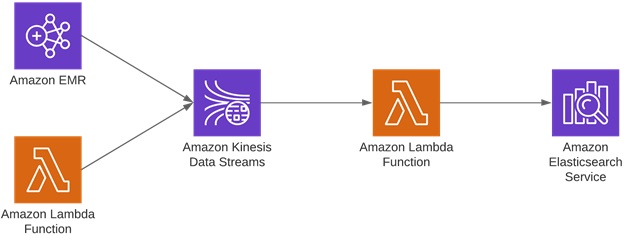
Figure 4 − New pipeline architecture with multiple producers.
Benefits of the New Architecture
This approach gives us a lot of elasticity. Since the Lambda function controls the batch size and flow rate of the write operations, we can parallelize our compute as much as we want, and then pump the results to Amazon Kinesis Data Stream in less time.
This allows us to tweak the batch size and IOPS rate in the production environment within seconds by configuring the Lambda function, which has an immediate effect.
Finally, in case of any incident or migration situation on the production cluster, we can stop the write operations without stopping the computation by simply disabling the Lambda function.
All the write requests continue to line up on Amazon Kinesis Data Streams and, when the aforementioned situation is handled, the Lambda function is re-enabled and writes are performed without any data loss.
The Problem Occurred Again
Having write operations from a single point fixed the issue for good, or so we thought. Six months later we experienced the CPU spikes again. At that time, we had much more data and requests compared to the previous time, and started to investigate the problem.
Solution: Change Instance Type
As a quick action, we replaced data nodes from M series to C series, which have better CPU performance. After all, if you are experiencing CPU issues, why not improve your CPU? Well, it was a wrong decision and the situation got worse.
After investigating the cluster health metrics, we realized that Java Virtual Machine (JVM) memory pressure on data nodes was too high. We examined a sawtooth graph for maximum JVM memory pressure for the cluster and noticed it was not going down.
When we examined how Elasticsearch controls JVM garbage collection, we understood the root cause. The old generation pool was filling up and full garbage collection was being activated too frequently, which happens when JVM memory pressure hits 75 percent.
We realized our main issue had been the memory and heap space all along. We changed data nodes to R instances, which are memory-optimized.
We also added three dedicated master nodes to increase cluster stability, and bingo! CPU utilization, JVM memory pressure, and garbage collection old collection count went back to normal.
The Problem Hits One Last Time
We did not experience any issues for months—until we did. We recently got another hit by the very same cluster, as its usage had increased a lot by that time. After investigating the slow query logs, we realized that some queries were generating extreme loads.
Slow Queries
First, we optimized those queries, but it was not enough. We then investigated health metrics using Cerebro, an open-source admin tool for Elasticsearch, and realized we needed more IOPS on data nodes.
More IOPS
As a solution, we changed R series data nodes to I3 series, which comes with NVMe SSD-based instance storage that’s optimized for low latency, very high random I/O performance, and high sequential read throughput. They also deliver high IOPS at a low cost.
Index Sharding
We also realized that while some indices were big, some of them were very small and using the default five shards settings was an overkill. To fix that, we decreased the number of shards and also increased the replication factor for big indices while keeping it at two for small indices.
You need to play and do some benchmarking with that replication and sharding settings to find the sweet spot for your data and cluster. Since then, we are perfectly running high load operations on the production cluster without any interruption to our services.
Conclusion
At Insider, we have been using Elasticsearch for a long time and are satisfied with its performance and features. We had a couple of issues when we scaled up its usage, but we fixed them by making changes on configurations, architecture, and hardware.
We realized that fixing symptoms without understanding the root cause may lead to worse scenarios, and learned the hard way the importance of identifying the real issue as soon as possible.
If you’re interested in further reading to help tune your Elasticsearch cluster, check out the documentation to learn how to: tune for indexing speed, tune for search speed, tune for disk usage, and size your shards.
The content and opinions in this blog are those of the third-party author and AWS is not responsible for the content or accuracy of this post.
.

.
Insider – AWS Partner Spotlight
Insider is an AWS ISV Partner that helps marketers drive growth with the AI-powered Growth Management Platform.
Contact Insider | Partner Overview
*Already worked with Insider? Rate the Partner
*To review an AWS Partner, you must be a customer that has worked with them directly on a project.