AWS Partner Network (APN) Blog
Understanding and Monitoring Embeddings in Amazon SageMaker with WhyLabs AI Observatory Platform
By Andre Elizondo, Principal Solutions Architect – WhyLabs
By Shun Mao, Sr. Partner Solutions Architect – AWS
By James Yi, Sr. Partner Solutions Architect – AWS
 |
| WhyLabs |
 |
With the rise of large language models (LLMs), natural language processing (NLP), and generative AI models, embeddings are becoming a critical piece of data in more machine learning (ML) use cases.
In this post, we’ll explore different ways that embeddings are used in machine learning and where problems can show up that impact your ML models, and how you can use WhyLabs to identify those problems and create monitors to avoid them showing up again in the future.
WhyLabs is an AWS Partner and an essential artificial intelligence (AI) observability platform for machine learning model and data health. It’s the only ML monitoring and observability platform that doesn’t operate on raw data, which enables a no-configuration solution, privacy preservation, and massive scale.
WhyLabs AI Observatory Platform is available in AWS Marketplace.
What Are Embeddings and How Are They Used?
Embeddings are a way to represent complex data types as numerical representations that preserve context and relationships. They can be sparse or dense to represent different types of data, and embeddings are heavily used in machine learning for a variety of data types and tasks as inputs, intermediate products, and outputs.
Here are a few examples of where embeddings are often used in AI/ML. In each of these use cases, embeddings are critical as a way to preserve the original context that can be utilized to decode later or compare characteristics of the upstream data.
Natural language understanding and text analysis:
- Sentiment analysis
- Document classification
- Text generation
Computer vision and image processing:
- Manufacturing quality assurance
- Autonomous driving
Audio processing:
- Text-to-speech models
- Speaker identification
Tabular machine learning:
- Product recommendation
- Anonymization and privacy
Because embeddings are context-preserving, they’re a trailing indicator of a change in the upstream data or a failure in transformation steps upstream. Depending on the structure of your organization, this may involve different teams which are creating the embeddings and those who are putting them to use.
While there are many different ways to handle the creation of embeddings, we won’t cover them in this post. Instead, we’ll discuss how embeddings can be measured to identify meaningful drift in the transformed inputs which can be used to identify close clusters of centroids or distances between individual centroids.
Typically for debugging, data scientists would use lower dimensional representations like UMAPs or t-SNE, which is helpful to visually identify clusters but isn’t a scalable approach to understand your embeddings over time in production.
To handle this in a scalable way, whylogs is an open-source library for logging any kind of data that creates a lightweight statistical profile of your data that can be used to extract meaningful insights and characteristics, letting you measure quality and drift over time.
Using whylogs, customers are able to identify centroids in their embeddings and measure different distances inside of different clusters. This can be helpful when identifying how your embeddings change over time or have a sudden shift due to a change in the upstream data. Read more in this WhyLabs blog post.
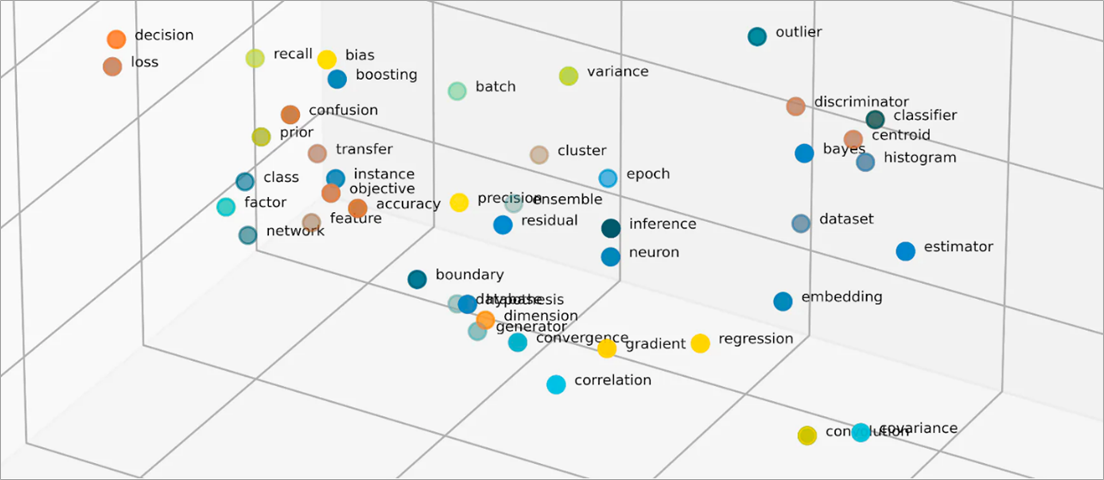
Figure 1 – Visualization of embedding space.
Train and Deploy a Classification Model
In this section, we’ll set up and train a simple classification model in Amazon SageMaker, which lets you build, train, and deploy machine learning models using fully managed infrastructure, tools, and workflows.
We’ll use the newsgroup datasource to create vectors and train our model on those vectors.
Next, we’ll create an entrypoint script that defines how to load our model and make predictions. We’ll then deploy our model to an endpoint so we can make some batched predictions and compare our results. Finally, we’ll use a pretrained model on this same dataset to optimize the process of defining the endpoint in SageMaker.
If the model URI has a problem to download in the code, we can download the model first and upload it into our own Amazon Simple Storage Service (Amazon S3) bucket. We can then replace the S3 URI with the one matching the new model location.
Measure Embedding Distances with whylogs
Now that we have our model trained and entrypoint defined, we’ll capture a set of reference points in our embeddings to help identify the centroids in embeddings that our model was trained on. This will help us compare distances for unique centroids in our embeddings during inference, and we’ll come back to that a bit later in this post.
To capture our reference points, we have a few different options in whylogs. We can manually define relationships, or let whylogs automatically identify centroids based on corresponding labels or by utilizing an unsupervised clustering approach.
For this example, we have a well-labeled dataset so we’ll have whylogs choose our reference points based on labels denoting each of our centroids.
We now have our centroids and references defined, and this allows us to use the references when profiling our dataset and comparing it to other batches of data. Next, let’s define the necessary setup for whylogs to understand what reference points to compare to.
Monitor Embedding Drift with WhyLabs Observatory
At this point, we have a trained model, reference embeddings, and a whylogs resolver defined to extract the information we want from our embeddings. In order to see the power of measuring embeddings distances, we’ll create a scenario where we are using our classifier to predict the class of document it learned from our training set.
Let’s define a series of news article batches to transform and send to our model. First, we’ll add some perturbation towards the latter end of batches, and we’ll do this by taking a percentage of articles and translating them into Spanish before transforming them and running our classifier.
To speed things up, let’s download the production data from a public S3 bucket. That way, we won’t have to translate or tokenize the documents ourselves.
The dataframe below contains 5,306 documents—2,653 in English and 2,653 in Spanish. The Spanish documents were obtained by simply translating the English ones. Documents that have the same “doc_id” refer to the same document in different languages. We’ll also define a method to inject some interesting scenarios when we profile our data later.
Next, we want to define our WhyLabs organization, project ID, and API key that will be used to store and process our batches.
Now that we have our authentication defined, we’ll separate our dataset into individual batches denoting a day’s worth of data. We’ll create a dataframe for each day with the raw inputs, tokens from our document, embeddings produced, and the output received from our model.
Afterwards, we’ll profile each dataframe and backdate it to show a progression towards the drift and model degradation we’re expecting.
Here’s a high-level architecture of what we just did:
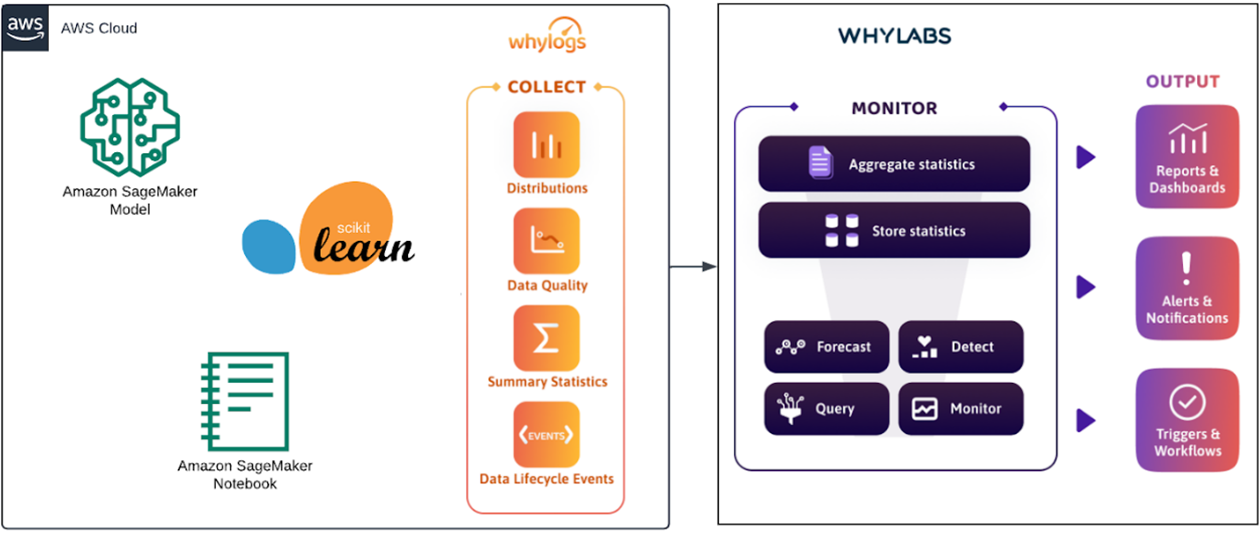
Figure 2 – Architecture of the integration in this post.
When we open our project in WhyLabs, we see that our profiles were successfully generated for each batch and submitted to the platform. We won’t cover every feature and output created by our resolver but will highlight three of them below.
Observe Introduced Drift in WhyLabs
You should now have access to a number of different features in your dashboard that represent the different aspects of the pipeline we monitored:
- news_centroids: Relative distance of each document to the centroids of each reference topic cluster, and frequent items for the closest centroid for each document.
- document_tokens: Distribution of tokens (term length, document length and frequent items) in each document.
- output_prediction and output_target: The output (predictions and targets) of the classifier that will also be used to compute metrics on the “Performance” tab.
With the monitored information, we should be able to correlate the anomalies and reach a conclusion about what happened.
news_centroids.closest
In the chart below, we can see the distribution of the closest centroid for each document. For the first four days, the distribution is similar between each other. The language perturbations injected in the last three days seem to skew the distribution towards the “forsale” topic.

Figure 3 – Visualization in WhyLabs for ‘news_centroids.closest’ input.
document_tokens.frequent_terms
Since we removed the English stopwords in our tokenization process but didn’t remove the Spanish stopwords, we can see that most of the frequent terms in the selected period are the Spanish stopwords, and those stopwords don’t appear in the first four days.

Figure 4 – Visualization in WhyLabs for ‘document_tokens.frequent_terms.’
Performance.F1
In the “Performance” tab, there is plenty of information that tells us our performance is degrading. For example, the F1 chart below shows the model is getting increasingly worse starting from the fifth day.
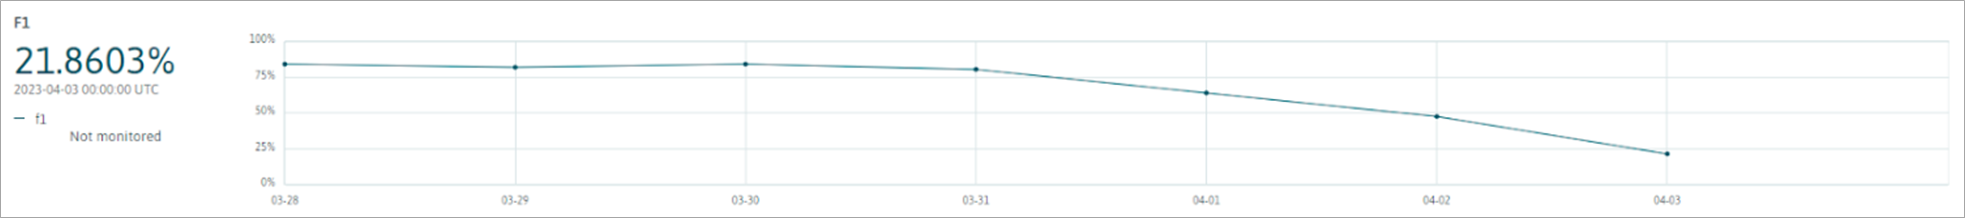
Figure 5 – F1 performance metric visualization in WhyLabs.
For now, we’ll focus on how to use WhyLabs to monitor these and be notified in the future when our dataset changes and impacts our models performance.
Navigate to the Monitor Manager and select the “Presets” tab.
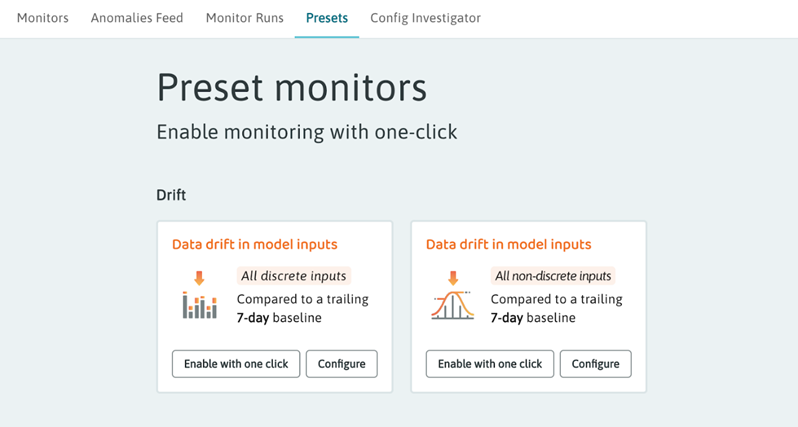
Figure 6 – Preset drift monitors in WhyLabs.
Next, we’ll create a drift monitor on our discrete inputs using the “Configure” option on the “Data drift in model inputs” for “All discrete inputs.” Click through to modify the drift distance threshold under section 2 and leave everything else the same. Lastly, use the save button at the bottom to complete creating our monitor.
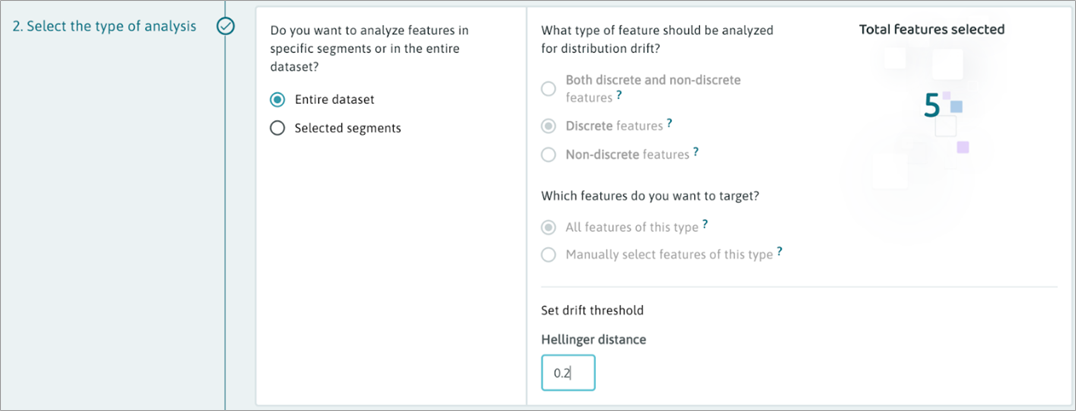
Figure 7 – Customization of preset monitor parameters in WhyLabs.
Now, we’ll test our monitor on the “news_centroids.closest” feature to show the drift in categorical distribution when we changed our language to Spanish, causing the “forsale” cluster to become the closest centroid cluster more consistently.
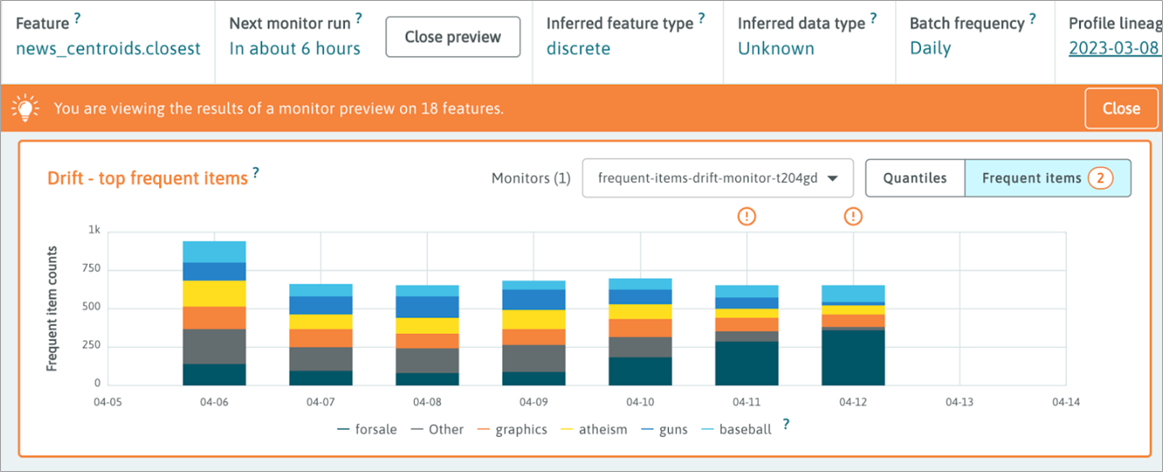
Figure 8 – Monitor failure preview in WhyLabs for ‘news_centroids.closest’ input.
We can see that WhyLabs identified the drift in closest clusters which would have triggered an alert to our downstream notification endpoint. This can help us to avoid a sudden change like this in the future.
Conclusion
Embarking on your journey with WhyLabs and Amazon SageMaker is simple. Take a look at our sample notebook the example in this post is built from, and then make your way over to WhyLabs Observatory to create a free account and begin monitoring your SageMaker models.
You can also learn more about the WhyLabs AI Observability Platform in AWS Marketplace.
.

.
WhyLabs – AWS Partner Spotlight
WhyLabs is an AWS Partner and AI observability platform for machine learning model and data health.