AWS Partner Network (APN) Blog
Unifying Cloud Infrastructure and Application Performance Data with AppDynamics and Amazon CloudWatch
By Subarno Mukherjee, Sr. Solutions Architect at AppDynamics
By Todd Escalona, Principal Solutions Architect at AWS
 |
One of the core pillars to building better digital experiences in the cloud is being able to understand the health of your highly scalable and flexible infrastructure in the context of application performance.
For many organizations, the deeper the level of insight they have means a more thorough understanding into their overall cloud and hybrid tech stack. This allows you to proactively manage user experience while continuously assessing the environment for risk.
AppDynamics (part of Cisco) is an application and business performance monitoring solution that allows you to prioritize your workflows with unified visibility, ensuring your cloud-native apps deliver business value in production.
Context-aware visualizations and correlated insights across application domains allows users to build cloud-native applications with confidence while tying the deployments back to business outcomes in real-time.
Amazon CloudWatch is a monitoring and observability service that provides customers with data and actionable insights to monitor applications, respond to system-wide performance changes, optimize resource utilization, and get a unified view of operational health.
Together, AppDynamics can now retrieve data from Amazon CloudWatch metrics via an Amazon Web Services (AWS) metric retrieval API endpoint called GetMetricData. This enables you to pull as many as 500 different metrics in a single request, with a total of 100,800 data points per call.
You can also perform math expressions on the data to easily derive insights from CloudWatch metrics on the operational health and performance of your infrastructure as it grows more distributed and potentially complex over time.
Extended Cloud Integration
In October 2020, AppDynamics released a cloud-native visualization UI that integrates with Amazon CloudWatch and ingests AWS-hosted entities and data in real-time, offering a one-stop solution for visibility across various layers of AWS applications.
Improvements to the highly extensible cloud platform include intelligent, out-of-the-box application topology discovery and mapping, with the ability to explore integrated dynamic and static application topologies through a new full-stack observability platform.
Additionally, the improvements extend coverage to deterministically link the business transaction topology to a wide range of AWS services, including Amazon Elastic Compute Cloud (Amazon EC2), Amazon Aurora (MySQL), Elastic Load Balancing, Amazon MQ, Amazon API Gateway, and Amazon Virtual Private Cloud (VPC).
Why Cloud-Native Visualization?
In conventional on-premises environments with physical and virtual machines, the only way to establish the topology of an application and its associated services is to tag and follow every transaction that flows through the system as it runs.
Once completed, a dynamic topology view can be created. This view encompasses the individual requests to a transaction and the different paths through application services without the need to redeploy them.
AppDynamics—an AWS Advanced Technology Partner with AWS Competencies in Migration, Mobile, and DevOps—manifests this topology in the form of the flow map. The business transaction flow map shows how individual transactions traverse application service tiers, while the application flow map overlays all of these transaction flow maps onto a single application-wide flow map.
The AppDynamics interface was previously divided separately by types of monitoring and objects (such as databases). This provided solid insight discrete services, but lacked an overall sense of connectedness.
Given the growth of cloud adoption and the urgency for IT teams to be able to correlate application and infrastructure data across domains, AppDynamics seized the opportunity to transform their data model and properly exemplify connectedness more intuitively.
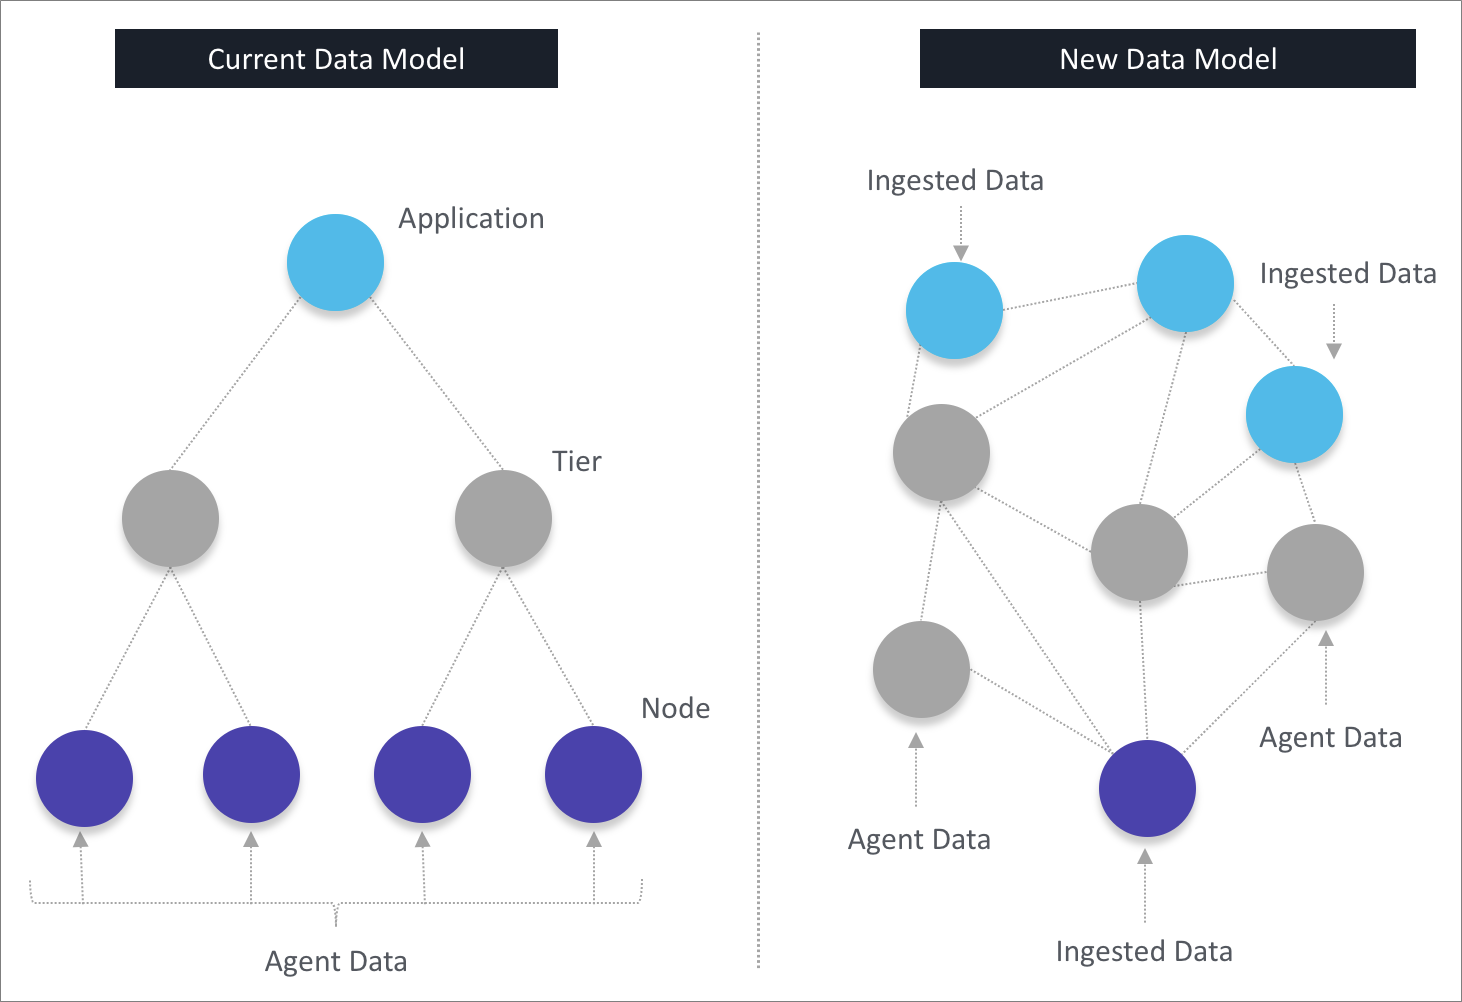
Figure 1 – Side-by-side comparison of both data models.
The underlying infrastructure of cloud-native applications is usually predefined with metadata, which initially makes up a static topology that does not change as new event metadata arrives. For example, a static topology may depict what machines exist, what network interfaces are attached to them, and in what VPCs those network interfaces reside.
The ability to programmatically change and update topologies on-demand has highlighted how the underlying code that makes up a topology can also be a potential cause of application issues. As such, being able to visualize these topologies in real-time is more important than ever.
Jobvite is an applicant tracking system and recruiting software that helps companies source, hire, and onboard top talent. With millions of job seekers and recruiters using Jobvite every year, the company needed to deliver an application experience that would strengthen loyalty and power retention. To do this, they enlisted AppDynamics.
“At Jobvite, balancing development speed, quality, and innovation concurrently is a challenge and we can’t afford to fail on any of these fronts,” says Ron Teeter, Chief Architect at Jobvite. “With AppDynamics’ new cloud-native capabilities, businesses can detect more issues early in development and resolve them before they become customer-impacting.
“AppDynamics allows us to shift left and get our most important products to market faster, while still delivering them with the high-quality standards our customers expect and deserve,” adds Teeter.
How it Works
AppDynamics maps the dynamic application service topology using its new flexible metadata model portrayed in Figure 1 above, and Amazon CloudWatch pulls the static infrastructure topology. Together, they identify places where these two topologies should be joined.
For example, when application services are deployed as load balanced sets of service instances with their own network interfaces, links representing requests flowing between application services may flow through VPC gateways, application load balancers, or other cloud network devices or services.
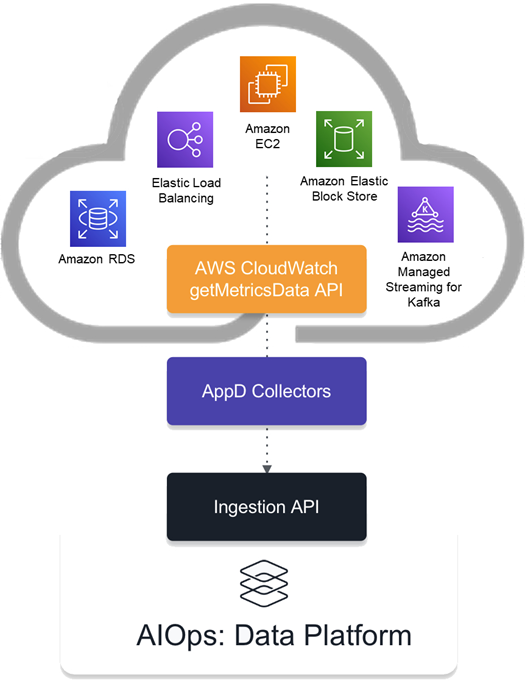
Figure 2 – Integration between AppDynamics Collectors and GetMetricData API.
As part of the new release, AppDynamics is collecting the following metrics through the GetMetricData API (subject to change in subsequent releases):
- Specific metrics: 10-20 metrics each for the supported AWS services. Following are some of the metrics AppDynamics collects using the API; not all of them are displayed in frontend, though.
- Amazon EC2: “CPUUtilization”, “DiskReadOps”, “DiskWriteOps”, “NetworkIn”, “NetworkOut”, “DiskReadBytes”, “DiskWriteBytes”, “NetworkPacketsIn”, “NetworkPacketsOut”.
- Amazon EBS: “VolumeReadBytes”, “VolumeWriteBytes”, “VolumeReadOps”, “VolumeWriteOps”, “VolumeTotalReadTime”, “VolumeTotalWriteTime”.
- Amazon RDS: “CPUUtilization”, “FreeableMemory”, “NetworkTransmitThroughput”, “DatabaseConnections” “BinLogDiskUsage”, “ReadIOPS”, “ReadLatency”, “ReadThroughput”, “WriteIOPS”, “WriteLatency”, “WriteThroughput”.
- Elastic Load Balancing: “HealthyHostCount”, “UnHealthyHostCount” “ActiveConnectionCount”, “ClientTLSNegotiationErrorCount”, “HTTPCode_ELB_XXX_Count”,“RequestCount”.
- Metrics per call: 100s to 1000s depending on the number of instances for each service type.
- The batch job runs every five minutes.
- Data can be collected across all regions.
More on AIOps, AppD data collectors, and how to configure AppDynamics cloud-native visualization can be found in the documentation.
Key Use Cases
The cloud-native release helps find answers to questions like this from key stakeholders:
DevOps: “I want to be able to explore cloud infrastructure topology views showing VPCs, API gateways, Amazon EC2 instances, and other cloud services to validate my application’s deployment to the cloud.”
- What entities do my application or service group consist of?
- What’s the deployment type for application service X (AWS, on-premises, etc.)?
- What other VPCs is this VPC connected to?
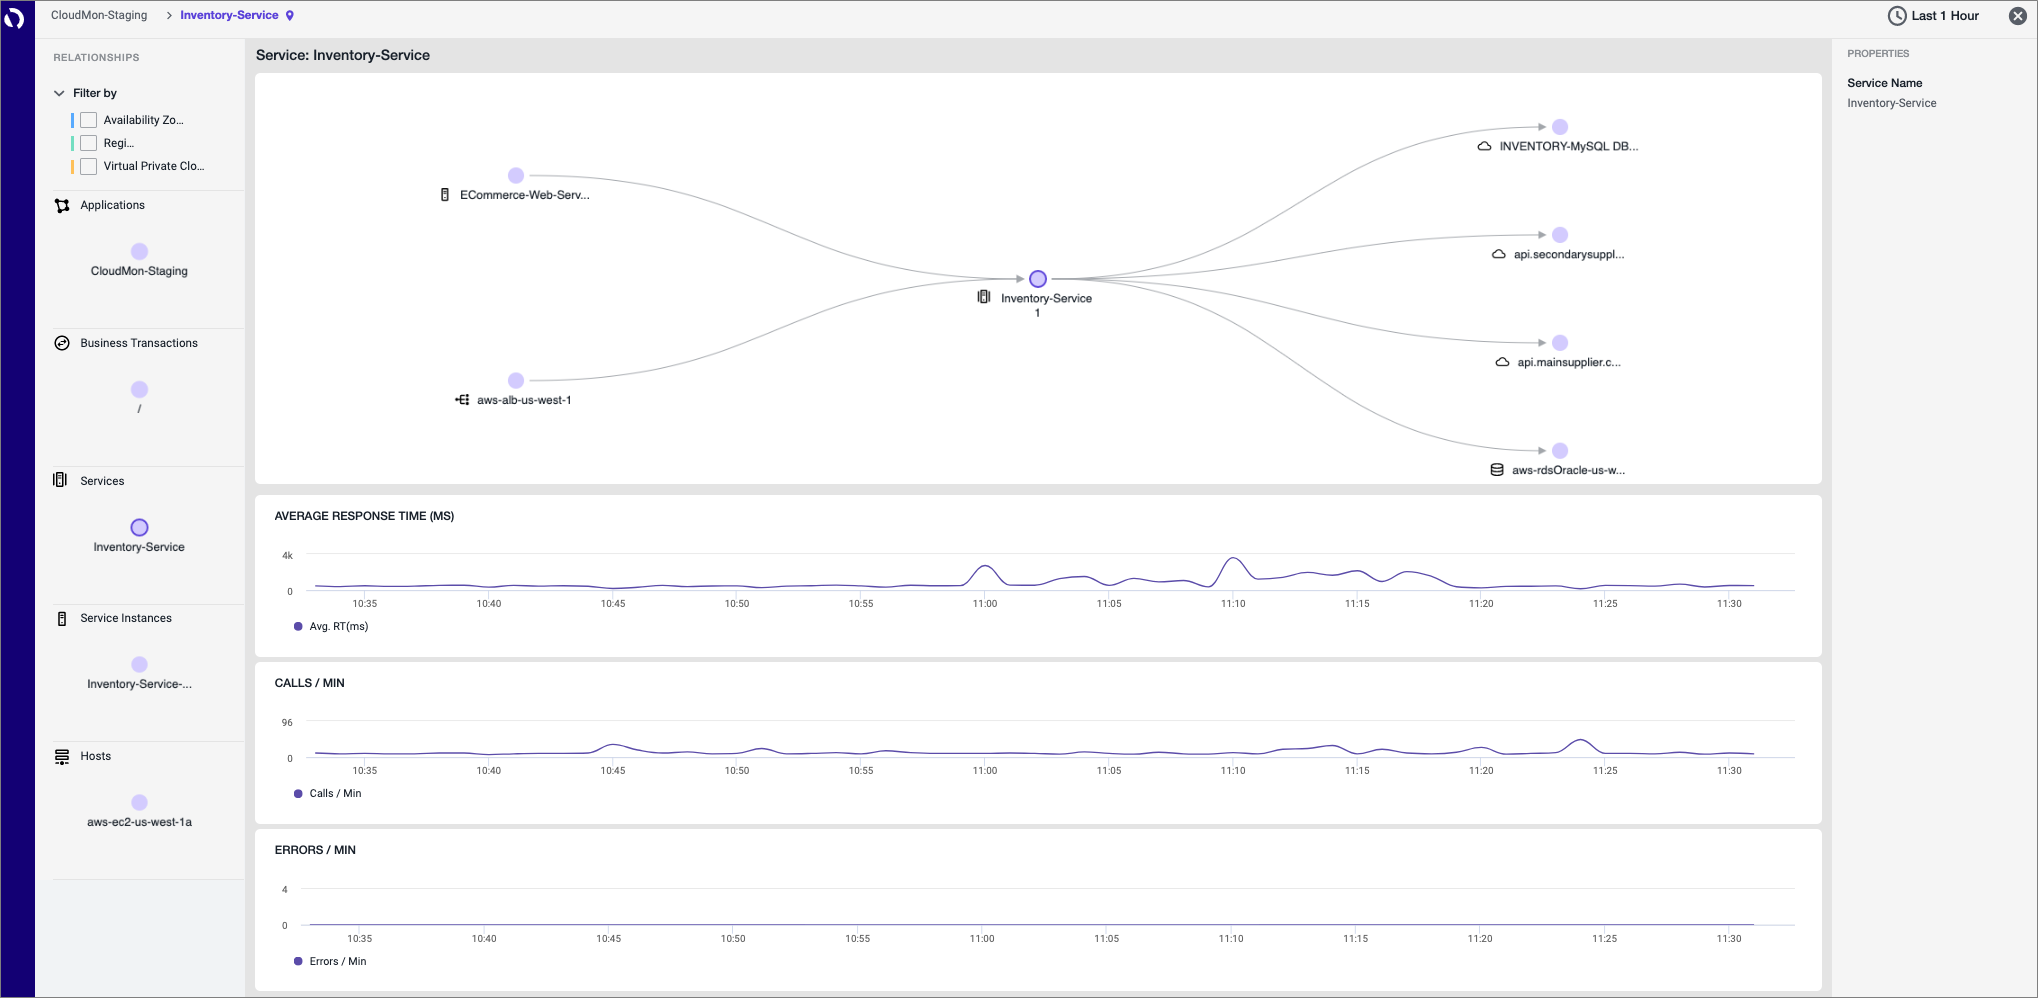
Figure 3 – Customer systems as a set of entities, relationships, interactions, and paths.
Site Reliability Engineering (SRE) or application ITOps: “I want to be able to explore a dynamic, dataflow-based application topology view, with the ability to drill down to the cloud infrastructure topology layer, to understand how these respective topologies intersect in the context of application services.”
- What services (apps) does my transaction run through?
- What’s the relationship between app service X and app service Y?
- What services or service instances is app service X interacting with and running on?
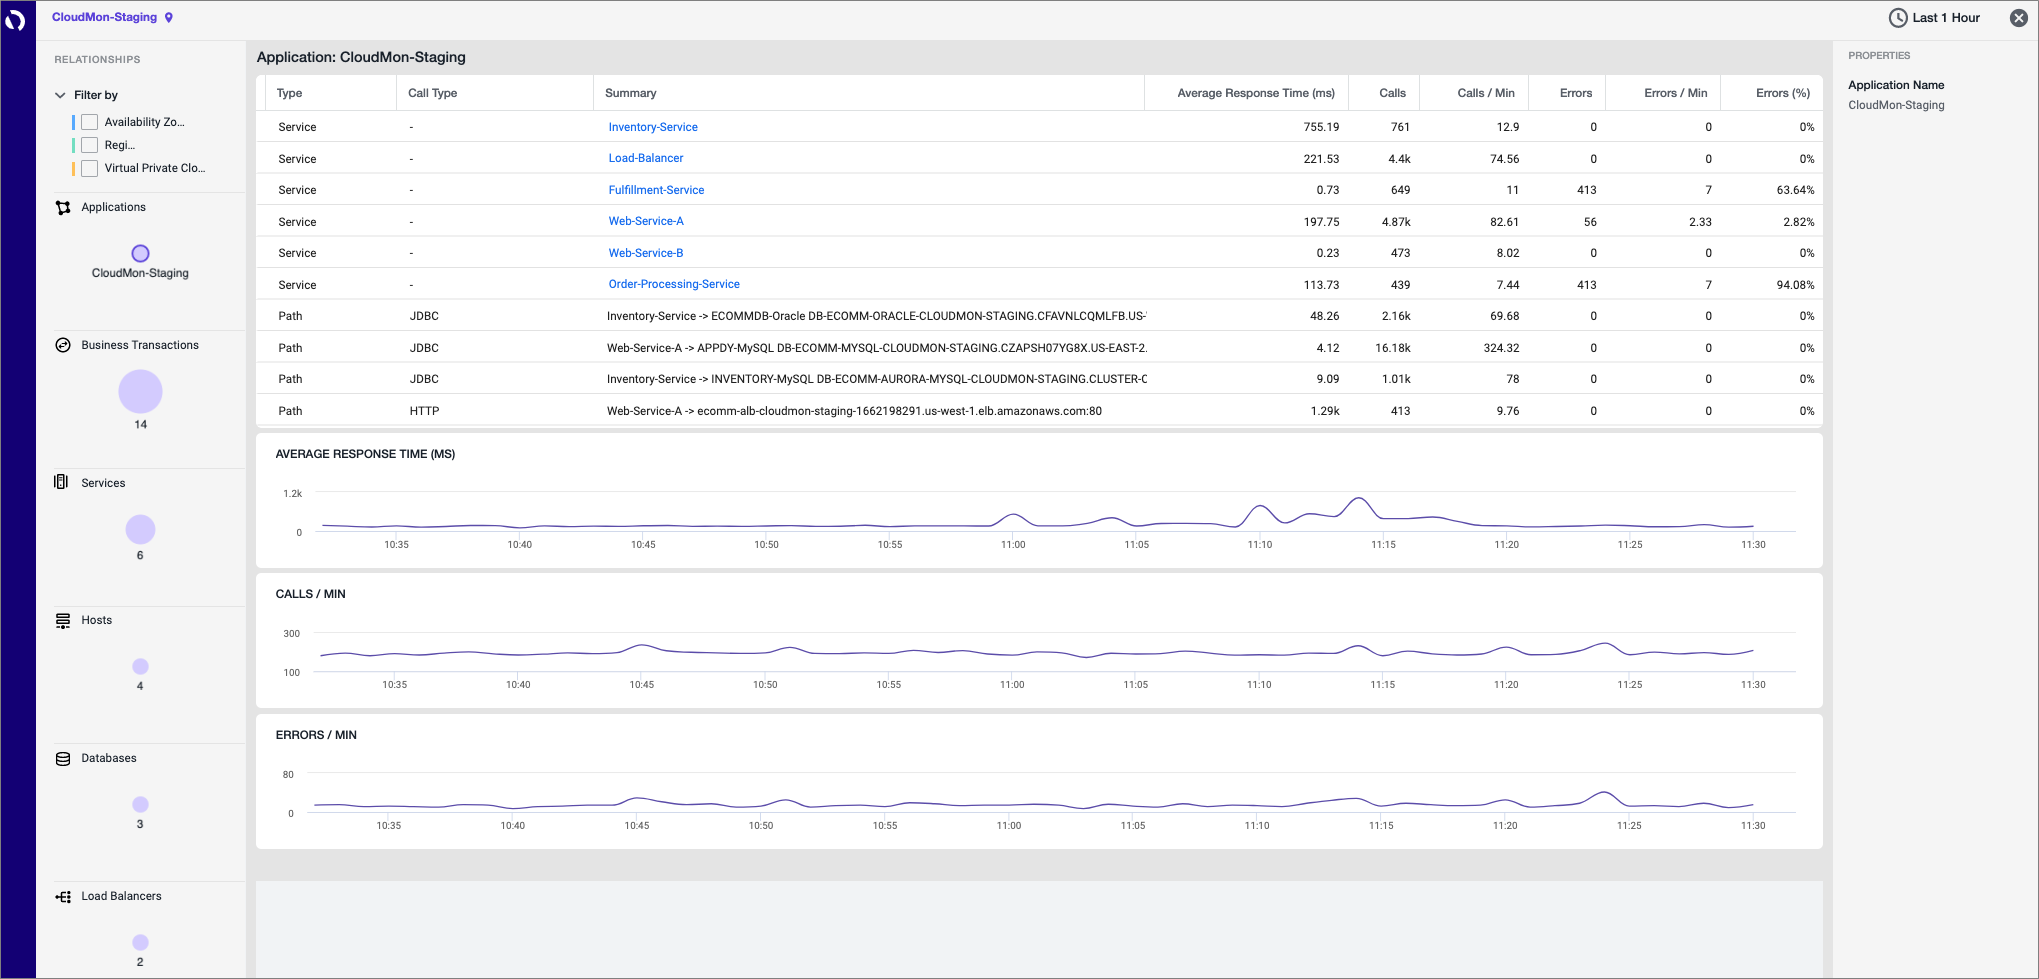
Figure 4 – Service availability dashboard for services.
Service owner (SRE or DevOps): “I want to precisely identify what infrastructure each of my service instances is (or was) executing on at any given moment in time.”
- What virtual machine or Amazon EC2 instance is the service instance executing in (if any)?
- What physical machine is the service instance executing in?
- How does the EC2 performance impact the application?
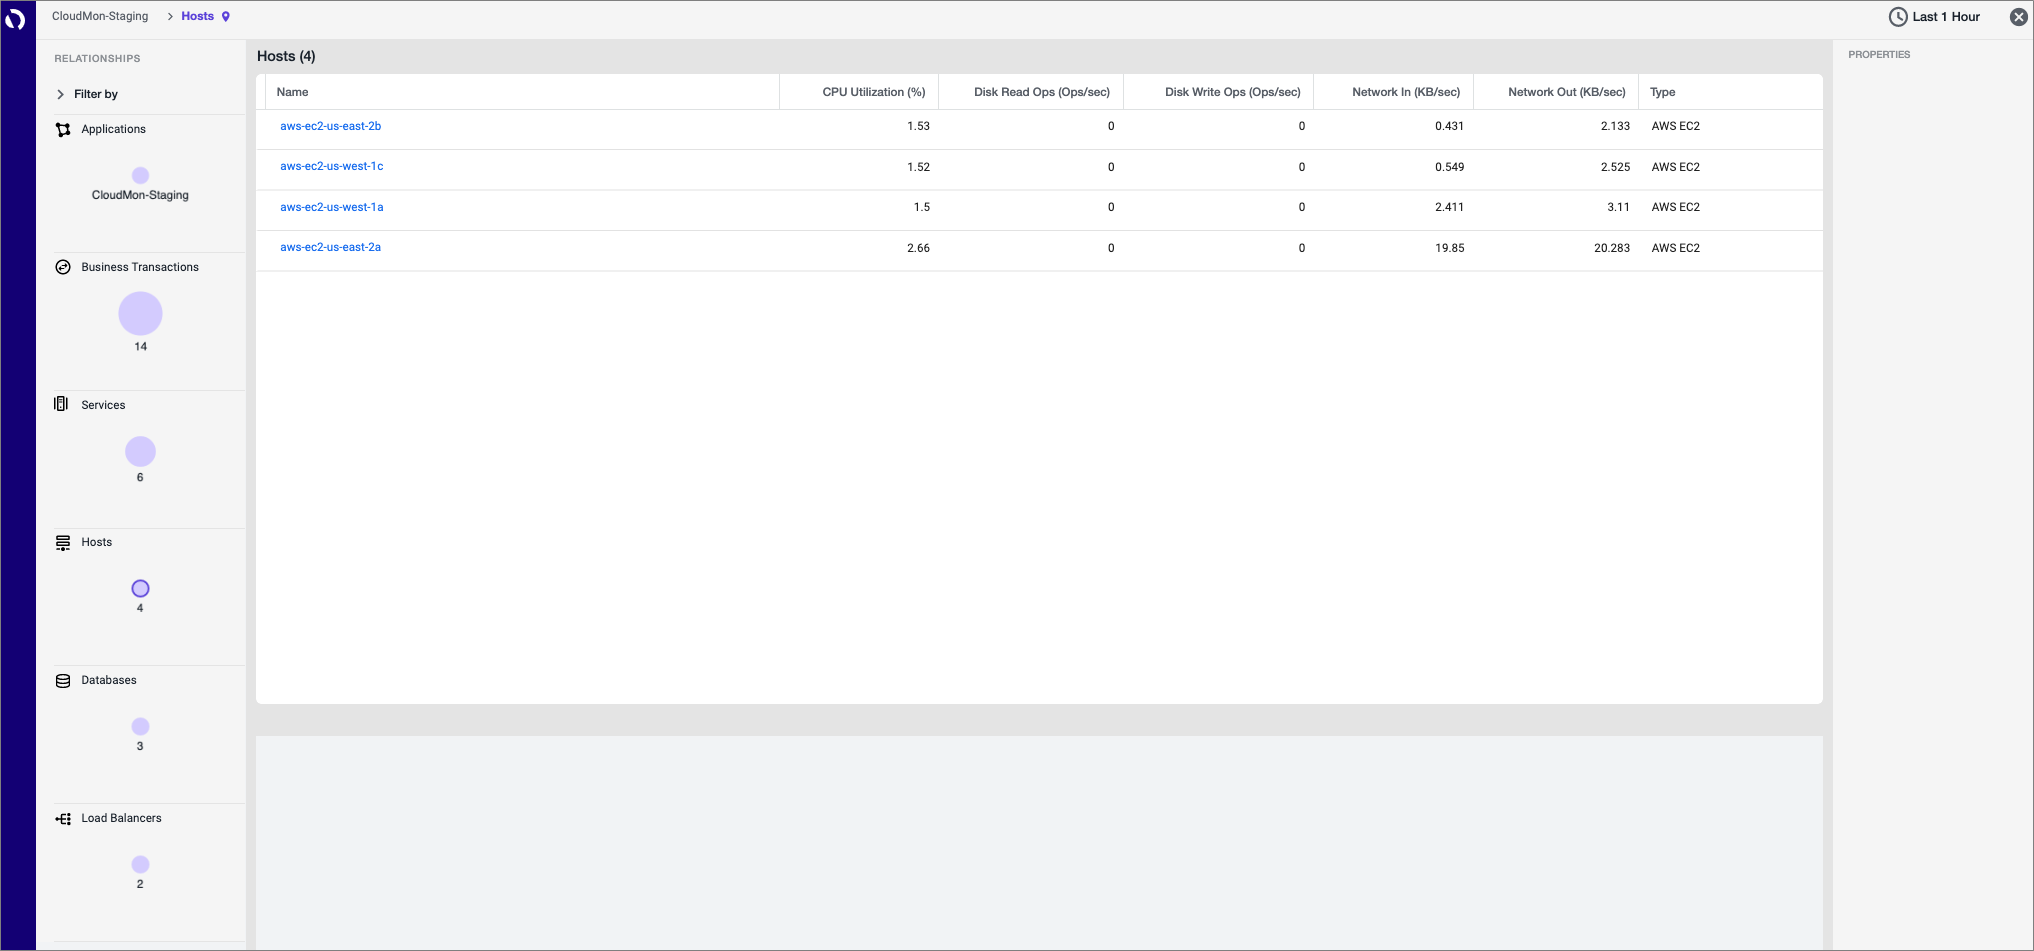
Figure 5 – Host details for Amazon EC2 instances.
Summary
Leveraging the Amazon CloudWatch GetMetricData API in AppDynamics’ new visualization interface allows customers to experience richer visibility into an AWS application’s topology.
Whether it’s through the dynamic component defined by data flowing through the application, or the static component constituting of infrastructure services metadata, this deeper level of insight allows customers to better understand the construct of their application and how application services connect to the underlying infrastructure components.
With the simplified topology map and intuitive navigation experience, DevOps, SRE, and ITOps users get fast confirmation that their deployment was successful, allowing them to immediately socialize the results of their work to the rest of the business in an easy-to-consume visualization.
See for yourself in this webinar with AppDynamics Product Manager Shrey Parekh and Solutions Architect Konr Ness, who show the new platform in action.
.

.
AppDynamics – AWS Partner Spotlight
AppDynamics (part of Cisco) is an AWS Advanced Technology Partner and application intelligence company that enables enterprises to have real-time insights into application performance.
Contact AppDynamics | Partner Overview | AWS Marketplace
*Already worked with AppDynamics? Rate the Partner
*To review an AWS Partner, you must be a customer that has worked with them directly on a project.