AWS Marketplace
Using Lumigo to debug AWS Lambda timeouts
Most AWS Lambda functions don’t perform CPU-intensive tasks that take a long time to complete. However, they often have to perform multiple input/output (I/O) operations in a single invocation. An invocation occurs when your application invokes a Lambda function. For example, they fetch data from an Amazon DynamoDB table, talk to third-party APIs such as Stripe, or communicate with other internal APIs in your application. Sometimes these I/O operations don’t complete quickly, and your function times out while waiting for a response.
A Lambda function’s timeout is one of the trickier problems to debug for the following reasons:
- Lambda doesn’t report a separate error metric for timeouts, so timeout errors are mixed in with other, generic errors.
- Lambda functions often have to perform multiple I/O operations during an invocation, so there is more than one potential reason for the timeout.
- You have to rely on the absence of an indicator to tell you that the function timed out waiting for something to finish. This requires discipline to consistently signpost the start and end of every operation.
In this blog post, I show how to subscribe to and deploy Lumigo, available in AWS Marketplace, which helps you detect and troubleshoot Lambda timeouts.
Prerequisites
To use this solution, you need an AWS account with Lambda functions.
Runtime environments supported:
- JS-supported runtimes: 8.10, 10.x, 12.x, 14.x
- Python-supported runtimes: 3.6, 3.7, 3.8
- JVM-supported runtimes: Java 8
- .net-supported runtimes: 2.1, 3.1
Solution walkthrough
Connecting Lumigo to your account is automated. It takes a few minutes with no manual code changes.
A. Subscribe to Lumigo
To subscribe to Lumigo, do the following:
- In the AWS Marketplace Management Console search bar, enter Lumigo.
- On the Lumigo product page, choose Continue to subscribe.
- Under Contract options, choose the tier that best answers your requirements, and on the right side choose to Create Contract.
- In the dialog box, choose Pay now. Note you can also choose the Free Community tier which is a free tier, so you will not be charged for your traced Lambda invocations.
- Choose Set up your account.
B. Deploy Lumigo
To deploy Lumigo, do the following:
- After completing step A, you are redirected to Lumigo’s website. In the top right, choose Get Started.
- Choose a username (email) and password.
- Enter your name and company name.
- Choose Connect Lumigo. This deploys an AWS CloudFormation template to your account and provisions the necessary IAM role so Lumigo can monitor your application.
- Wait for the stack to complete.
- Through the onboarding wizard, select all of the functions you want to trace with Lumigo and choose Auto-Trace. After the onboarding, you can trace more functions via the Function tab in the navigation pane.
Congratulations! Now you can gain more in-depth insight into what your serverless application is doing and debug problems in production quickly.
Lumigo has a free tier, and you can trace up to 150,000 Lambda invocations per month for free. If you require more than that, you can trace up to 10 million Lambda invocations per month by subscribing to one of our plans in AWS Marketplace.
How to debug Lambda timeouts
After you log in to Lumigo, in the navigation pane, choose the Issues tab. This page labels timeout issues against the relevant functions.
Choosing one of the issues takes you to the Functions page, which presents high-level information and metrics about the function. This page highlights the timed-out invocations. Choosing one of them directs you to the Transaction page. Lumigo can trace invocations through Amazon SNS, Amazon SQS, Amazon Kinesis Data Streams, DynamoDB Streams, Amazon EventBridge, and more.
The Transaction page displays the entire end-to-end transaction, including the function that timed out. The page contains the logs for all of the functions that were part of this transaction and a visual diagram of the architecture components involved in the transaction. Choosing the Timeline tab on the Transaction page displays a timeline of everything that happened during this transaction. Operations that are never completed are labeled N/A.
The following image shows an example of a timeout and its root cause: the HTTP endpoint didn’t respond within six seconds.
![]()
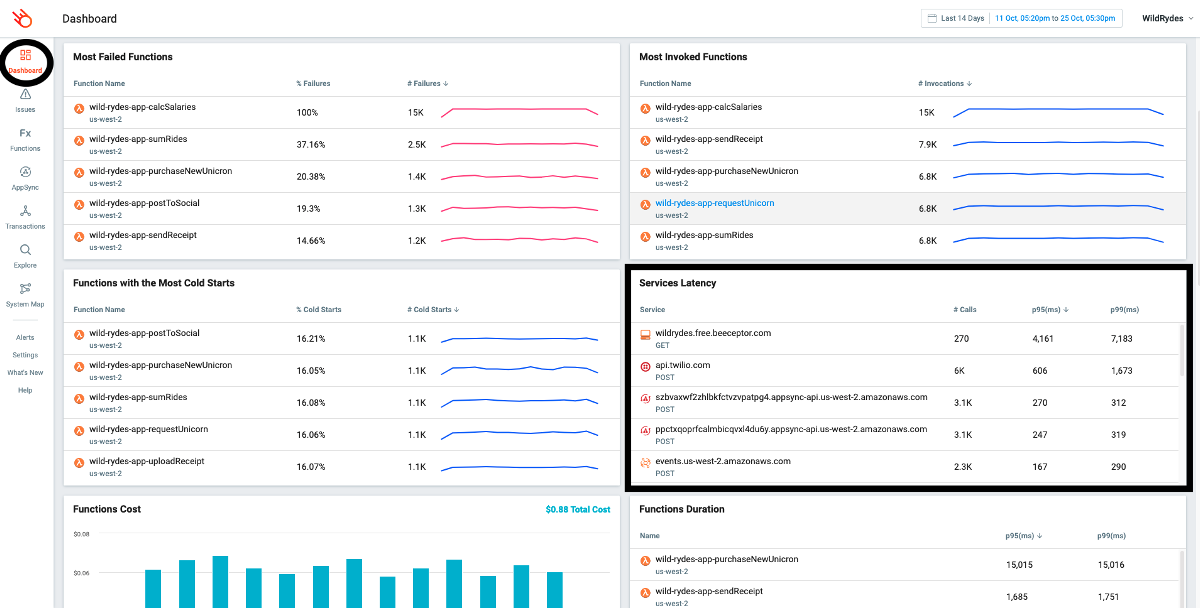
To determine if this is a one-off occurrence or a systemic performance issue with this service, in the navigation pane, choose Dashboard. The Service Latency widget on the bottom right shows you the tail latency for services that you’re calling from your Lambda functions, as shown in the following image. By default, this widget is sorted by the p95 (ms) column. It enables you to identify slow dependencies. The following screenshot shows the dashboard with the Service Latency widget highlighted.
Choosing any of the latency values takes you to the Explore page, displaying the relevant transactions where those tail latencies were recorded. This enables you to identify other cases where this service has responded slowly. Based on this information, you can make a more informed decision about whether to optimize this service (if it’s an internal API) or replace it (if it’s a third-party service).
Conclusion
In this blog post, I showed how to use Lumigo to debug timeout errors with Lambda and identify slow dependencies. Lumigo requires no manual instrumentation, and you can sign up today for a free account and trace up to 150,000 Lambda invocations.
Disclaimer:
The content and opinions in this post are those of the third-party author and AWS is not responsible for the content or accuracy of this post.
About the author
Yan Cui, AWS Serverless Hero, developer advocate at Lumigo

Yan is an experienced engineer who has run production workloads at scale in AWS for over 10 years. He has been an architect and principal engineer with various industries ranging from banking, e-commerce, and sports streaming to mobile gaming. He has worked extensively with serverless technologies in production since 2015. Nowadays, he splits his time between advancing the state of serverless observability as a developer advocate at Lumigo and helping companies worldwide adopt serverless as an independent consultant.
Yan is an AWS Serverless Hero and a regular speaker at user groups and conferences internationally. He is also the author of Production-Ready Serverless and co-author of Serverless Architectures on AWS, Second Edition, both by Manning. He keeps an active blog at https://theburningmonk.com and hosts a weekly podcast at https://realworldserverless.com.