AWS Big Data Blog
Analyze Google Analytics data using Upsolver, Amazon Athena, and Amazon QuickSight
In this post, we present a solution for analyzing Google Analytics data using Amazon Athena. We’re including a reference architecture built on moving hit-level data from Google Analytics to Amazon S3, performing joins and enrichments, and visualizing the data using Amazon Athena and Amazon QuickSight. Upsolver is used for data lake automation and orchestration, enabling customers to get started quickly.
Google Analytics is a popular solution for organizations who want to understand the performance of their web properties and applications. Google Analytics data is collected and aggregated to help users extract insights quickly. This works great for simple analytics. It’s less than ideal, however, when you need to enrich Google Analytics data with other datasets to produce a comprehensive view of the customer journey.
Why analyze Google Analytics data on AWS?
Google Analytics has become the de-facto standard web analytics tool. It is offered for free at lower data volumes and provides tracking, analytics, and reporting. It enables non-technical users to understand website performance by answering questions such as: where are users coming from? Which pages have the highest conversion rates? Where are users experiencing friction and abandoning their shopping cart?
While these questions are answered within the Google Analytics UI, there are however some limitation, such as:
- Data sampling: Google Analytics standard edition displays sampled data when running ad hoc queries on time periods that contain more than 500,000 sessions. Large websites can easily exceed this number on a weekly or even daily basis. This can create reliability issues between different reports, as each query can be fed by a different sample of the data.
- Difficulty integrating with existing AWS stack: Many customers have built or are in the process of building their data and analytics platform on AWS. Customers want to use the AWS analytics and machine learning capabilities with their Google Analytics data to enable new and innovative use cases.
- Joining with external data sources: Seeing the full picture of a business’ online activity might require combining web traffic data with other sources. Google Analytics does not offer a simple way to either move raw data in or out of the system. Custom dimensions in Google Analytics can be used, but they are limited to 20 for the standard edition and are difficult to use.
- Multi-dimensional analysis: Google Analytics custom reports and APIs are limited to seven dimensions per query. This limits the depth of analysis and requires various workarounds for more granular slicing and dicing.
- Lack of alternatives: Google Analytics 360, which allows users to export raw data to Google BigQuery, carries a hefty annual fee. This can be prohibitive for organizations. And even with this upgrade, the native integration is only with BigQuery, which means users still can’t use their existing AWS stack.
Building or buying a new web analytics solution (including cookie-based tracking) is also cost-prohibitive, and can interrupt existing workflows that rely on Google Analytics data.
Customers are looking for a solution to enable their analysts and business users to incorporate Google Analytics data into their existing workflows using familiar AWS tools.
Moving Google Analytics data to AWS: Defining the requirements
To provide an analytics solution with the same or better level of reporting as Google Analytics, we designed our solution around the following tenets:
- Analytics with a low technical barrier to entry: Google Analytics is built for business users, and our solution is designed to provide a similar experience. This means that beyond ingesting the data, we want to automate the data engineering work that goes into making the data ready for analysis. This includes data retention, partitioning, and compression. All of this work must be done under the hood and remain invisible to the user querying the data.
- Hit-level data: Google Analytics tracks clickstream activity based on Hits – the lowest level of interaction between a user and a webpage. These hits are then grouped into Sessions – hits within a given time period, and Users – groups of sessions (more details here). The standard Google Analytics API is limited to session and user-based queries, and does not offer any simple way of extracting hit-level data. Our solution, however, does provide access to this granular data.
- Unsampled data: By extracting the data from Google Analytics and storing it on Amazon S3, we are able to bypass the 500K sessions limitation. We also have access to unsampled data for any query at any scale.
- Data privacy: If sensitive data is stored in Google Analytics, relying on third-party ETL tools can create risks around data privacy, especially in the era of GDPR. Therefore, our solution encrypts data in transit and relies exclusively on processing within the customer’s VPC.
Solution overview
The solution is built on extracting hit-level data and storing it in a data lake architecture on Amazon S3. We then use Amazon Athena and Amazon QuickSight for analytics and reporting. Upsolver, an AWS premier solution provider, is used to automate ingestion, ETL and data management on S3. Upsolver also orchestrate the entire solution with a simple-to-use graphical user interface. The following diagram shows the high level architecture of our solutions.
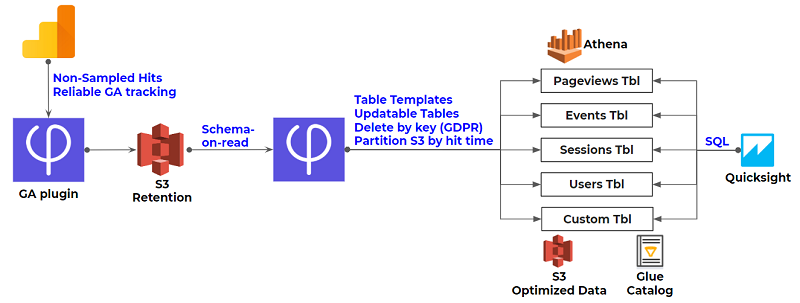
Using Upsolver’s GA connector we extract unsampled, hit-level data from Google Analytics. This data is then automatically ingested according to accepted data lake best practices and stored in an optimized form on Amazon S3. The following best practices are applied to the data:
- Store data in Apache Parquet columnar file format to improve read performance and reduce the amount of data scanned per query.
- Partition data by event (hit) time rather than by API query time.
- Perform periodic compaction by which small files are merged into larger ones improving performance and optimizing compression.
Once data is stored on S3, we use Upsolver’s GUI to create structured fact tables from the Google Analytics data. Users can query them using Amazon Athena and Amazon Redshift. Upsolver provides simple to use templates to help users quickly create tables from their Google Analytics data. Finally, we use Amazon QuickSight to create interactive dashboards to visualize the data.
The result is a complete view of our Google Analytics data. This view provides the level of self-service analytics that users have grown accustomed to, at any scale, and without the limitations outlined earlier.
Building the solution: Step by step guide
In this section, we walk through the steps to set up the environment, configure Upsolver’s Google Analytics plugin, extract the data, and begin exploring.
Step 1: Installation and permissions
- Sign up for Upsolver (can also be done via the AWS Marketplace).
- Allow Upsolver access to read data from Google Analytics and add new custom dimensions. Custom dimensions enable Upsolver to read non-sampled hit-level data directly from Google Analytics instead of creating parallel tracking mechanisms that aren’t as trust-worthy.
- To populate the custom dimensions that were added to Google Analytics, allow Upsolver to run a small JavaScript code on your website. If you’re using GA360, this is not required.
Step 2: Review and clean the raw data
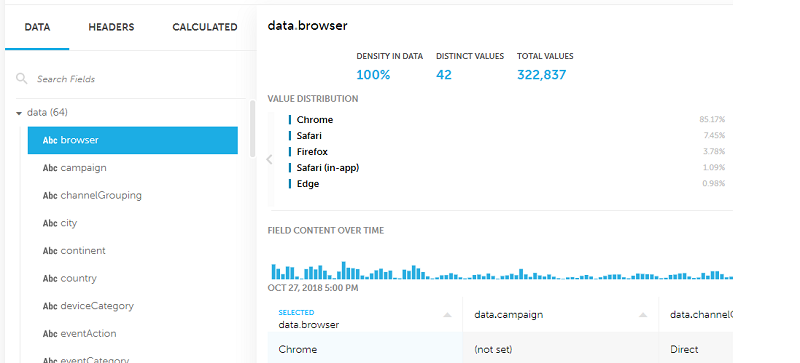
For supported data sources, Upsolver automatically discovers the schema and collects key statistics for every field in the table. Doing so gives users a glimpse into their data.
In the following screenshot, you can see schema-on-read information on the left side, stats per field and value distribution on the right side.
Step 3: Publishing to Amazon Athena
Upsolver comes with four templates for creating tables in your AWS based data lake according to the Google Analytics entity being analyzed:
- Pageviews – used to analyze user flow and behavior on specific sections of the web property using metrics such as time on page and exit rate.
- Events – user-defined interactions such as scroll depth and link clicks.
- Sessions – monitor a specific journey in the web property (all pageviews and events).
- Users – understand a user’s interaction with the web property or app over time.
All tables are partitioned by event time, which helps improve query performance.
Upsolver users can choose to run the templates as-is, modify them first or create new tables unique to their needs.
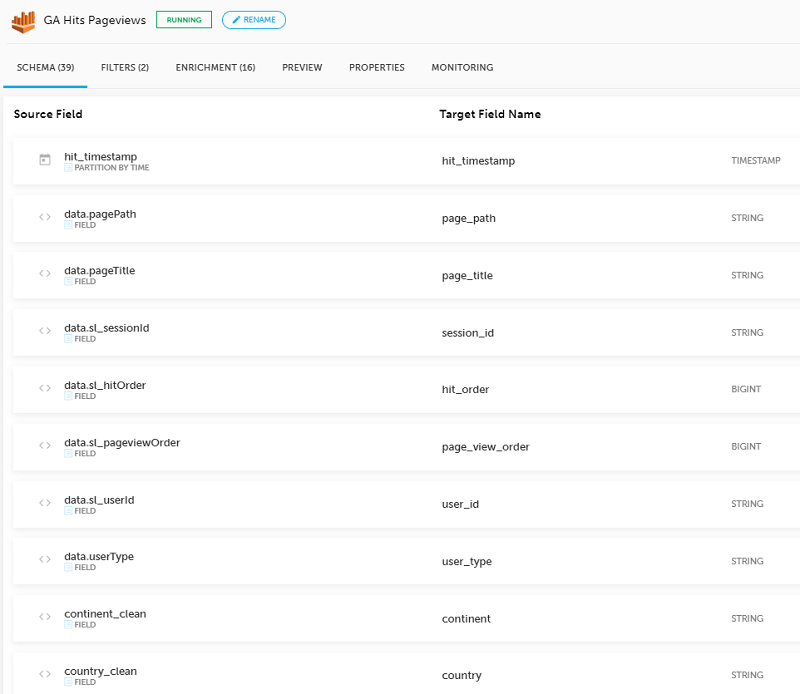
The following screenshot shows the schema produced by the Pageviews template:
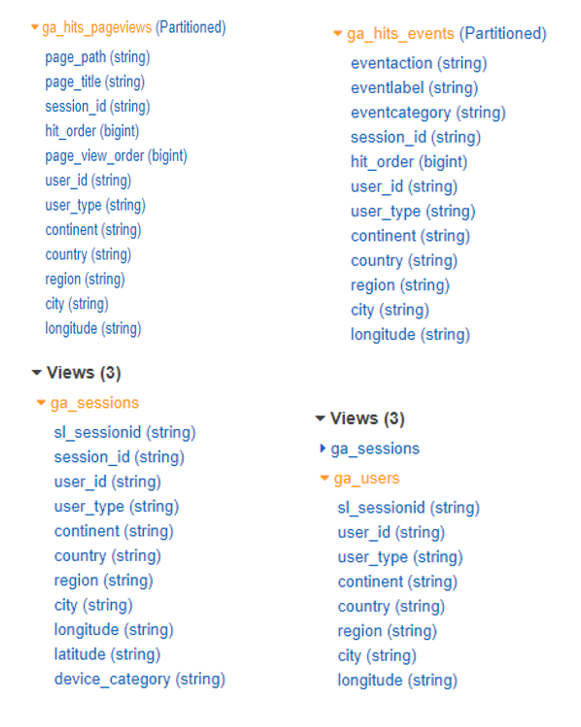
The following screenshot shows the Pageviews and Events tables as well as the Amazon Athena views for Sessions and Users generated by the Upsolver templates.
The following are a couple example queries you may want to run to extract specific insights:


 Roy Hasson is the global business development lead of analytics and data lakes at AWS.
He works with customers around the globe to design solutions to meet their data processing, analytics and business intelligence needs. Roy is big Manchester United fan, cheering his team on and hanging out with his family.
Roy Hasson is the global business development lead of analytics and data lakes at AWS.
He works with customers around the globe to design solutions to meet their data processing, analytics and business intelligence needs. Roy is big Manchester United fan, cheering his team on and hanging out with his family. Eran Levy is the director of marketing at Upsolver.