AWS Big Data Blog
Build seamless data streaming pipelines with Amazon Kinesis Data Streams and Amazon Data Firehose for Amazon DynamoDB tables
February 9, 2024: Amazon Kinesis Data Firehose has been renamed to Amazon Data Firehose. Read the AWS What’s New post to learn more.
August 30, 2023: Amazon Kinesis Data Analytics has been renamed to Amazon Managed Service for Apache Flink. Read the announcement in the AWS News Blog and learn more.
The global wearables market grew 35.1% year over year during the third quarter of 2020, with total shipments reaching 125 million units according to new data from the International Data Corporation (IDC) Worldwide Quarterly Wearable Device Tracker. The surge was driven by seasonality, new product launches, and the health concerns during the global pandemic.
Given the proliferation of smart watches and wristbands, we felt that this was a practical device to investigate to provide heart monitoring. All smart watches have an embedded Bluetooth communication system to receive and transmit data at various ranges. Remote monitoring typically involves collecting information from wearable devices at the edge, integrating that information into a data lake, and generating inferences that can then be served back to the relevant stakeholders. Additionally, in some cases, compute and inference must also be done at the edge to shorten the feedback loop between data collection and response.
You can use Amazon DynamoDB to capture high velocity data IoT device data to develop insights on fitness monitoring. It’s important to store these data points in a centralized data lake in real time, where it can be transformed, analyzed, and combined with diverse organizational datasets to derive meaningful insights and make predictions. As customers are using more and more wearable devices, companies are looking for ways to store high frequency data and perform meaningful analytics.
Amazon Kinesis Data Streams for DynamoDB enables you to directly send data from DynamoDB tables to Kinesis data streams. Additionally, you can leverage this feature for use cases that require longer data retention on the stream and fan-out to multiple, concurrent stream readers. You can also integrate with Amazon Kinesis Data Analytics or Amazon Data Firehose to publish data to downstream destinations such as Amazon OpenSearch Service, Amazon Redshift, or Amazon Simple Storage Service (Amazon S3).
In this post, you use Kinesis Data Streams for DynamoDB and take advantage of managed streaming delivery of DynamoDB data to other Kinesis Data Stream by simply enabling Kinesis streaming connection from Amazon DynamoDB console. To process DynamoDB events from Kinesis, you have multiple options: Amazon Kinesis Client Library (KCL) applications, Lambda, Kinesis Data Analytics for Apache Flink, and Data Firehose. In this post, you use Amazon Data Firehose to save the raw data in the S3 data lake and Amazon Athena to process the data.
Solution overview
The following diagram illustrates our solution architecture.

In this architecture, we use DynamoDB to drive a real-time application UI due to its capability to provides single-millisecond performance without the need to maintain underlying hardware. We use the rest of the pipeline to perform deeper analysis and generate business insights. Our heart rate clickstream data is stored in DynamoDB, with an end goal to reside in an S3 data lake. To achieve this goal, we enable streaming for DynamoDB tables in Kinesis Data Streams and push the data to Amazon Data Firehose, which seamlessly writes to Amazon S3. We can then use Amazon Athena to query S3 data and Amazon QuickSight to generate a custom dashboard with heart rate data.
You go through the following steps to build the end-to-end data pipeline:
- Create a DynamoDB table.
- Deploy the heart rate simulator.
- Deploy the automated data pipeline (Kinesis Data Streams, Amazon Data Firehose, and Amazon S3 resources) using AWS CloudFormation.
- Enable Kinesis data streaming for DynamoDB.
- Transform the records with a Lambda function and Data Firehose.
- Analyze the data using Athena.
- Create a QuickSight dashboard.
Create a DynamoDB table
First you need to create a DynamoDB table to receive the data coming from the heart rate sensors.
- On the DynamoDB console, choose Create table.
- For Table name, enter a name (for this post, we enter
heartrate-ddb-dev). - Add the partition key id.
- Choose Create table.
The following screenshot shows the completed table on the Tables page.

Deploy the heart rate data simulator
To replicate a real-life scenario, you need a heart rate data simulator. You can simulate this data by creating a shell script and deploying it on your local machine with AWS Command Line Interface (AWS CLI).
Complete the following steps to deploy the script and access AWS resources from your local machine:
- Install the AWS CLI on your local machine.
- Configure the AWS CLI using the
aws configurecommand:
If you don’t have your access key ID and secret key ID, see Access key ID and secret access key for instructions on how to get them.
- Create a shell script
HeartRate.shand enter the following code (remember to use the same DynamoDB table name you created earlier):
The code starts writing records into the DynamoDB table when you run it.
- Run the script using command
./HeartRate.shin the same folder where script resides.
The preceding script generates five random records containing SensorID, Heartrate, ID, and Timestamp, and pushes them to the DynamoDB table. You can adjust the number of records by changing the value in the while loop.
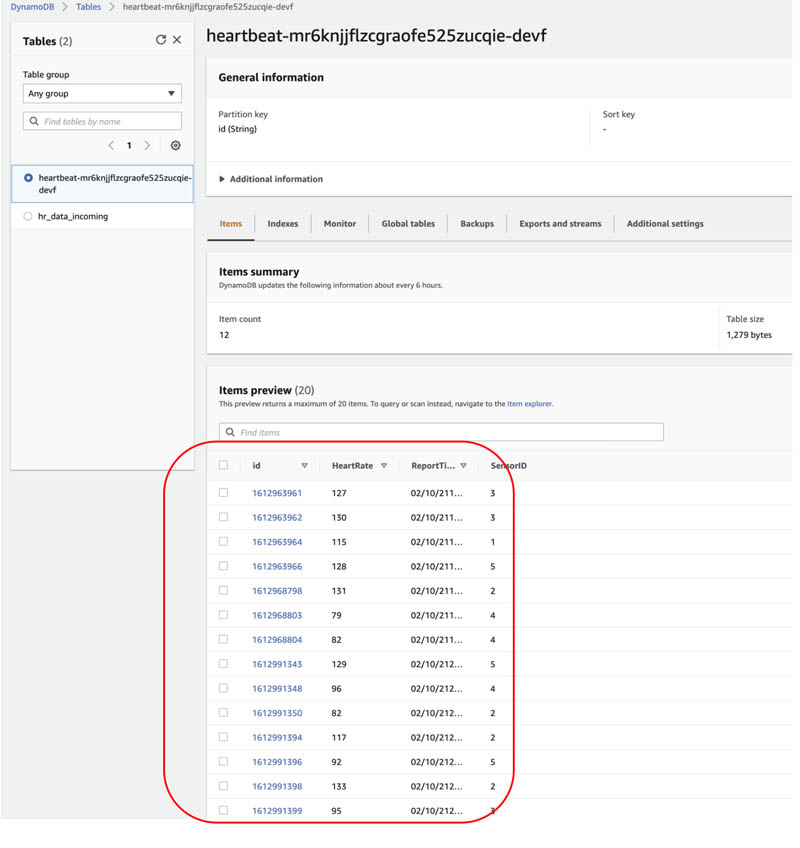
To see the data in DynamoDB, navigate to the table on the DynamoDB console and choose the Items tab.
Now that the heart rate data simulator is ready, let’s deploy the rest of the data pipeline.
Deploy the automated data pipeline
We use CloudFormation templates to create all the necessary resources. This removes opportunities for manual error, increases efficiency, and ensures consistent configurations over time.
- Launch the template by clicking on below button. Make sure to use the US West (Oregon) Region (
us-west-2).

- Give Amazon S3 bucket name. Make sure bucket-name should be unique as per suggested naming guideline. Change pre-populated stack name as per you requirement and click on Next button.

- Select I acknowledge that AWS CloudFormation might create IAM resources with custom names and Choose Create stack.

This AWS CloudFormation template creates the following resources in your AWS account:
-
- A Kinesis data stream to replicate data from the DynamoDB table
- An AWS Identity and Access Management (IAM) role to provide a trust relationship between Kinesis Data Streams and DynamoDB to replicate data from the table to the data stream
- A destination S3 bucket to store and analyze data
- A Data Firehose delivery stream with the required IAM role to get data from the data stream and store it in the S3 bucket
- When the stack is ready, navigate to the stack’s Outputs tab and record the values for the following keys to use later:
- DestinationBucket
- KinesisDataFirehose
- KinesisDataStreams

Enable Kinesis Data Streams for DynamoDB
The Kinesis Data Streams for DynamoDB feature enables you to send data from DynamoDB to a Kinesis data stream in addition to DynamoDB Streams. With this new functionality, you can have your data in both DynamoDB and Kinesis without having to use Lambda or write custom code. Complete the following steps to enable Kinesis Data Streams for DynamoDB:
- On the DynamoDB console, in the navigation pane, choose Tables.
- Choose the table you created.
- On the Overview tab, under Kinesis data stream details, choose Manage streaming to Kinesis.

- From the drop-down menu, choose the stream created as part of the CloudFormation template (
samplestream).

- Choose Enable.

- Choose Close.

Transform the data with Lambda and Amazon Data Firehose
By default, Data Firehose sends JSON records inline, which causes Athena to query only the first record in each S3 object. To overcome this, we use a Lambda function to transform records before sending them to Amazon S3 by adding an end of line (EOL) character.
- Create a Lambda function containing the following code:
We now enable data transformation in the Firehose delivery stream.
- On the Data Firehose console, select the
samplefirehosestream.

- Choose Edit.

- In the section Transform source records with AWS Lambda, for Source record transformation, select Enable.
- For Lambda function, choose the function you just created (
testfunction).

- Choose Save.
Analyze the data with Athena
We can now create a database and table in Athena and query the data.
- On the Athena console, create the database
dbhrwith the following command: - Create a table using the following command:
- Choose Run query.

- Use the following SQL query to fetch the heart rate data:
The following screenshot shows the query output.

Create a QuickSight dashboard
To create a dashboard and visualize the data with QuickSight, complete the following steps:
- Sign in to the QuickSight console. If you don’t have a subscription for QuickSight, you can sign up for one.
- In the navigation pane, choose Datasets.
- Choose New dataset.

- For Data source name, enter a name.
- Choose Validate connection.
- Choose Create data source.

- For Database, choose the database you created (
dbhr). - For Tables, select the table you created (
heartratedata2021). - Choose Use custom SQL.

- Enter the same query you used in Athena:
- Choose Confirm query.
- Choose Edit/Preview data.
- Change the Time data type from String to Date.
- Use the date format dd/MM/yyHH:mm:ss.
- Choose Save & visualize.
You’re redirected to the dashboard.
- For Visual types, choose the vertical bar chart icon.
- Choose the fields to put in the chart.
- Change the time display as needed.
In the following visualization, we set the X axis as time and the Y axis as heart rate. We also changed the time display format to minutes.

Conclusion
This post showed you how to build a serverless pipeline to export OLTP data in DynamoDB to Amazon S3 for deeper analytics. This solution makes your team’s life easier so they can focus on solving business problems by getting useful insights immediately by sending DynamoDB data to a centralized S3 data lake.
You can follow a similar approach to export data to Amazon Redshift, Amazon OpenSearch Service, and a variety of analytics stores. There are several use cases in IoT and application development in which you need to move data quickly through an analytics pipeline—you can use this feature by enabling Kinesis Data Streams for DynamoDB tables.
Additional reading
For more information about using Kinesis Data Streams and DynamoDB, see the following:
- Building a real-time notification system with Amazon Kinesis Data Streams for Amazon DynamoDB and Amazon Kinesis Data Analytics for Apache Flink
- Build a data lake using Amazon Kinesis Data Streams for Amazon DynamoDB and Apache Hudi
About the authors
 Ashutosh Pateriya is a Solutions Architect and networking specialist working with Amazon Web Services. He is passionate about helping customers leverage the power of technology to solve real-world problems.
 Saurabh Shrivastava is a solutions architect leader and analytics/ML specialist working with global systems integrators. He works with AWS partners and customers to provide them with architectural guidance for building scalable architecture in hybrid and AWS environments. He enjoys spending time with his family outdoors and traveling to new destinations to discover new cultures.
 Elie Gharios is a Senior Product Manager for Amazon DynamoDB. He works with AWS engineering teams to offer AWS customers and partners scalable AWS services and solutions to their needs.