AWS Database Blog
Monitoring MySQL-compatible edition of Amazon Aurora Audit Events with Amazon CloudWatch
Chayan Biswas is a product manager at Amazon Web Services.
The Advanced Auditing capability in MySQL-compatible edition of Amazon Aurora allows you to capture detailed logs of database (DB) activity. You can choose what kind of information is collected: connects, queries, and tables affected by the queries, or any combination thereof. You can review these audit logs to ensure the correctness of changes to your databases and to detect any unwanted activity.
Aurora enables you to continuously monitor activity in your DB clusters by publishing these audit logs to Amazon CloudWatch Logs. In this post, you set up Aurora to send audit logs to CloudWatch Logs and create CloudWatch metrics and alarms to continuously monitor activity in Aurora DB clusters.
Let’s get started. For Aurora to publish audit logs to CloudWatch Logs, you need to complete first turn on Advanced Auditing in Aurora and then enable Aurora to publish audit logs to CloudWatch Logs.
As a prerequisite, you need a running Aurora DB cluster. To create an Aurora DB cluster, follow the steps in the MySQL-compatible edition of Amazon Aurora documentation.
Turn on Advanced Auditing in MySQL-compatible edition of Amazon Aurora
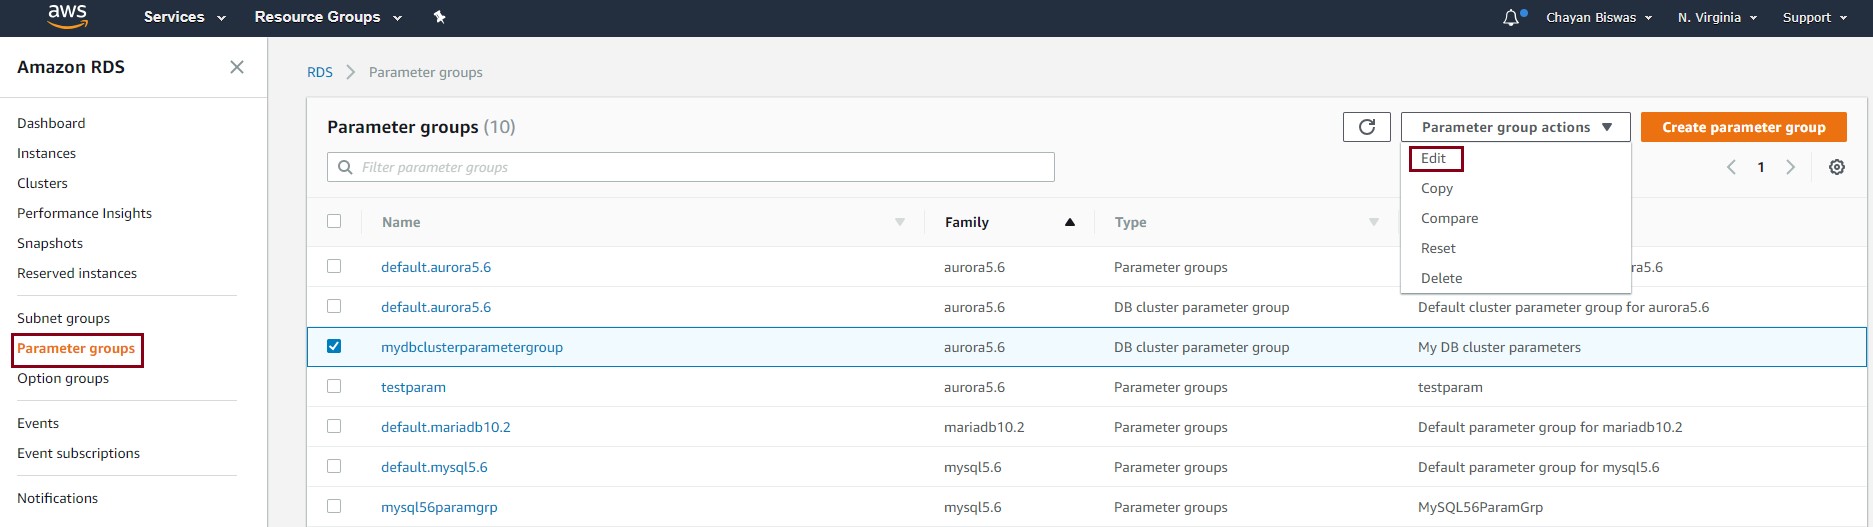
If you already have Advanced Auditing turned on for your Aurora cluster, you can move to the next section. To turn on Advanced Auditing for your Aurora DB cluster, sign in to the AWS Management Console and open the Amazon RDS console. In the left navigation pane, choose Parameter Groups. Then select the DB Cluster Parameter Group that is associated with your Aurora cluster, and choose Edit Parameters.
Search for “server_audit”—this will list all parameters that contain the search string. In the drop-down list next to server_audit_logging, choose 1. For server_audit_events, enter CONNECT, QUERY, TABLE, and then choose Save Changes.
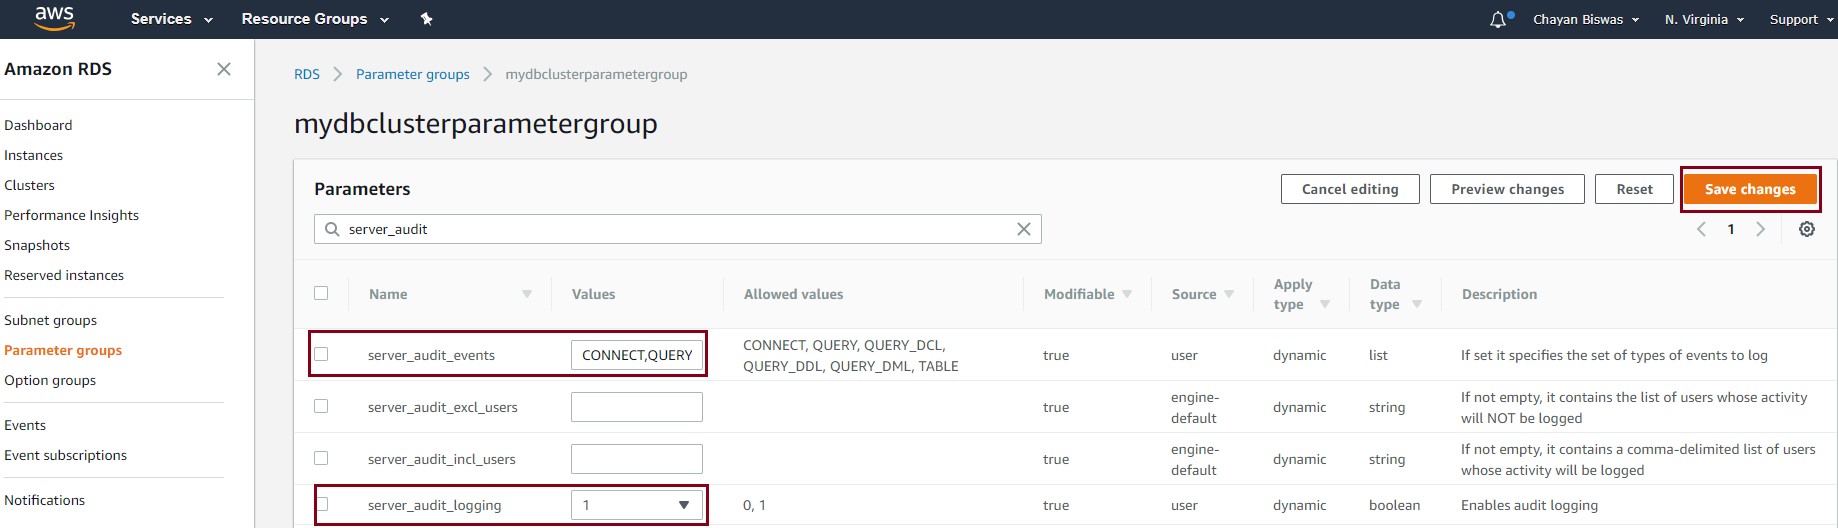
This turns on Advanced Auditing in your Aurora DB cluster and starts recording all supported audit events. You can change the server_audit_events parameter to select only a subset of audit events.
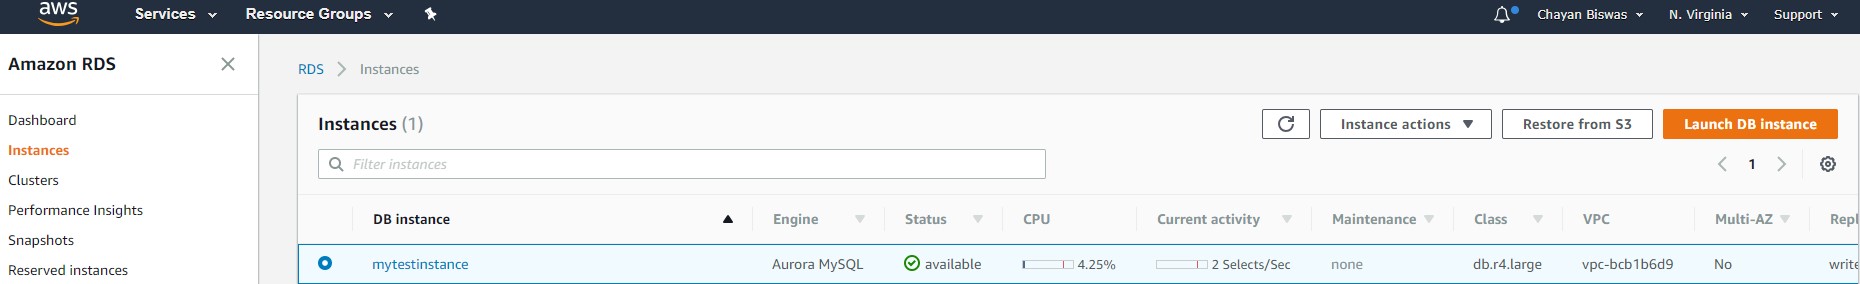
To view the logs, select your Aurora DB instance to view the details.
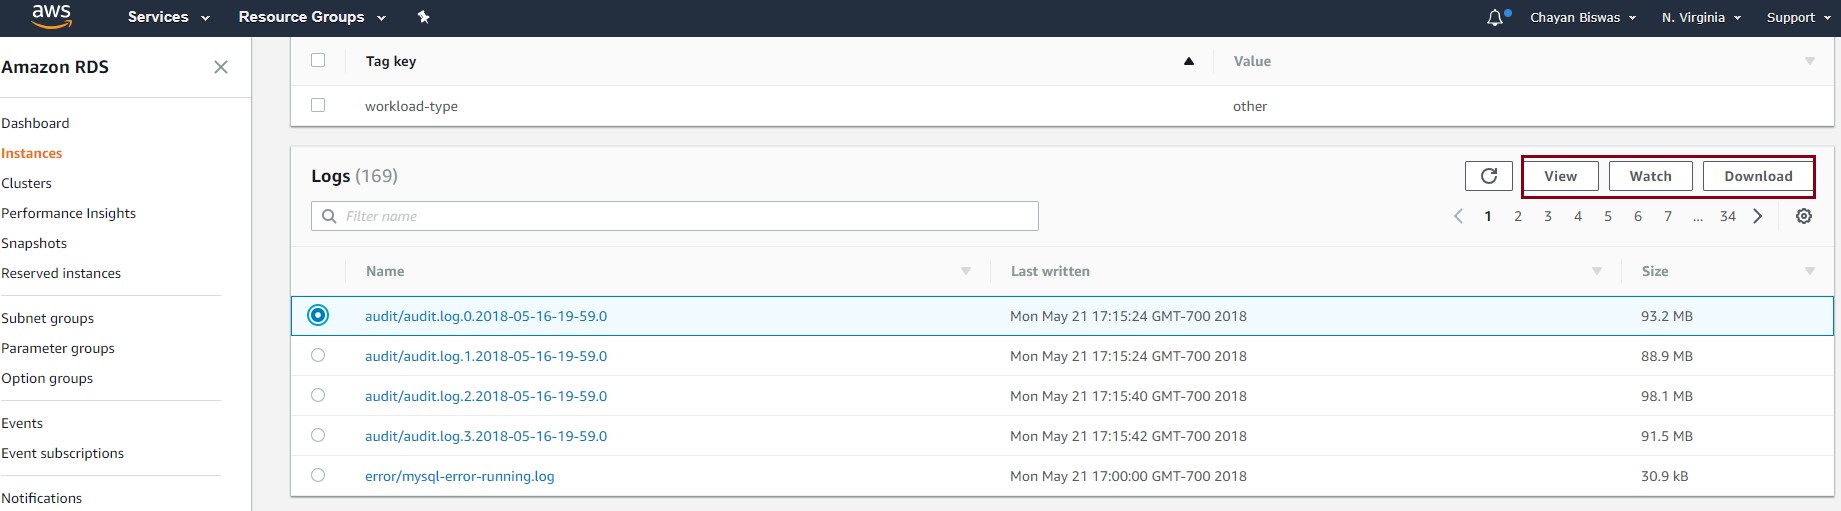
Scroll to Logs, select an audit log file, and then View, Watch ongoing updates to the log file or Download the file.
Enable Aurora to publish logs to CloudWatch Logs
The next step is to enable Aurora to start publishing audit logs to CloudWatch Logs. For this, open the Amazon RDS console and navigate to Clusters. Select your Aurora DB cluster, expand the Actions dropdown, and Modify the cluster. 
Scroll to Log exports, select Audit log and Continue.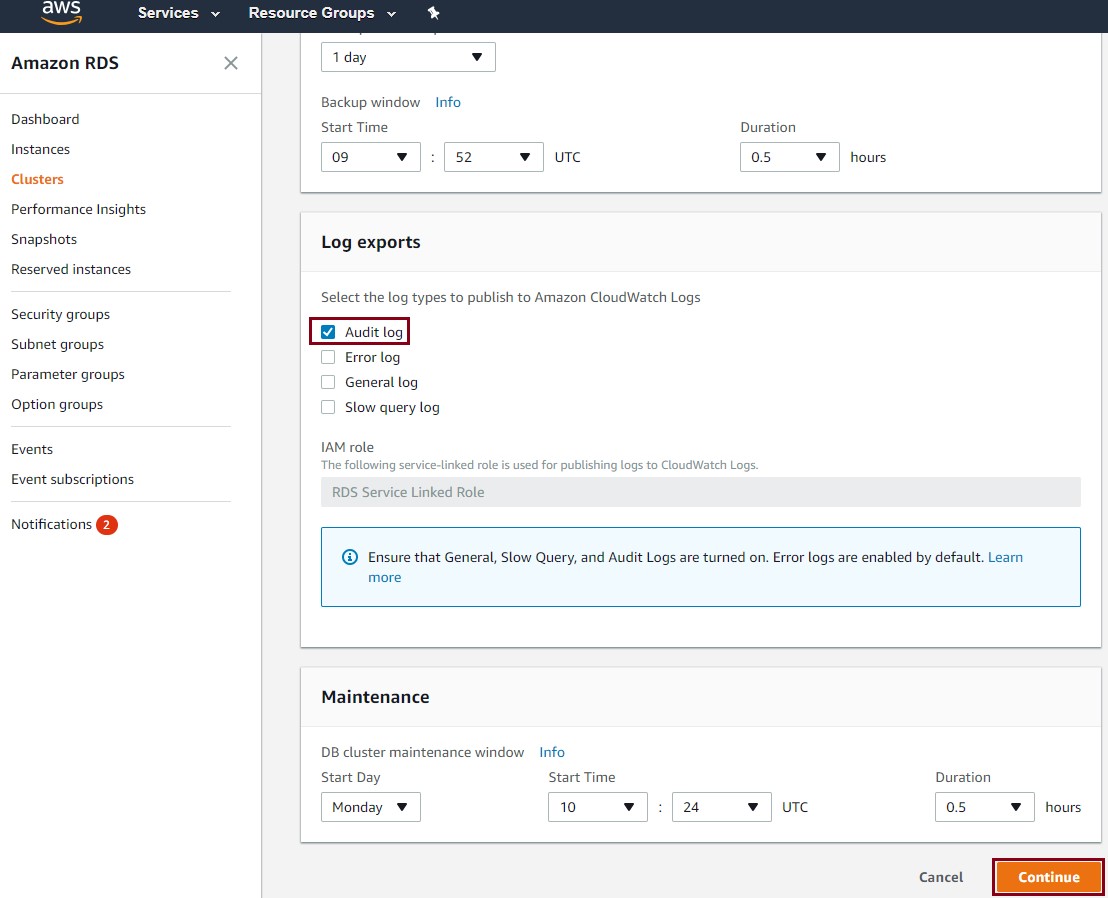
Confirm the changes and Modify cluster.
Aurora now begins sending events recorded in audit logs to CloudWatch Logs. Aurora typically delivers these events within seconds of them occurring. To view audit logs in CloudWatch Logs, open the Amazon CloudWatch console, and choose Logs. Filter the logs by prefix /aws/rds/cluster/<your cluster’s name>/audit, and select the log group.

You can view all the logs that are delivered to CloudWatch Logs by Aurora:

When your audit logs are available in CloudWatch Logs, you can do the following:
- Archive: Retain your logs for as long as you want.
- Search: Look for specific events across log files.
- Metrics: Set up CloudWatch metrics to measure activity in your Aurora DB cluster.
- Visualizations: Create graphs and dashboards to visualize your metrics, see how they change over time, and detect changes in patterns.
- Alarms: Create alarms to get notified or take actions whenever thresholds for your metrics are breached.
Let’s walk through each of these capabilities.
Archive
Audit logs in Aurora are rotated out when they reach 100 MB. With your audit logs in CloudWatch, you gain control over how long you retain your logs in CloudWatch Logs. By default, your logs are stored indefinitely in CloudWatch. You can specify how long you want CloudWatch to retain your logs. Open the CloudWatch console, choose Logs, locate your log group, and choose Expire Event After. From here, you can select a retention period that’s suitable for you.

Search
When your logs are available in CloudWatch Logs, you can search across your logs or a subset of logs by specific terms, phrases, or values. On the CloudWatch console, choose Logs, and then locate and select your log group. Choose Search Log Group to search across all your logs. You can also select specific log streams using the check boxes.

Let’s say that you’re interested in looking at all the failed connections to your Aurora cluster in the past five minutes. On the search page, select 5m (5 minutes), specify “FAILED_CONNECT” in the textbox, and press Enter to look up all audit log events that match this term:
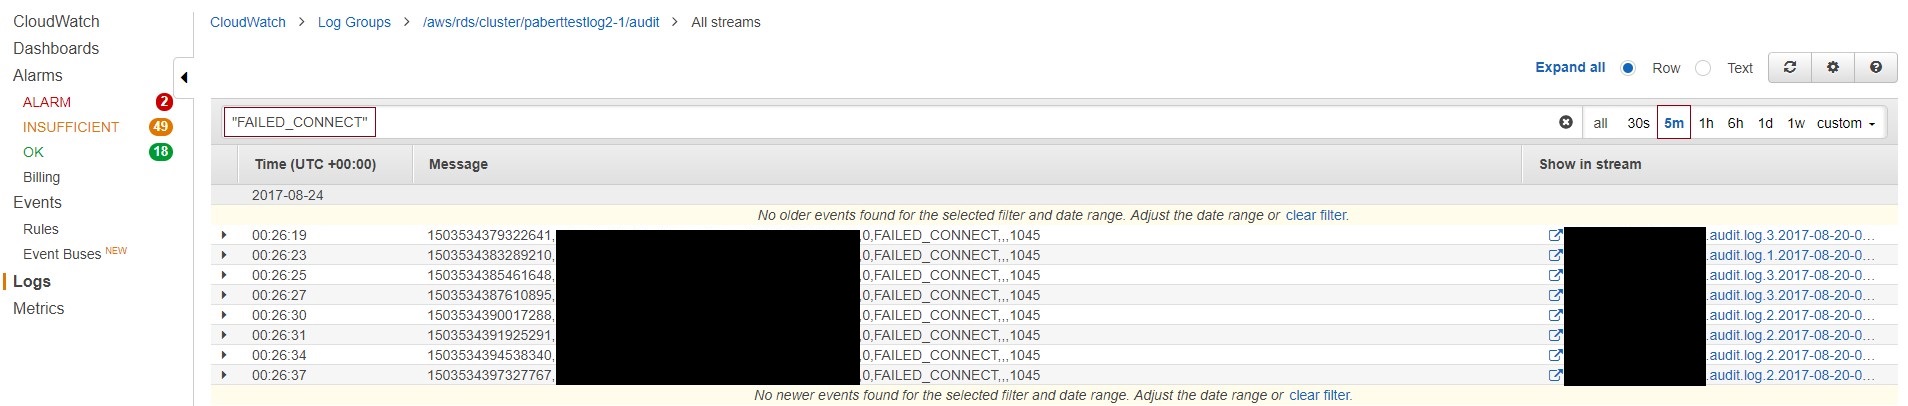
You can also perform more complex searches that include or exclude multiple terms. For example, the following filter looks up all queries except for SELECT and SHOW statements. It also excludes any queries run by the rdsadmin user.
For more information about searching log data in CloudWatch, see Filter and Pattern Syntax in the Amazon CloudWatch Logs documentation.
Note: To provide you with management services, Aurora creates the rdsadmin user when you create an Aurora DB cluster.
Metrics
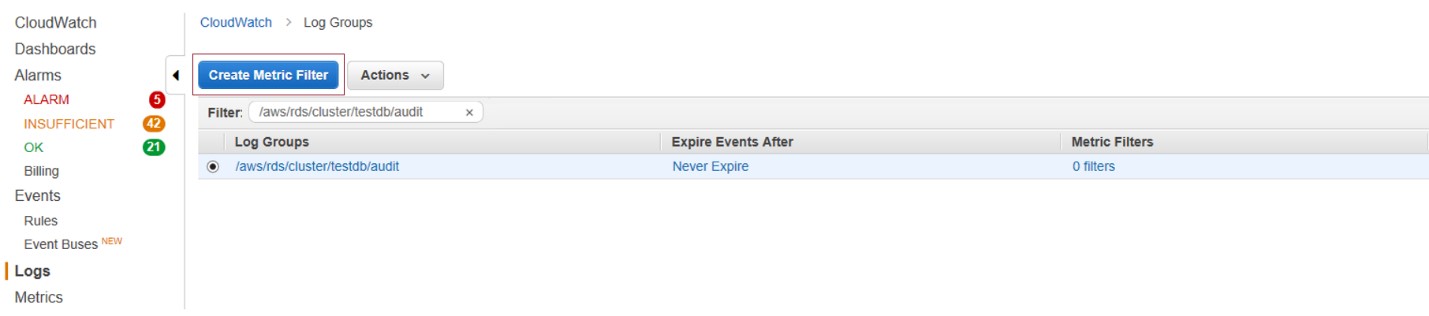
With CloudWatch metrics, you can define metrics that are related to activity in your Aurora cluster. Taking a cue from the previous section, let’s create a metric for failed connections. Back on the CloudWatch console, choose Logs, select your log group, and then choose Create Metric Filter.
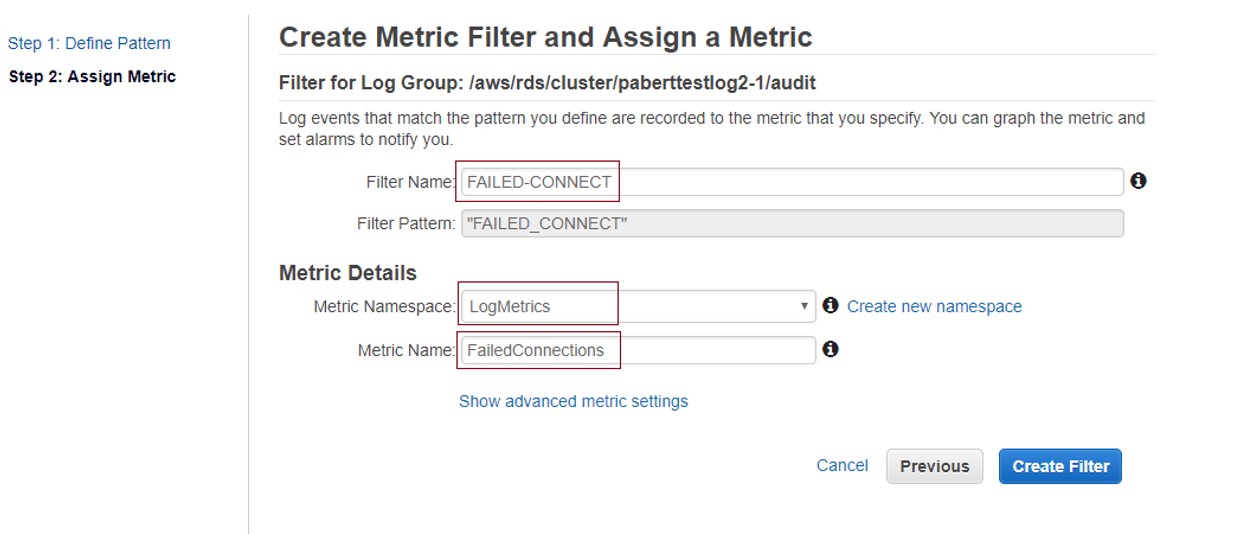
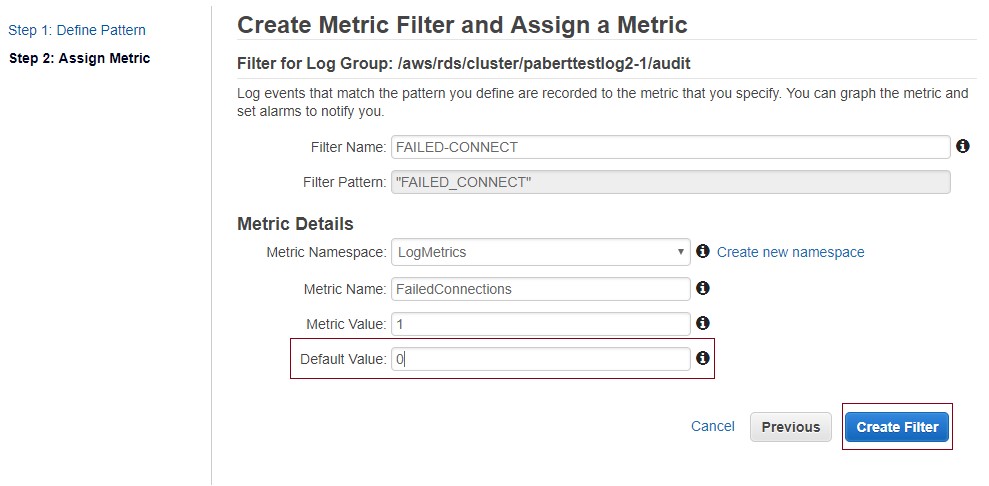
In Define Pattern, enter “FAILED_CONNECT” as the filter pattern, and then choose Assign Metric.

In Assign Metric, provide a name for the filter and the metric. Then choose the Metric Namespace that you want to create the metric in, and choose Show advanced metric settings.
In the advanced settings, for Default Value, type 0, and then choose Create Filter. Specifying a default value ensures that data is reported even during periods when no log events occur. This prevents spotty metrics where data sometimes does not exist.
Visualizations
You can view how your metrics are trending over time by visualizing them on a graph. On the CloudWatch console, choose Metrics, and then choose the Namespace in which you created the metric.
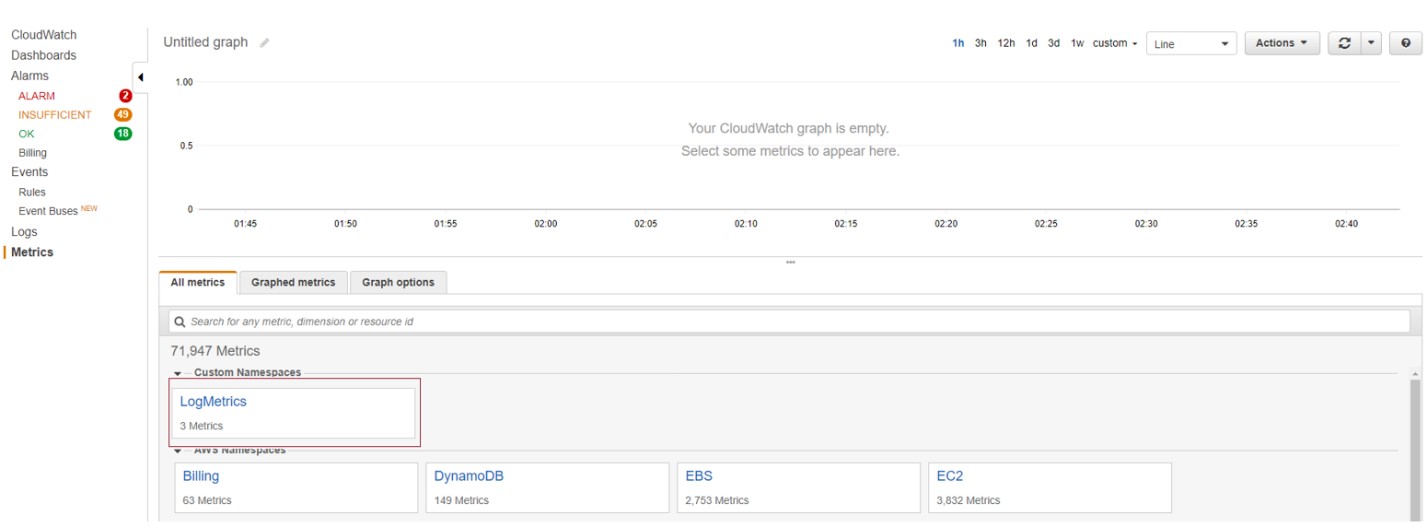
You can select one or more metrics that you want to visualize on the graph. If you want to retain the graph for future reference, give it a name, and save the graph.

You can also build operational dashboards by pulling together a combination of graphs. For more information about creating and using CloudWatch dashboards, see the AWS blog post CloudWatch Dashboards – Create & Use Customized Metrics Views.
Alarms
In the previous section, you created a new CloudWatch metric and viewed the history of this metric on a graph. With metrics, you can keep tabs on your Aurora DB clusters with visualizations that help you spot anomalies or trends. You might also want to know when your metrics go above or below thresholds that you define. For this, you can define an alarm to watch a metric. The alarm can send you notifications based on the value of the metric relative to thresholds over a time period.
Let’s continue with the example of the FailedConnections metric that you created in the previous section. An increase in failed connections could indicate that there’s an application with incorrect credentials trying to connect to your DB cluster. Or worse yet, it might mean that you have misconfigured inbound rules (e.g., /0 access) in your security group. (Read more about Security Groups in the Amazon RDS documentation.) Open access to your DB clusters could allow malicious actors to perform denial-of-service (DoS) or dictionary attacks. In any case, you would want to know about these failed connections as soon as possible and take corrective action.
CloudWatch Alarms come in handy in this situation. Navigate to the CloudWatch console, and choose Create Alarm.

In Select Metric, look for the metric you created (FailedConnections), select it, and then choose Next.
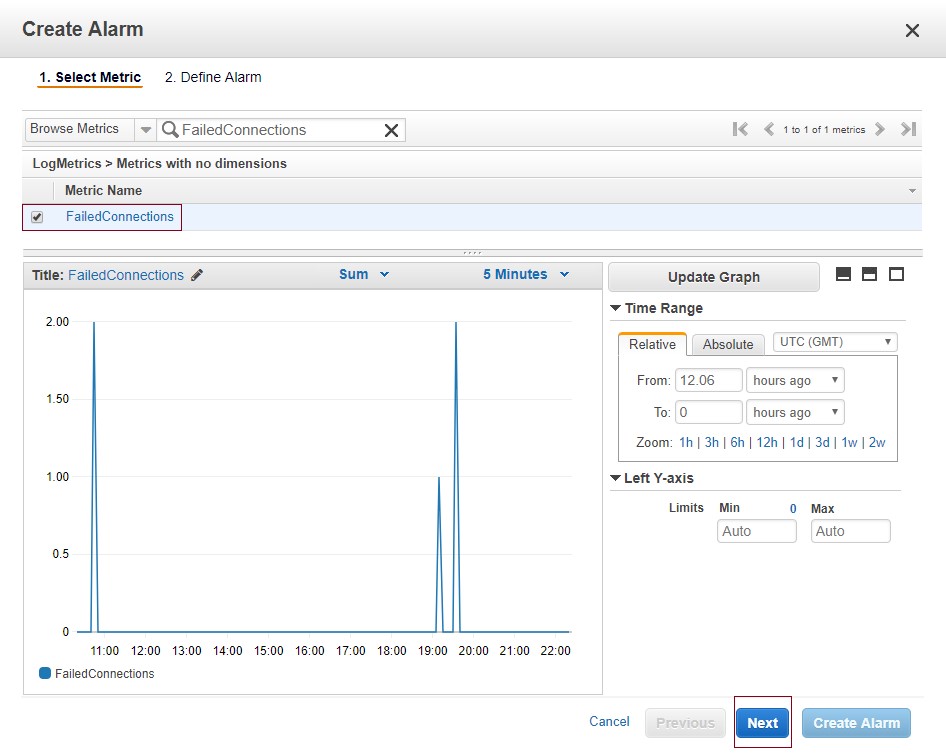
In Define Alarm, enter the name and description of the alarm. Set the alarm threshold that is appropriate for your situation. You can choose any period from 1 second for fine-grained alarms to as long as 1 day. The default period for the alarm is 5 minutes.
Change the Statistic to Sum from the default, Average. Sum gives you a count of failed connections within a period. For more information about CloudWatch concepts, see the Amazon CloudWatch documentation.
In Actions, for Send notifications to, choose new list. This allows you to create a new list and specify email addresses that will receive notifications for the alarm. When you are done setting up the alarm, choose Create Alarm.

The notifications are sent through Amazon Simple Notification Service (Amazon SNS). Ensure that you confirm the email subscriptions.

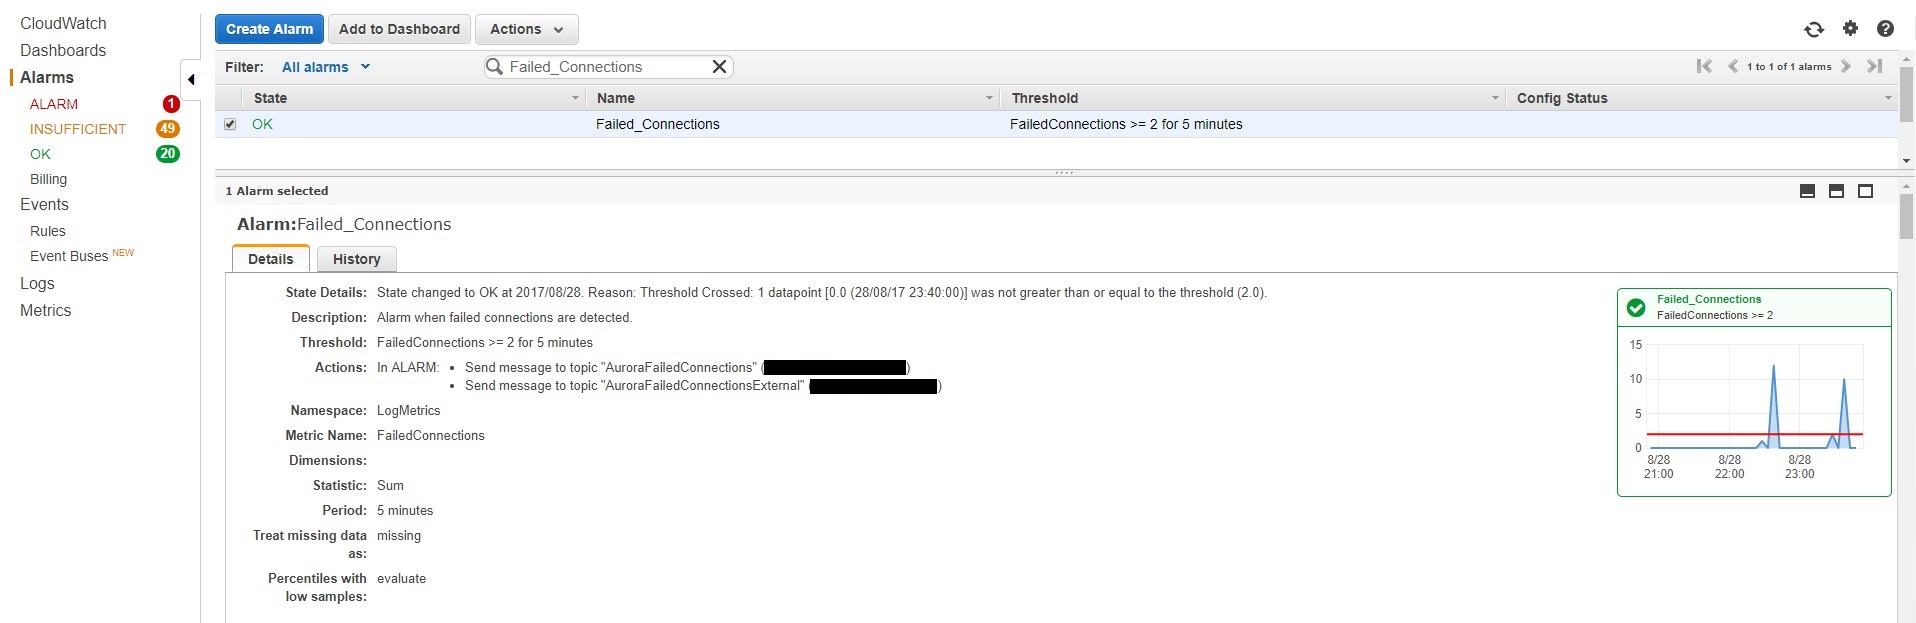
You can view this alarm on the CloudWatch console by choosing Alarms and then searching for the alarm that you created. You can view the current state of the alarm and the email addresses that are subscribed to receive notifications. The recent trend information for the alarm is also shown on the Details tab.
Conclusion
In this post, I showed you how you can turn on Advanced Auditing for your Amazon Aurora DB clusters and publish these logs to Amazon CloudWatch Logs for continuous monitoring, visibility, and archival. For deeper analysis and complex visualizations, read our blog on using Amazon Athena and Amazon QuickSight with your Aurora audit logs.
Have follow-up questions or feedback? Ping us at aurora-pm@amazon.com, or leave a comment here. We’d love to get your thoughts and suggestions.