AWS Database Blog
View Amazon CloudWatch logs for Amazon RDS in Splunk Cloud Platform
You can use Splunk Cloud Platform to monitor your entire infrastructure, including database servers hosted in AWS, on premises, or both. In this post we provide you detailed steps on how Splunk can connect to Amazon CloudWatch Logs using AWS Identity and Access Management (IAM) user credentials and pull database log files for Amazon Relational Database Service (Amazon RDS).
CloudWatch Logs
You can use Amazon CloudWatch to monitor, store, and query your application logs and vended logs from different AWS resources, such Amazon Elastic Compute Cloud (Amazon EC2) instances, AWS CloudTrail, Amazon Route 53, and Amazon RDS databases. For example, Amazon RDS for MySQL provides database logs such as MySQL slow query logs, error logs, and general log files, and automatically removes log files over 2 weeks old or when log file sizes reach around 2% of the allocated storage of the database instance. For database logs available in CloudWatch, you can define different retention periods for different logs, from 1 day to 10 years.
Amazon RDS database log files in CloudWatch and Splunk
You can view Amazon RDS logs in Splunk. If working with Amazon RDS for MySQL, you can view the audit, general, and slow query logs in both CloudWatch and Splunk. Similarly, for Amazon RDS for Oracle, you can view the audit, alert, trace, listener, and Oracle management logs in both CloudWatch and Splunk. You can also create alarms on errors in Splunk to proactively monitor your database resources or database migration logs.
Splunk Cloud Platform
Splunk Cloud Platform enables you to analyze, visualize, and create alerts to monitor unwanted activities or track activities for compliance purposes. You can have a merged view of access logs onboarded from AWS, other cloud providers, and on-premises servers. Splunk can collect metadata about your Amazon EC2 instances, reserved instances, and Amazon Elastic Block Store (Amazon EBS) snapshots. You can pull billing reports (configured in AWS) along with performance and billing metrics from CloudWatch. Other logs like Amazon Virtual Private Cloud (Amazon VPC) flow logs, Amazon Simple Storage Service (Amazon S3), Amazon CloudFront, and Elastic Load Balancing (ELB) access logs are available in Splunk as well. Once the logs are in Splunk, you can then create dashboards, alerts, and reports. You can also create table views from logs, which you can sort and filter to easily pinpoint data of interest.
For more information about viewing Amazon RDS CloudWatch logs in Splunk, refer to the following resources:
- Publishing MariaDB logs to Amazon CloudWatch Logs
- Publishing MySQL logs to Amazon CloudWatch Logs
- Publishing Oracle logs to Amazon CloudWatch Logs
- Publishing PostgreSQL logs to Amazon CloudWatch Logs
- Publishing SQL Server logs to Amazon CloudWatch Logs
Solution overview
The following diagram illustrates our solution architecture.
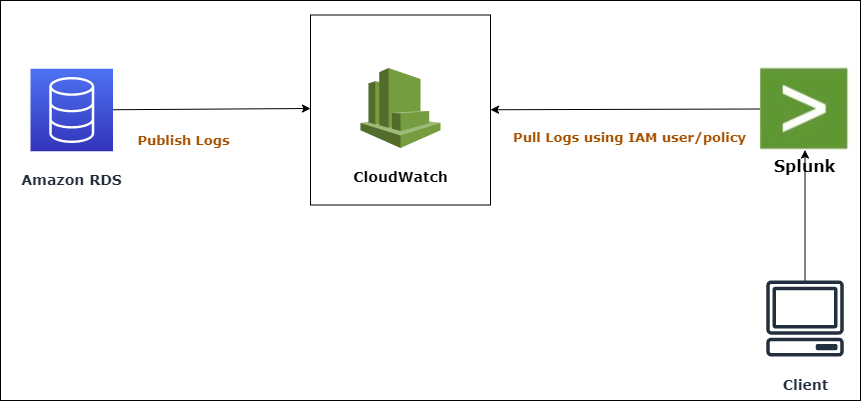
Besides viewing, listing, downloading, and watching Amazon RDS database log files, you have the additional capability of publishing database logs to CloudWatch Logs. With CloudWatch Logs, you can perform real-time analysis of the log data and store the data in highly durable storage. When the database log files are available in CloudWatch Logs, Splunk can pull database log files using AWS Identity and Access Management (IAM) credentials, which you can later view and analyze in Splunk.
To establish a connection between AWS and Splunk, a Splunk administrator must configure Splunk with the AWS access key and AWS secret key of an IAM user (with an IAM policy to access CloudWatch Logs). This enables Splunk users and automated agents to access the Amazon RDS database log files which are available in CloudWatch Logs.
In the following sections, we demonstrate how to pull Amazon RDS CloudWatch logs in Splunk.
Prerequisites
To implement this solution, you must have the following prerequisites:
- An RDS database running in your account. If not, you can launch a new RDS instance using the AWS Management Console, AWS Command Line Interface (AWS CLI), or the Amazon RDS API. For more information, see Creating an Amazon RDS DB instance.
- Make sure logs are present in CloudWatch Logs, because some services like Amazon RDS don’t have logs pushed to CloudWatch by default. You can configure whether to publish the database log files to CloudWatch Logs either when launching the RDS instance or when modifying it. For more information, see Publishing database logs to Amazon CloudWatch Logs.
- An AWS access key and AWS secret key of an IAM user with a required IAM policy that has access to the desired CloudWatch logs.
- A license to use Splunk. You can sign up for a 14-day trial account on Splunk.
Configure permissions to access AWS resources
In order to enable Splunk to interact with AWS, you have to create an IAM user via the console, AWS CLI, or AWS API. By default, an IAM user doesn’t have any privileges and can’t access any AWS resources. So before creating an IAM user, create an IAM policy with the permissions required to access CloudWatch logs. In the IAM policy, you can either specify the specific CloudWatch resources you want to publish in Splunk, or specify * which will allow access to CloudWatch logs. It’s always recommended to use the least privilege principle to ensure high security standards.
- Create the IAM policy using the following JSON and give it a name. This policy grants specific permissions – in this case, the permissions to describe log groups, describe log streams, get log events, and get the S3 bucket location for all logs.
After you create an IAM policy, create an IAM user and assign the IAM policy to it. The IAM user is restricted to the limited permissions defined in the IAM policy. You must create an IAM user just for programmatic access because you need an AWS access key and AWS secret key, which will be used later to configure Splunk.
- On the IAM console, choose Users in the navigation pane.
- Choose Add users.

- For User name, enter a name.
- For Select AWS credential type, select Access key – Programmatic access.
- Choose Next: Permissions.

- Under Set permissions, choose Attach existing policies directly.
- Select your policy.
- Choose Next: Tags.

- Optionally, provide tags.
- Review your settings and choose Create user.

A success message appears once your user has been created.
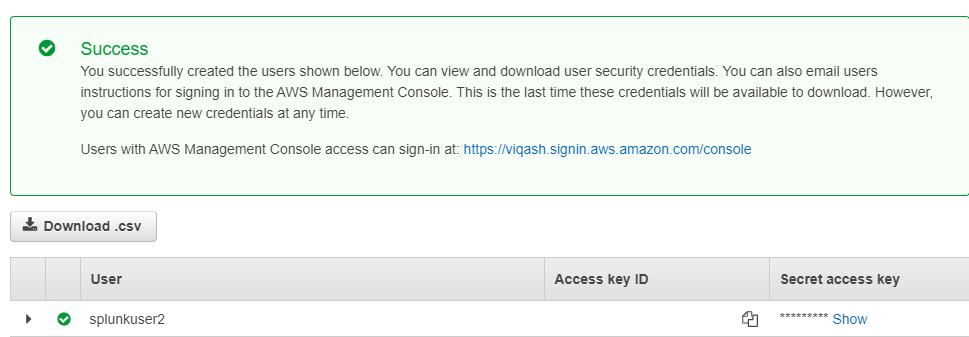
- Note down the AWS access key and AWS secret key—these are required to configure the AWS account in Splunk.
Configure Splunk with the Splunk Add-on for AWS
At this stage, you can configure your AWS account with Splunk. To install the Splunk Add-on for Amazon Web Services:
- Log in to Splunk with the default user (
sc_admin). You can access Splunk using an URL likehttps://prd-p-cgp8j.splunkcloud.com - On the Splunk home screen, choose the gear icon next to Apps on the navigation bar.
- Choose Find more apps.
- Find the Splunk Add-on for Amazon Web Services, then choose Install.

- Follow the prompts to complete your installation.
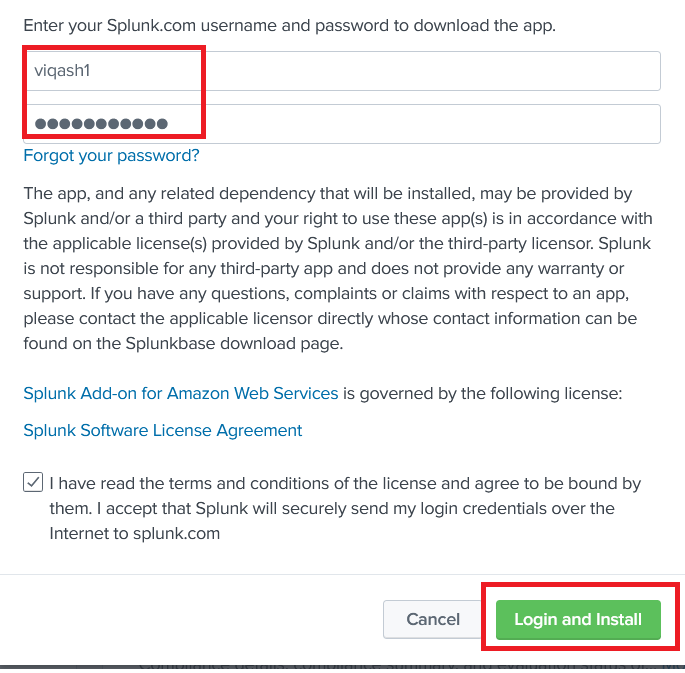
- When prompted to provide user credentials, enter the same user that you used to register on Splunk (not
sc_admin, which is for administration only). - Choose Login and Install.
A message appears with the installation status.
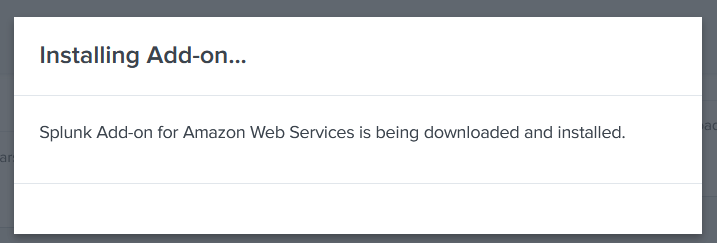
- When installation is complete, choose Done.

Configure an IAM user in Splunk
In the Splunk add-on, you must configure the IAM account you created earlier, to establish interaction between Splunk and CloudWatch Logs. Complete the following steps:
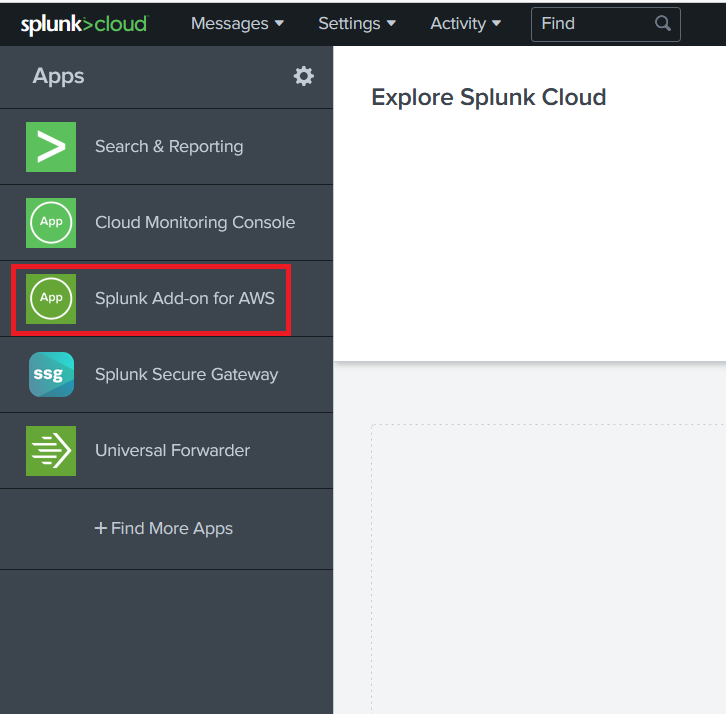
- After you install the add-on, return to Splunk and log in as the
sc_adminuser. - Choose Splunk Add-on for AWS on the sidebar.
- On the Configuration tab, provide the AWS access key and AWS secret key of the IAM user that you created earlier.

Create an input in Splunk to access your CloudWatch logs
To create an input for your CloudWatch logs, complete the following steps:
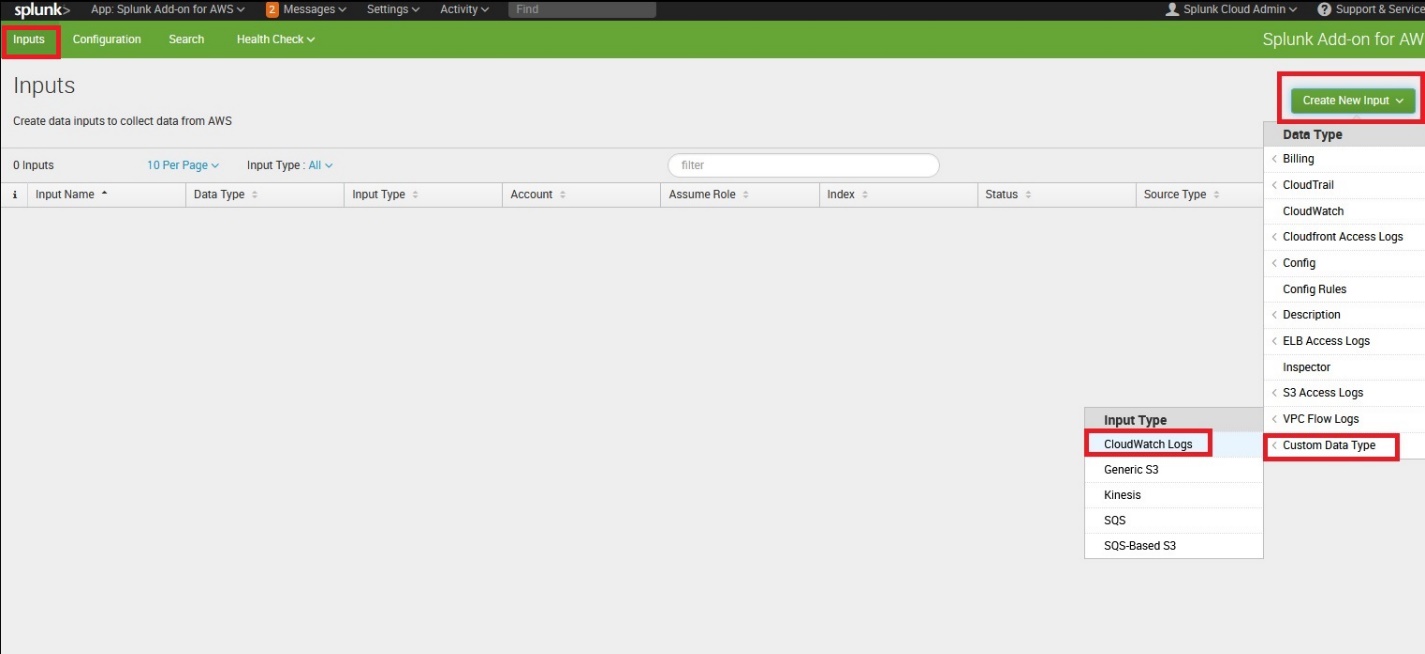
- On the Inputs tab, choose Create New Input.
- Choose Custom Data Type and choose CloudWatch Logs.
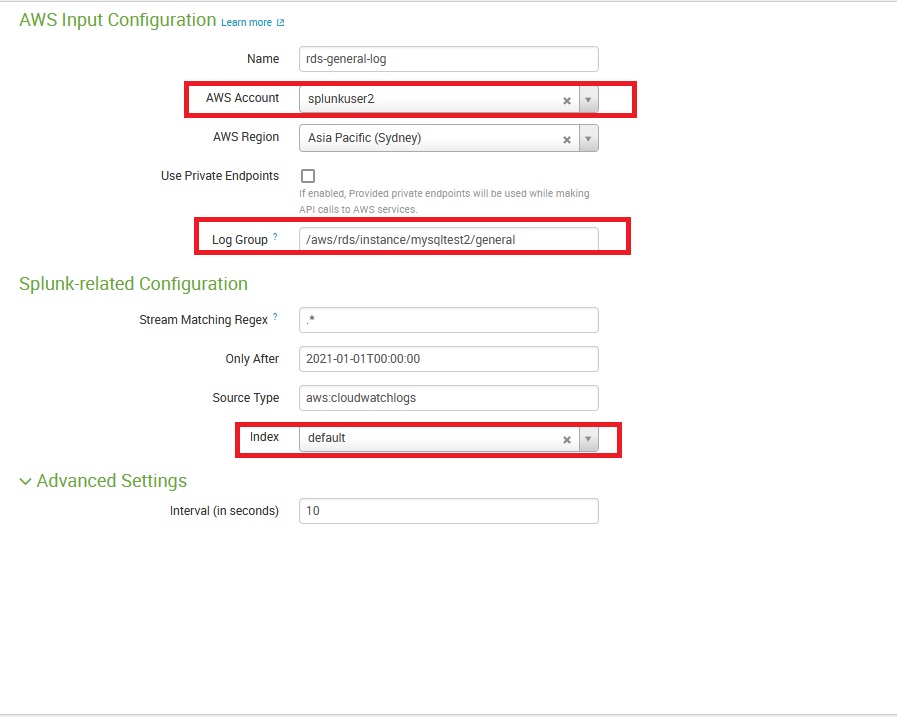
- Enter the following information:
- Name – The name of the CloudWatch log that is visible in Splunk.
- AWS Account – The user you created earlier that points to an IAM user access key and secret key.
- AWS Region – The Region where the CloudWatch log exists.
- Log group – The exact log group name in AWS that you want to view in Splunk.
- Stream Matching Regex – Leave it as default (no filters while reading CloudWatch logs in Splunk).
- Only After – The start point from where you want logs to be visible in Splunk.
- Source Type – Leave it as default or same.
- Index – Leave it as default or same. If you want to have a customized index, you can create it before you create the input.
View CloudWatch logs in Splunk
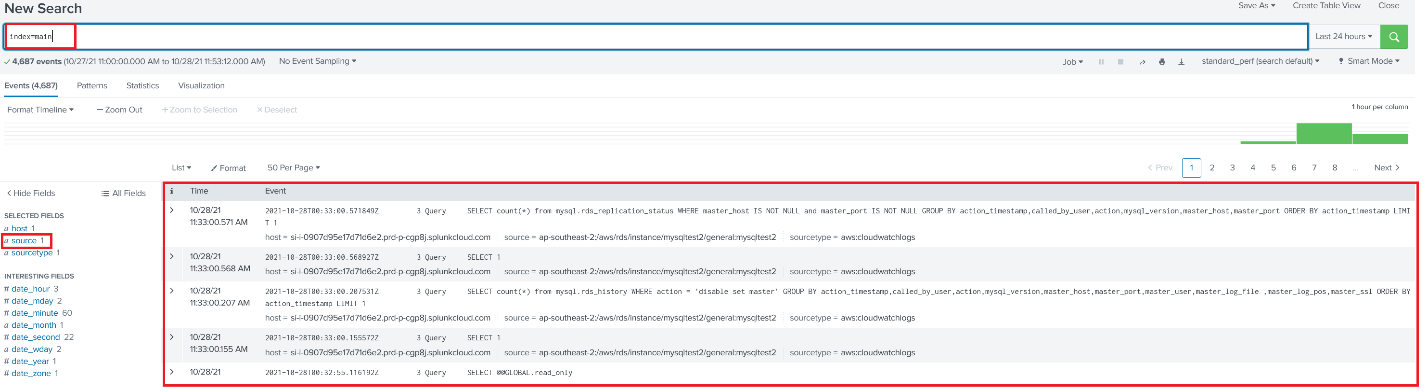
Now you can search the entire log in Splunk by searching for index=main.
If you want to identify specific queries or objects, you can filter them too. For example, in the following screenshot, we want to identify all create table statements that ran on your database instances.

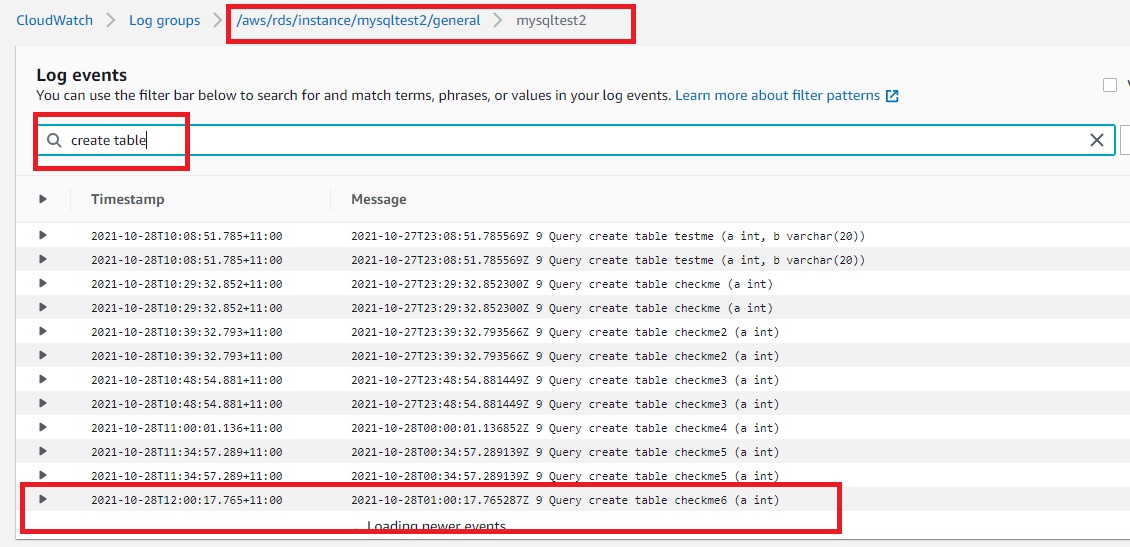
View CloudWatch logs on the console
To verify the solution is working, you can check the CloudWatch logs in the AWS Management Console to confirm that they match those in Splunk.
View multiple CloudWatch logs in Splunk for multiple sources
In Splunk, you can choose the field source to identify which CloudWatch logs to search against. For example, if you configured two inputs (one for CloudWatch logs for Amazon RDS for Oracle and another for Amazon RDS for MySQL), you can see source is 2. You can search against specific logs by choosing the source.
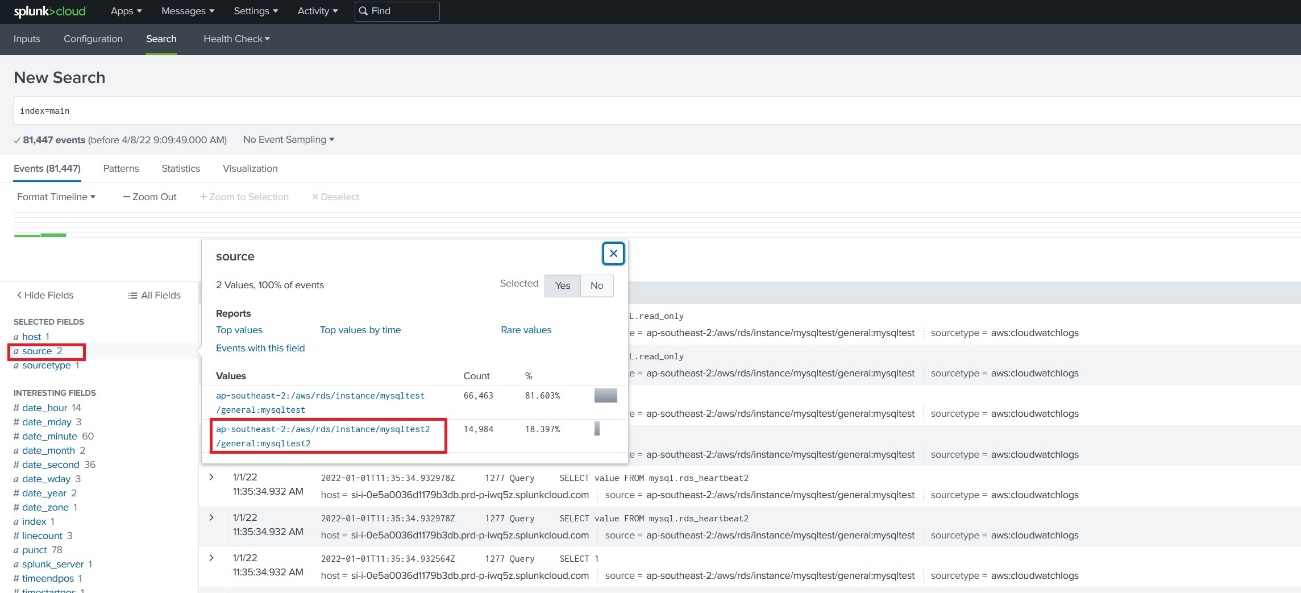
Alternatively, you can look for the CloudWatch logs by using the following filter on the Search tab:
For example, index=main source="ap-southeast-2:/aws/rds/instance/mysqltest2/general:mysqltest2".
Conclusion
With CloudWatch Logs available in Splunk, you have the convenience of analyzing your logs, even from different sources like other cloud providers or on premises. You can use those logs to create a consolidated dashboard, alerts, reports, and event types to better monitor your resources. Having different sources combined on Splunk allows you to analyze, visualize, and act on your data through a flexible, secure, and cost-effective data platform service.
In this post, I described the steps to pull CloudWatch logs into Splunk, which can help you get a consolidated view and analyze your logs proactively. I can’t wait for you to try this feature to manage your logs. Start exploring now, by first publishing database logs to CloudWatch Logs and accessing it via Splunk Cloud Platform.
Use this link to find more posts about monitoring databases with Amazon CloudWatch.
If you have any comments or questions, leave them in the comments section.
About the Authors
 Viqash Adwani is a Database Specialty Architect at Amazon Web Services. He works with internal and external customers to provide guidance and technical assistance in migrating their on-premises database environment to AWS cloud, helping them improve the value of their solutions when using AWS.