AWS Cloud Operations Blog
Centralize AWS Cost Anomaly Detection using Amazon Managed Grafana
AWS Cost Anomaly Detection uses advanced Machine Learning to identify anomalous spend and root causes, empowering the customers to take action quickly. Currently, in order to view the AWS Cost Anomalies in AWS Cost Explorer, it requires the user to have IAM user access privileges on the AWS Management Console. The ability to centrally monitor and visualize the anomaly insights makes it easier for the customers to identify any sudden spike in the spends, also keeping the principle of least privilege in focus. They can visualize the insights into those anomalous spends across multiple accounts using Amazon Managed Grafana that retrieves and refreshes the data periodically.
This post explains how Amazon Managed Grafana dashboards help our customers visualize and track the AWS cost anomalies that are outside the pattern of historical usage.
Architecture Overview
The following architecture diagram illustrates the use of AWS Lambda to retrieve all cost anomalies detected using the AWS Cost Anomaly Detection API and store the data in Amazon S3 bucket. Next, AWS Glue accesses this data stored in an Amazon S3 bucket, extracts the metadata, and creates table definitions in AWS Glue Data Catalog. Once the data is stored in the database, Amazon Athena is used to create a tabular view. Lastly, we leverage Amazon Managed Grafana Athena data source to create an AWS Cost Anomaly insights dashboard on Amazon Managed Grafana.
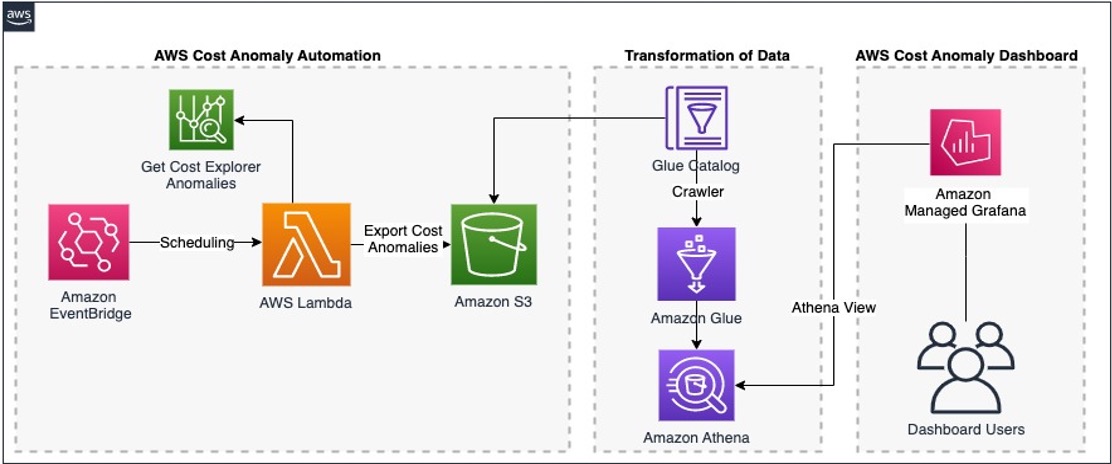
Figure 1: Architecture Overview
Prerequisites
- AWS Cost Anomaly Detection is a feature within AWS Cost Explorer. To access AWS Cost Anomaly Detection, enable AWS Cost Explorer. For instructions on how to enable AWS Cost Explorer using the console, see Enabling AWS Cost Explorer.
- Configure AWS Cost Anomaly Detection so that it detects anomalies at a lower granularity and spend patterns, in context to your monitor type. Creating your cost monitors and alert subscriptions.
- Amazon Managed Grafana workspace. Refer to Amazon Managed Grafana – Getting Started for information on configuration and setup. For information and steps on creating the Amazon Managed Grafana workspace, see Creating a WorkSpace.
a. Amazon Managed Grafana lets you to configure user access through AWS IAM Identity Center or other SAML based Identity Providers (IdP). Review Amazon Managed Grafana supports direct SAML integration with identity providers.
b. In this post, we’re using the AWS IAM Identity Center option with Amazon Managed Grafana. To set up Authentication and Authorization, follow the instructions in the Amazon Managed Grafana User Guide to enable AWS IAM Identity Center.
c. To use AWS data source configuration, first use the Amazon Managed Grafana console to enable service-managed AWS Identity and Access Management (IAM) roles that grants the workspace with AWS IAM policies necessary to access resources in your AWS Account/Organization. Then, use the Amazon Managed Grafana workspace console to add Amazon Athena data source.
Step 1: Launch the AWS CloudFormation Template
Download and launch this AWS CloudFormation Template to deploy Lambda, Glue Crawler, Glue Database and its related components.
Note: Some of the resources that this stack deploys incur costs when in use.
To create your resources using AWS CloudFormation template, complete the following steps:
- Sign in to the AWS Management Console
- Navigate to the AWS CloudFormation console > Create Stack > “With new resources”
- Upload the yaml template file and choose Next
- Specify a “Stack name” and choose Next
- Leave the “Configure stack options” at default values and choose Next
- Review the details on the final screen and under “Capabilities” check the box for “I acknowledge that AWS CloudFormation might create IAM resources with custom names”
- Choose Submit

Figure 2: Acknowledgement
Note: You can review the progress of your new stack under AWS CloudFormation > Stacks > Stack_Name > Events tab
Once the Stack is created successfully, you will see the following resources deployed:
Amazon EventBridge Scheduler, AWS Lambda Function, Amazon S3 Bucket, AWS Glue Crawler, Amazon Athena Query (under ‘“Saved Queries” tab to create the view in Athena) and the corresponding AWS IAM Roles and Policies are created successfully.
Step 2: Create View in Amazon Athena using the saved queries created as part of the AWS CloudFormation stack
1. Go to Amazon Athena > Query editor > Saved queries tab and choose the query named “AWS-Cost-Anomaly”
Note: The Workgroup created is named “Primary”

Figure 3: Amazon Athena Saved Queries
2. On the Query editor, verify the Data source, Database and Table names while running the query. Upon successful execution, the query creates a View named “ca_summary_view”

Figure 4: Amazon Athena Query Editor
Step 3: Configure Amazon Athena Data Source in Amazon Managed Grafana
- Launch the Amazon Managed Grafana console using the Grafana workspace URL and login using the user credentials you configured
- Under Administration > Data sources > choose Amazon Athena
- Configure the Amazon Athena settings by choosing Default Region (us-east-1), Data source (AWSDataCatalog), Database (aws-cost-anomalies-db), Workgroup (primary) and the Output Location of your Athena query
- Choose Save & test to verify that the data source is working. Start querying and visualizing the metrics from the AWS environment
Note: In case you receive a permission denied error, verify the Grafana service role permissions discussed in the previous step.

Figure 5: Amazon Athena as Data source
Step 4: Create an Amazon Managed Grafana Dashboard
Amazon Managed Grafana is a fully managed service that makes it easy to create, configure, and share interactive dashboards and charts for monitoring your data. You can also use Amazon Managed Grafana to set up alerts and notifications based on specific conditions or thresholds, allowing you to quickly identify and respond to issues.
In this step, we will use Amazon Managed Grafana to create a new AWS Cost Anomaly Detection dashboard.
- Download the Cost Anomaly dashboard JSON file from this GitHub Repository
- To import the dashboard, go to Dashboards > New and choose Import on the Amazon Managed Grafana console. Learn more about Exporting and importing dashboards
- Copy and paste the contents of the JSON file into the Import via panel JSON textbox and choose Load
Note: You can either upload a dashboard JSON file, paste a dashboard URL or paste dashboard JSON text directly into the text area and choose Load

Figure 6: Load the JSON code

Figure 7: Import the dashboard using JSON code

Figure 8: Grafana Dashboard

Figure 9: Grafana Dashboard
Now we have the AWS Cost Anomalies Insights on Amazon Managed Grafana. This dashboard refreshes every 5 minutes and runs a query against the materialized views that we previously created in Amazon Athena. We can visualize the anomalous spike along with the details on impact percentages, service names, account ids and the timelines empowering us to take timely actions and minimize the impact.
Finally, Grafana alerting provides us with robust and actionable alerts that help us learn about problems in the systems moments after they occur. To learn more about Grafana alerting visit “Alerts in Grafana”.
Clean up
You will continue to incur cost until you clean up the infrastructure that you created for this post:
- Delete AWS CloudFormation Stack
- Delete Amazon Managed Grafana Workspace
- Delete Amazon Athena Workgroup
Note: You can delete only the empty S3 buckets using AWS CloudFormation. Delete CloudFormation stack fails in case there is content in S3 bucket. Empty the S3 bucket before initiating delete process for the CloudFormation template.
Conclusion
In this blog post, we showed how you can visualize the AWS Cost Anomalies with Amazon Managed Grafana. The dashboard allows you to visualize and stay informed of spend anomalies through automated detection. You can get hands-on experience with the AWS Observability services at One Observability Workshop. Visit the AWS Observability guide to learn more about best practices.
To get started and learn more, visit Getting started with AWS Cost Anomaly Detection and Amazon Managed Grafana Dashboards.
About the authors: