AWS Cloud Operations Blog
Enhance observability for Network Load Balancers using Amazon CloudWatch Internet Monitor
Amazon CloudWatch Internet Monitor now provides internet performance and availability measurements for user traffic that accesses specific Network Load Balancers.
Amazon CloudWatch Internet Monitor (Internet Monitor) now provides the ability to get internet performance and availability measurements for user traffic to specific Network Load Balancers (NLBs). This blog post describes how this new capability can help you gain valuable insights and improve your end user experience. In today’s business landscape, cloud-based applications that use NLBs have become essential for optimizing user experience. This means that it’s important to ensure high performance and availability for individual NLB resources that you’ve configured for an application. With the ability to monitor specific NLBs, Internet Monitor now provides monitoring and notifications to make this easier.
Importance of observability for applications using NLBs
NLBs play a crucial role in distributing incoming traffic across multiple targets in Amazon Virtual Private Cloud (Amazon VPC). However, without observability for each NLB, IT professionals face challenges in identifying bottlenecks and monitoring the network path to NLB endpoints. This lack of visibility can result in decreased performance and reliability, which impacts customer satisfaction.
To support a more granular level of observability, Internet Monitor now includes the ability to monitor individual NLBs for your application. By adding specific NLB resources to Internet Monitor, you can gain near real-time visibility into incoming traffic to your application’s NLBs, so that you can identify and mitigate issues with them individually.
To choose between monitoring your application’s NLB or VPC resources with Internet Monitor, consider several factors. First, think about the granularity of monitoring that you need for your scenario. By selecting NLBs as the resources to monitor, you can get more detailed information about availability and performance that is specific to the load balancers for your application. By monitoring the network paths to the NLBs, you can quickly troubleshoot and resolve issues that are at the load balancer level, by identifying patterns, spikes, or anomalies in the metrics for them specifically.
Second, consider whether you need to understand and configure features at the load balancer level for your application or organization to improve efficiencies. By monitoring NLBs separately, you might be able to ensure higher operational efficiency, by enabling features only on the specific resources or accounts that will benefit from them. This can help your IT organization to maximize resource utilization.
Finally, you might need compliance information at the NLB level. For example, if your application is used by specific industry verticals that have auditing and compliance requirements, such as Financial Services, Healthcare, and the Public Sector, you might be required to provide attestation proof that specific NLBs are included as endpoints in their network paths.
Another path that you could take is to monitor both individual NLBs and the overall resources that your application uses, such as VPCs, Amazon CloudFront distributions, and Amazon WorkSpaces directories. Configuring broad coverage, as well as specific monitoring for individual NLB resources, can help you to optimize your application’s full network infrastructure.
If you decide that monitoring NLBs would be useful for your application, you can explore the potential costs involved by using the CloudWatch Pricing calculator. On the Pricing calculator for CloudWatch page, scroll down to Internet Monitor. Adding NLBs as resources to monitor incurs charges similar to the per-resource and per-city-network pricing model that applies to other resources, including VPCs, CloudFront distributions, and Workspaces directories.
How monitoring with Internet Monitor works
To get started with Internet Monitor, you create a monitor, as described later in this blog post. The Amazon CloudWatch dashboard for Internet Monitor provides graphs and interactive tools to learn more about performance and availability using Internet Monitor metrics. Internet Monitor publishes measurements based on the locations and ASNs (usually internet service providers, or ISPs) that your customers use to access your application. If there’s an internet problem that affects the city-networks (locations and ASNs) for your end users, Internet Monitor can notify you through Amazon EventBridge.
Internet Monitor automatically generates and publishes health events in your account, and can diagnose whether a problem was caused by an ISP or AWS. If the issue is related to the AWS network, you can find detailed information on the AWS Health Dashboard, along with the steps that AWS is taking to mitigate the problem.
Internet Monitor creation workflow demo
The following steps describe how to use Internet Monitor for monitoring NLBs that are part of your application deployment. Before you get started, make sure that you are familiar with NLBs in general, and have set up the NLBs that you need for your application. For more information about setting up and using NLBs, see the documentation.
For this example, let’s say that you have an application that’s deployed across multiple instances and supports a web application with an online store. To illustrate with Internet Monitor, we’ll say that the application is running on EC2 instances in an Auto Scaling group behind an NLB.
Create a monitor
To get started, you create a monitor for your application. In the CloudWatch console, on the Internet Monitor page, choose Create monitor. Enter a name for your monitor, and then choose Add resources, as shown in the following screenshot (Figure 1).
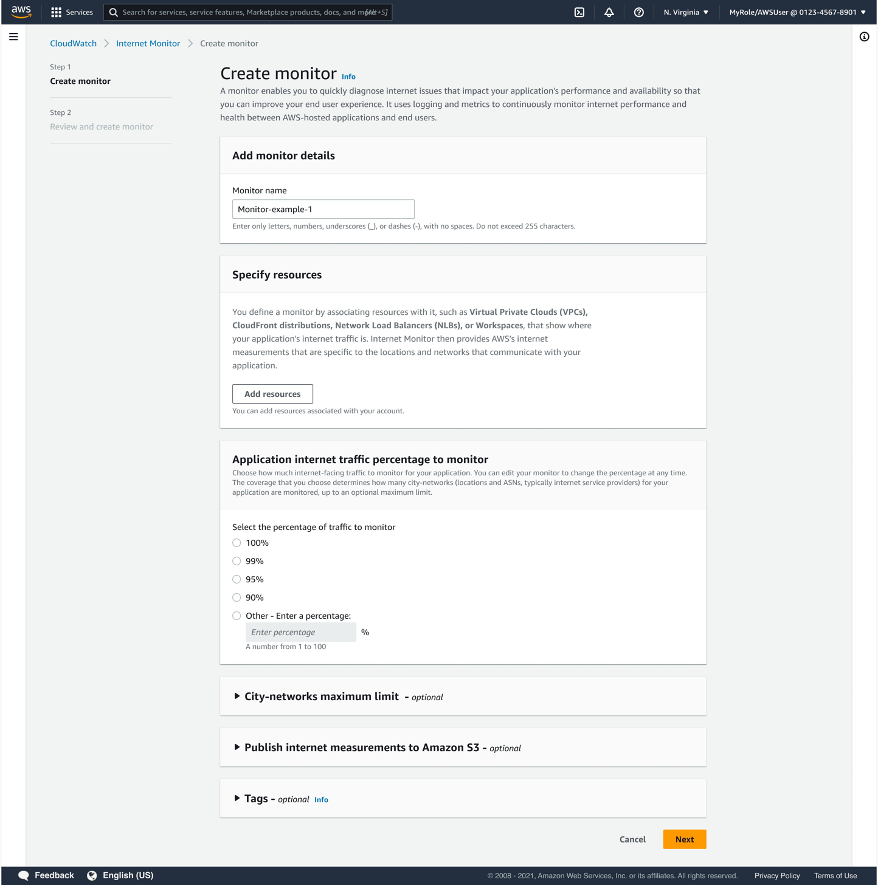
Figure 1: The Create monitor page in the Internet Monitor console
In the Add resources dialog box, choose one or more NLBs for your application, to add to the monitor. Note that you can’t add an NLB resource together with other resource types in the same monitor. After you choose an NLB resource to add, resources of other types are disabled. The following screenshot (Figure 2) shows the Add resources dialog box, where you can choose the resources that you want to monitor.
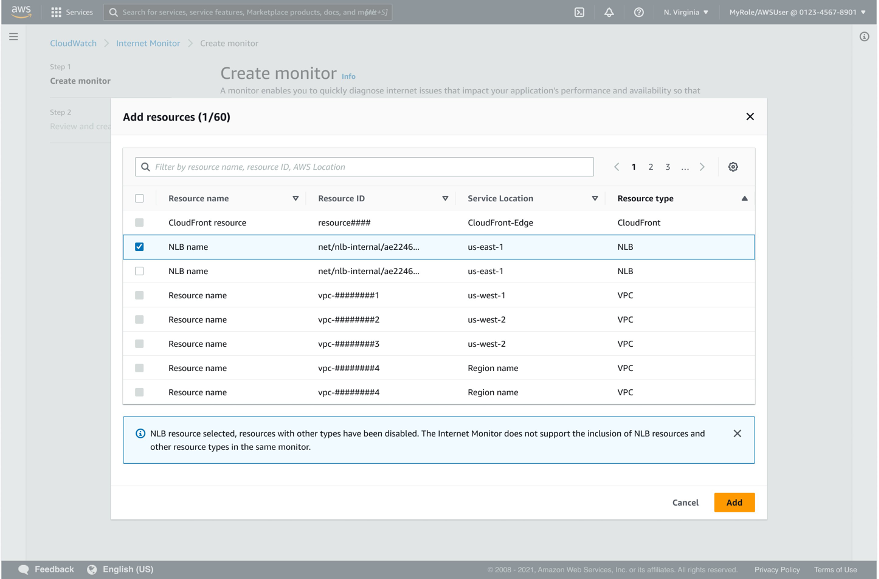
Figure 2: The Add resources page in the Create monitor flow in the Internet Monitor console.
To help you find resources to add, you can apply a filter, as shown in the following screenshot (Figure 3). For example, to quickly narrow down your search, you can filter by using Resource type = NLB.
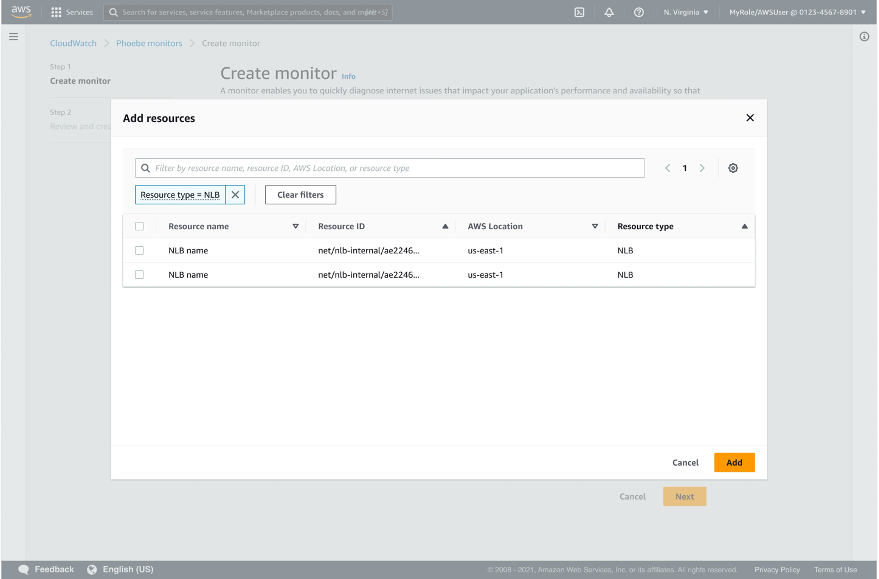
Figure 3: Using a filter on the Add resources page in the Internet Monitor console.
After you select one or more NLBs, choose Add. You’re returned to the Create monitor page, with a list of the resources that you’ve selected, as shown in the following screenshot (Figure 4). Now, on the create monitor page, you see a list of the resources that you’ve selected, as shown in the screenshot (Figure 4).

Figure 4: The Create monitor page in the Internet Monitor console.
Choose (or enter), a percentage of traffic to monitor. For example, choose 100% to monitor all the traffic to your resources, as shown in the following screenshot (Figure 5).
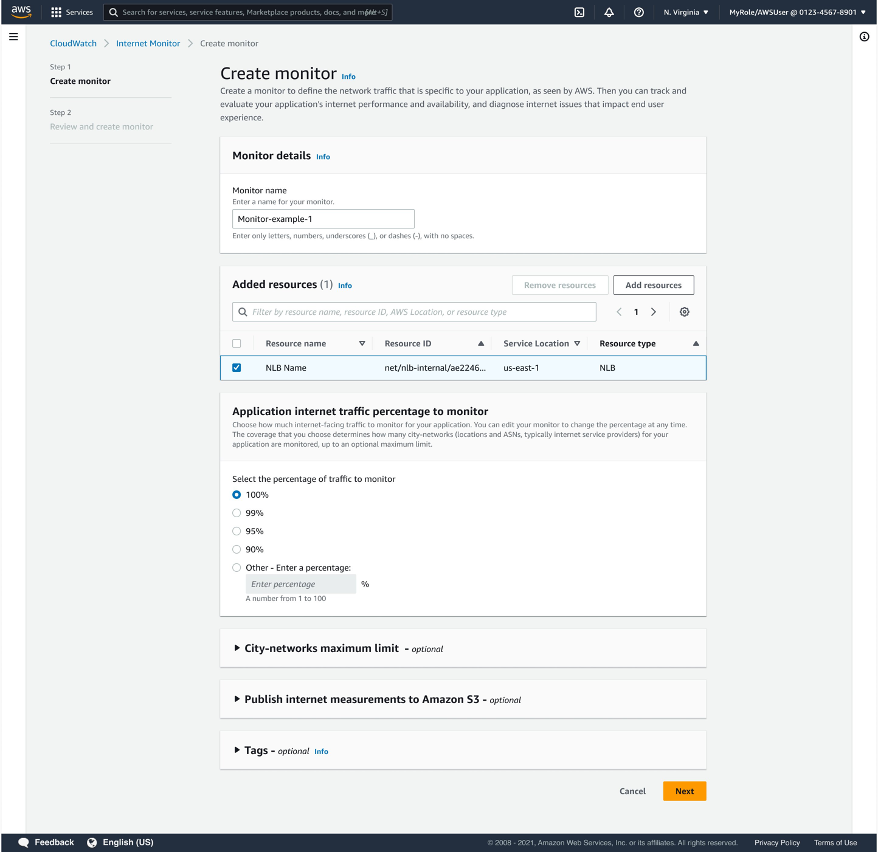
Figure 5: Choosing the percentage of traffic to monitor for your application in the Internet Monitor console.
When you create a monitor, you can optionally add one or all of the three following additional configurations.
- City-networks maximum limit: The number of city-networks (client locations and ASNs, typically ISPs) that you monitor is determined by the percentage of traffic that you choose to monitor. The actual number of city-networks monitored affects your AWS bill. By setting a city-networks maximum limit, you can help ensure that your bill is more predictable. This is especially useful if your traffic varies significantly. For more information, see the detailed information in the user guide.
- Publish internet measurements to Amazon S3: By configuring this feature, you can have Internet Monitor publish measurements for your traffic to an Amazon S3 bucket. Then you can access the log files so that you can make historical comparisons, run long term analyses, or integrate the information with other data workflows that you use.
- Tags: By adding one or more tags, you can help track resources for billing and other purposes. For example, you could add a tag to classify a monitor by application, environment, or project.
Choose Next, and then review the configuration for your monitor, as shown in the following screenshot (Figure 6). Finally, choose Create monitor, and then wait a few minutes. Your deployed monitor in Internet Monitor starts to access the log files for your resources and begins publishing measurements. The monitor takes about 10 minutes to complete its set up and become active.
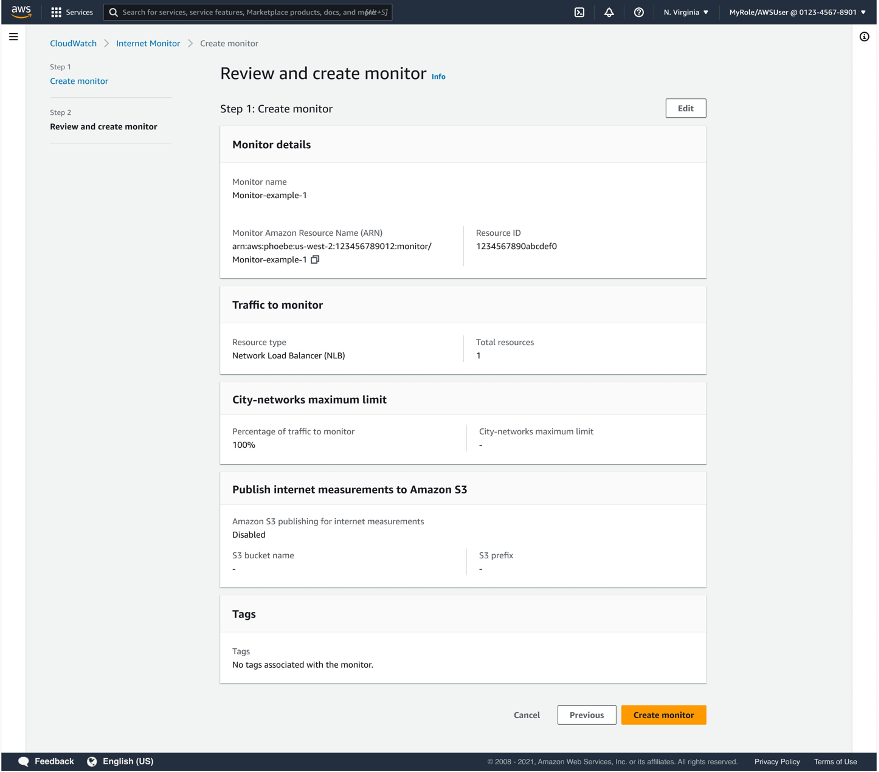
Figure 6: The review page in the console, where you can confirm your settings for your monitor before you create it.
You can see information about your monitor on the details page, as shown in the following screenshot (Figure 7). To see the details page, choose the Monitor details tab.
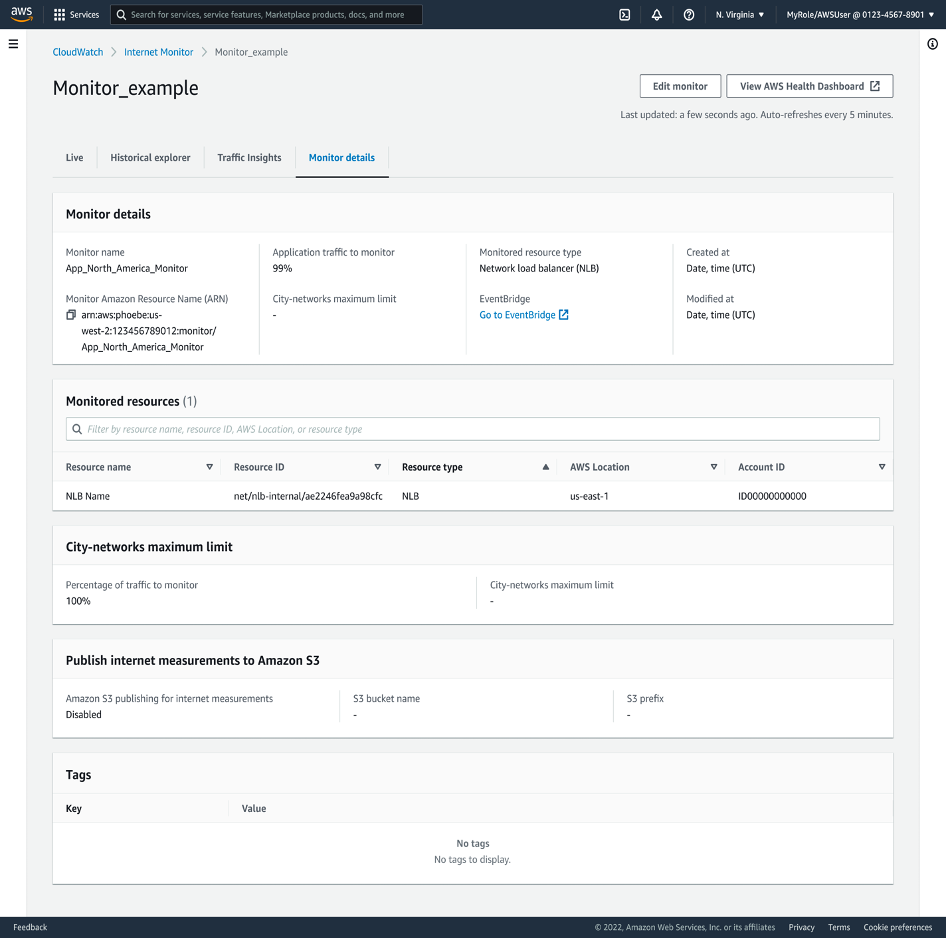
Figure 7: The monitor details page in the Internet Monitor console.
Monitor your application traffic
After you set up a monitor for your application, you can start observing traffic data and getting notifications about health events. With the monitor that you just created, Internet Monitor gives you visibility into your application’s NLB network traffic, and its internet performance and availability. It does this by leveraging the comprehensive connectivity data that AWS collects from its global networking footprint.
Using your monitor, you can also get insights about ways that you might optimize the AWS configuration for your application.
In the Internet Monitor dashboard, start with the Overview tab, shown in the following screenshot (Figure 8). This page provides an overall look at performance and availability for the application resources that you’re monitoring.
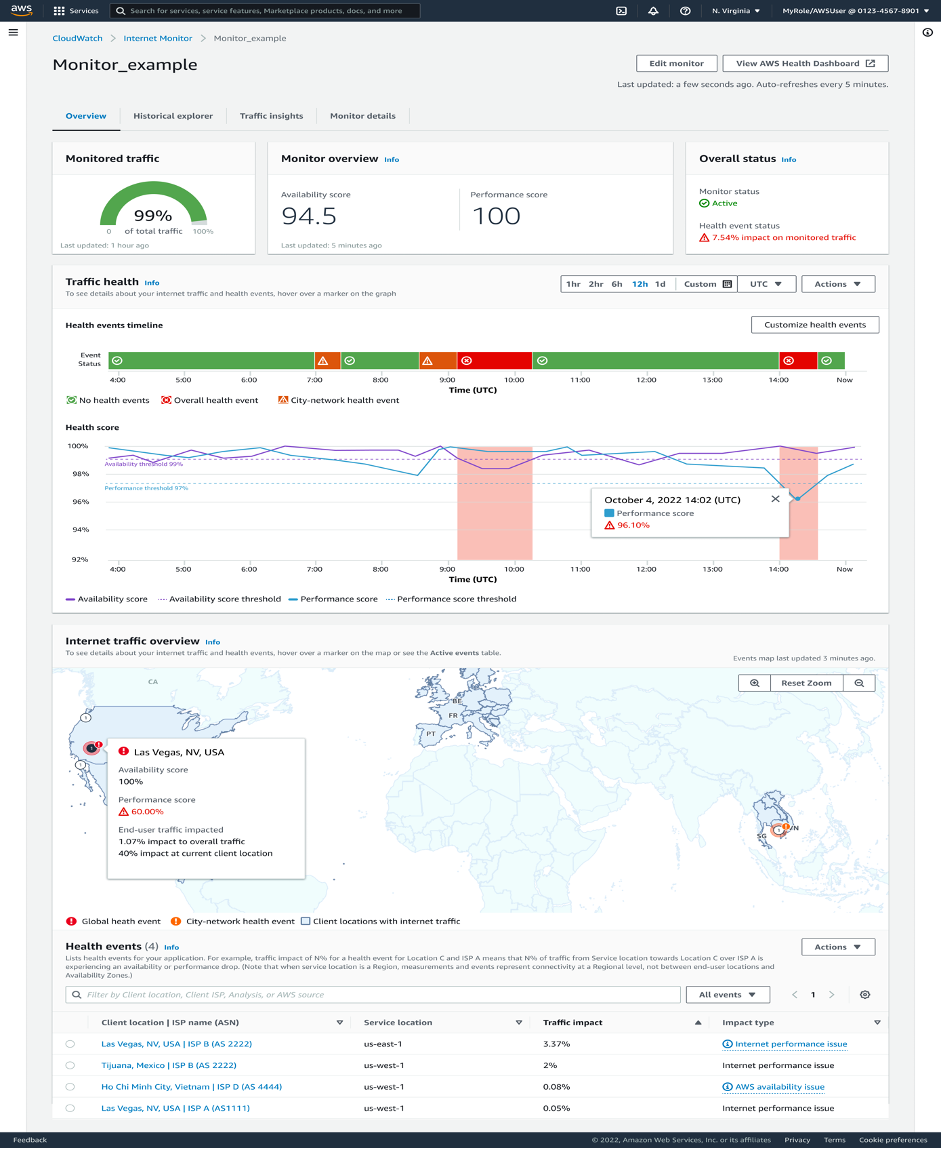
Figure 8: The Overview tab in the Internet Monitor console.
Be sure to check out the other tabs in the dashboard too, to learn about the many features of Internet Monitor. On the Historical explorer tab, you can dive deep into historical information captured for your application. On the Traffic insights tab, you can get insights to improve performance and availability. You can also set up notifications about health events, for example, by using EventBridge. To learn more about how to maximize benefits by using Internet Monitor when NLB is used with your application, see the user guide for Internet Monitor.
Conclusion
In this blog post, we described how you can set up Amazon CloudWatch Internet Monitor to monitor NLB resources for your application, to provide more granular observability into network performance and availability. Internet Monitor offers near real-time insights and proactive issue detection to empower you to optimize your application performance and availability, so you can deliver a better user experience. Get started using Internet Monitor with NLB monitoring for your application today, to take advantage of this critical monitoring and other capabilities.