AWS Cloud Operations Blog
How The Washington Post’s Arc XP uses CloudWatch Metrics Explorer to reduce costs
The Washington Post, an American daily newspaper company, delivers digital news content using Arc XP’s digital experience platform. Arc XP originated in The Post and has grown into a SaaS business used by publishers, broadcasters, and brands to create, host, and monetize engaging content for over 1,500 websites globally. Fully built on AWS, Arc XP uses Amazon CloudWatch metrics to understand how its platform is operating. Monitoring a system with more than 1,200 customer sites can be a challenge. Arc turned to Metrics Explorer, a tag-based dashboard tool that customers can use to filter, aggregate, and visualize operational health and performance metrics by tags.
Metrics Explorer provides customers with a flexible troubleshooting experience. It allows them to create multiple performance graphs at a time and use these graphs to build their application health dashboards and quickly analyze their operational data. These tag-based dashboards stay up to date as resources come and go. They help customers identify correlations and the root cause and quickly isolate issues when an alarm occurs in an application or environment.
For example, you can monitor your fleet of Amazon Relational Database Service (Amazon RDS) instances by assigning resource tags to represent your environment, like production or test. You can then use these tags to analyze operational metrics such as CPUUtilization to understand the health and performance of Amazon RDS instances associated with that tag in your environment. You can also save the performance graphs you generate with Metrics Explorer to your dashboards where you can use them to continuously monitor your application health and troubleshoot issues when they occur.
Monitoring Arc XP
Arc’s platform uses AWS Lambda and Elastic Load Balancing to host websites on the platform. It would be a heavy burden for engineers to monitor and manage these services across the platform without metrics and mechanisms to easily find metrics. The Arc team uses tags to identify which Lambda functions are used by which customers. Using these tags, the Arc team can then quickly grab all metrics related to a customer to verify the health and performance of each customer environment.
One specific example has to do with Lambda utilization. Arc’s use of Lambda has been increasing and they needed a solution that meets the following requirements:
- Uses the reserved and provisioned concurrency capabilities of Lambda to assign capacity to customers in an automated way that leads to the most performant and stable function invocations.
- Efficiently monitors the success of the Lambda functions to be sure the concurrency assignments lead to the most optimal latency and cost while avoiding throttling and cold starts.
In their solution, Arc uses CloudWatch metrics to report P99 and max usage utilization for hundreds of Lambda functions, each with variable usage. Utilization of these Lambda functions are run through a proprietary model to calculate expected Lambda concurrency and potential upcoming throttles based on previous demand. These models then trigger updates to Lambda reserved concurrency and provisioned concurrency low/max levels to be sure that the right balance is used to handle customer demand while maintaining headroom for resiliency across the environment. Metrics give visibility into those reserved concurrency limits, throttles, and provisioned concurrency utilization. Using tags, Arc can aggregate metrics by customer to get a customer-level view of health and performance. Before, it would be challenging to show utilization and throttles on the plain metrics service. Now it’s as simple as selecting a tag to show all Lambda functions across the customer’s environment or the entire platform.
Implementing tags and Metrics Explorer
Using Metrics Explorer along with automated alerting, the Arc team can quickly spot and troubleshoot any issue. Having tags on all of the AWS resources for every customer, environment, and application allows the Site Reliability Engineering(SRE) team to use Metrics Explorer to quickly find metrics across the platform for troubleshooting, without the need for prebuilt dashboards.

Figure 1: Metrics Explorer view of resolver and engine
Seamless tagging across resources helps Arc build robust and informative views. With the Add to dashboard functionality in the console, you can have multiple charts handy for runbooks when issue patterns are determined.
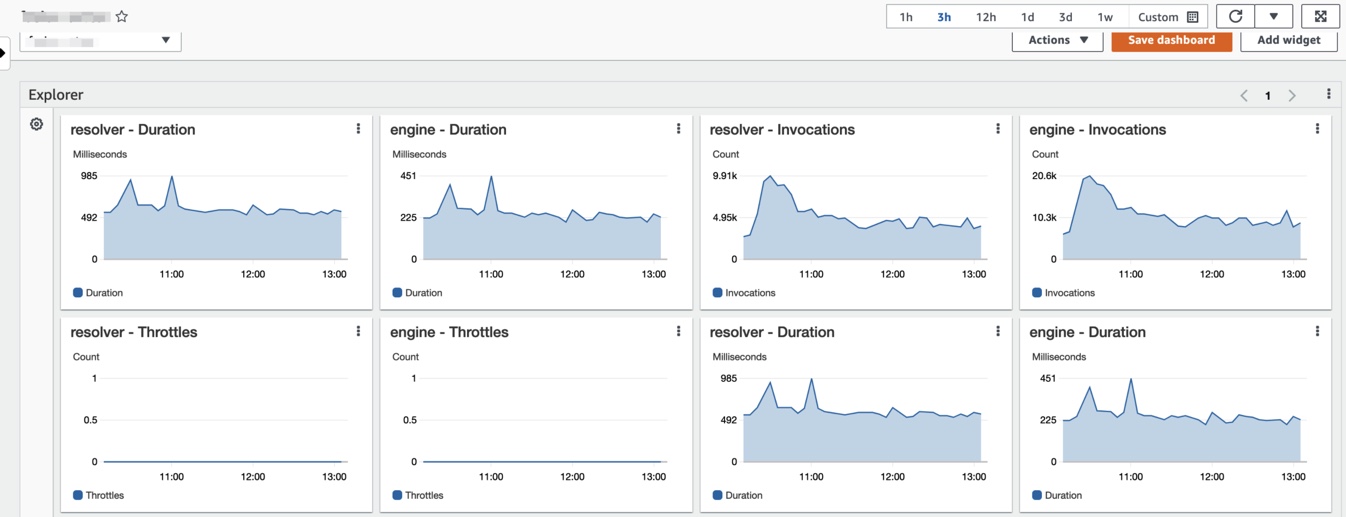
Figure 2: Dashboard showing duration, invocations, and throttles
Having required metrics at the ready makes day-to-day operations easier to perform. With a slight modification of the tags in the explorer settings, an SRE team member can switch to a different angle and easily spot the issue.
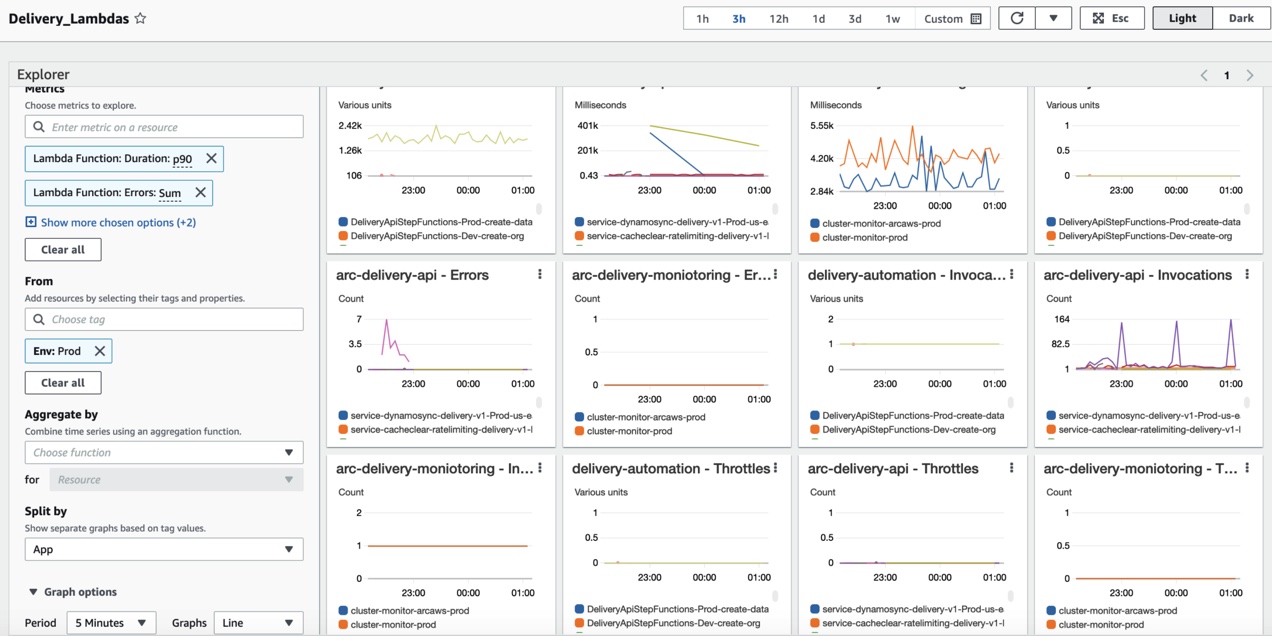
Figure 3: Graphs for other metrics
Before Metrics Explorer, it was tedious to monitor Lambda metrics across many functions and build complex and reusable dashboards that represent broader states of platform or customer usage. When investigating a function’s performance, you used to have to find metrics for a function ARN manually. The view of its performance was limited unless you manually cherry-picked the metrics to include on dashboards. This meant dashboards were situational to the issue at hand, but were not reusable for future operations across functions.
Those practices increased monitoring time and, in some cases, required a significant effort to maintain. Arc XP can now perform its cross-function analysis quickly in CloudWatch, reducing the manual monitoring burden and improving response times.
Provisioned concurrency is a more cost-effective way to use Lambda. Similar to Amazon Elastic Compute Cloud (Amazon EC2) reservations, it makes it possible for users to predict their usage. By using CloudWatch metrics, Arc XP was able to model their usage so that they could set the lower and upper bounds on the provisioned concurrency automatic scaling on each function based on its usage. CloudWatch Metrics Explorer allows Arc XP to monitor the utilization now that the levels are applied. This visibility of metrics by tag (in Arc XP’s case, one customer’s Lambda function) allowed them to visualize where the model isn’t working correctly and make continuous improvements to optimize for the lowest long-term costs.
By improving provisioned concurrency utilization, Arc was able to reduce overall Lambda costs by 20 percent. This solution would not have been possible without CloudWatch and Metrics Explorer, which Arc used to significantly speed up the rollout of automated concurrency assignments through prebuilt and dynamic monitoring views based on resource tags. Arc XP achieved 100 percent assignment in days instead of weeks, which increased savings. The ongoing monitoring of concurrency utilization in Metrics Explorer with resource tags allows Arc to find low- or high-utilized functions in minutes and adjust the assignment model for more cost savings.
According to Zach Perry, Vice President of Arc XP Platform Engineering, “Thanks to the CloudWatch team, Metrics Explorer became available for us just at the right time, before the United States Presidential election, to help Arc XP and The Washington Post reliably deliver the content people would be eager for. Metrics Explorer is a great addition to CloudWatch, making it a powerful instrument for day-to-day operations.”
Conclusion
In this post, we described how The Washington Post’s Arc XP uses tagging and Metrics Explorer to understand AWS Lambda utilization across their customer base in Arc’s digital experience platform.
Metrics Explorer is a new feature that allows you to create a relationship between your infrastructure metrics and the monitored resources in your environment. This relationship helps you to monitor your applications’ health status with more context. Metrics Explorer is available, free of charge, in all AWS Regions where Amazon CloudWatch is supported.
For more information, see Use Metrics Explorer to Monitor Resources by Their Tags and Properties in the Amazon CloudWatch User Guide or visit the Amazon CloudWatch marketing page.
For more information about Arc XP, visit www.arcxp.com.