AWS Cloud Operations Blog
SNMP monitoring using Amazon CloudWatch and Elastic Logstash
Customers want a single pane of glass for their systems operations where they can visualize the health and performance of applications running in several AWS Regions and in their on-premises environment.
Simple Network Management Protocol (SNMP) is an internet standard protocol for collecting and organizing information about managed devices on IP networks and for modifying that information to change device behavior. Devices that typically support SNMP include routers, switches, firewalls, servers, and appliances.
Logstash is a free and open server-side data processing pipeline that ingests data from a multitude of sources, transforms it, and then sends it to your preferred analytics solution.
You can use SNMP to monitor on-premises devices through AWS Direct Connect or AWS Site-to-Site VPN. You can establish a private virtual interface from your on-premises network directly to your VPC created in Amazon Virtual Private Cloud (Amazon VPC).
In this blog post, I provide a deployable demo and a walkthrough that you can use to set up an SNMP monitoring solution. You can tailor the repository assets as appropriate for your needs. This solution does not cover SNMP traps or SNMP set commands.
Solution overview
In this solution, Logstash acts as a relay server that sits between the managed devices that you want to monitor and Amazon CloudWatch. I use two Logstash plugins: SNMP (input plugin) and CloudWatch (output plugin). The input plugin collects information (using SNMP polling) from the monitored devices. These devices must be running SNMP daemons, listening on standard port 161 (Poll). After Logstash processes the information, the output plugin forwards the metrics to CloudWatch using standard AWS APIs. I use AWS Secrets Manager and Logstash keystore for SNMP credential management. You can expand this solution by using Logstash Snmptrap input plugin.
In the example application, there are three object identifiers (IfInOctets, IfOutOctets, and sysUpTimeInstance) configured to be polled every minute. These OIDs provide total input and output bytes for a given network interface and the system uptime since last reboot. These OIDs are ISO standard and do not require importing MIBs. For more information, see the Importing MIBs in the Logstash documentation.
In the GitHub repository, there are detailed deployment instructions for the example application. The repo contains Logstash settings files, configuration files and an AWS CloudFormation template that automates the entire setup as explained later in the post.
Figure 1 shows the solution architecture:
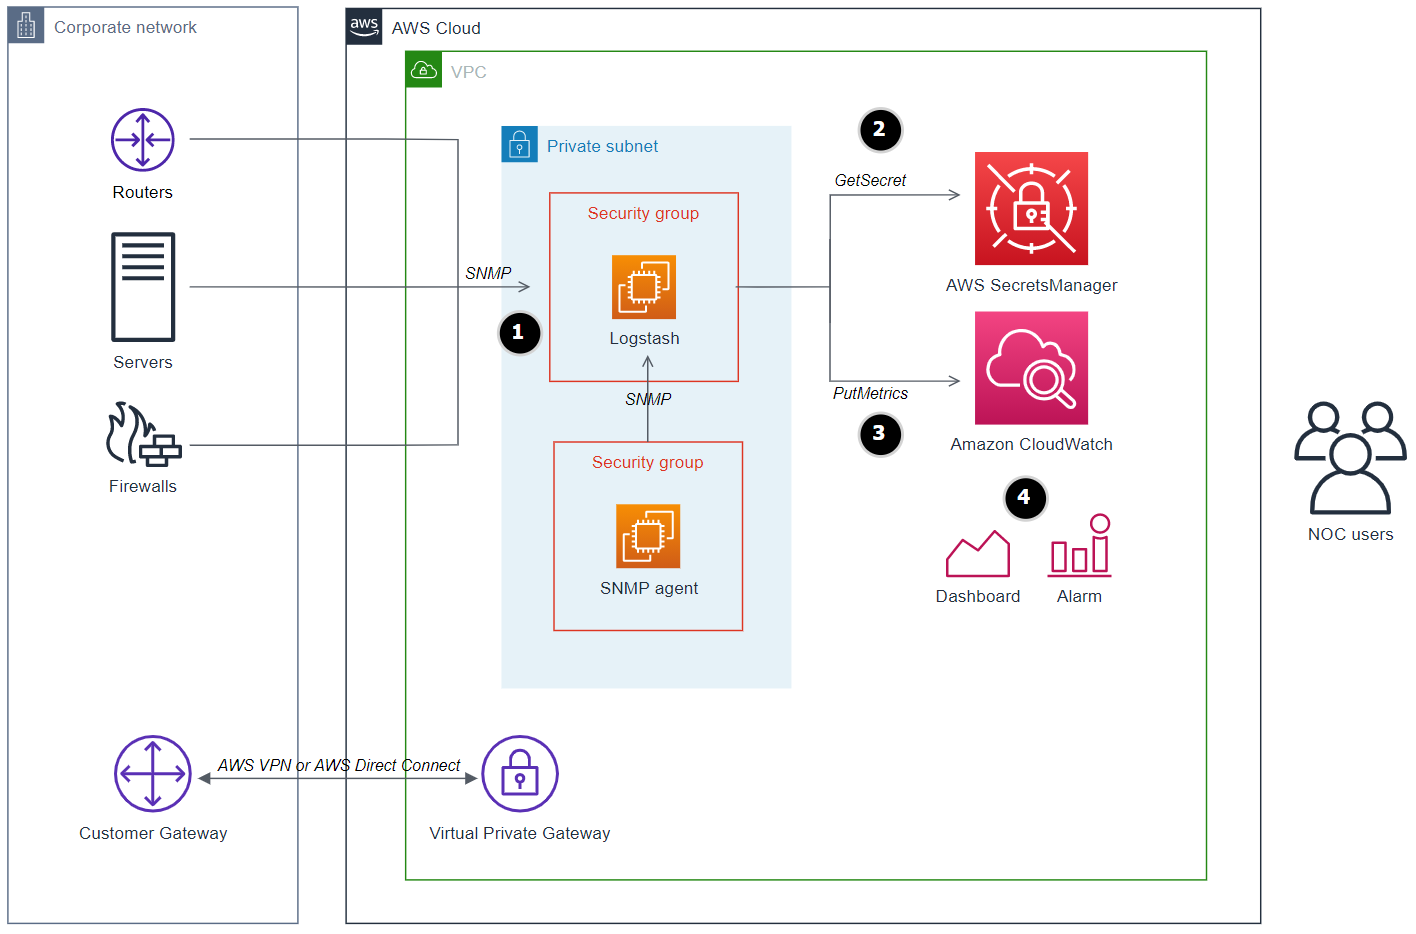
Figure 1: Logstash server integration with SNMP enabled devices and Amazon CloudWatch metrics
High-level steps
- The Logstash server running on EC2 polls information from devices running SNMP agents. Devices can be running in a VPC or on premises and are reachable through AWS Direct Connect or AWS VPN.
- During EC2 bootstrap, launch scripts fetch the stored SNMPv3 credentials from AWS Secrets Manager that will be used for authentication with devices.
- Logstash puts the collected device information to CloudWatch in the form of metrics.
- After the CloudWatch metrics are populated with data, you can create dashboards and set up alarms and actions. You can integrate these metrics with your existing dashboards for a centralized view.
Security
Per the Security pillar of the AWS Well-Architected Framework, apply security at all layers. Apply a defense-in-depth approach with multiple security controls to all layers (edge of network, VPC, load balancing, every instance and compute service, operating system, application, and code).
The solution requires a few security configurations:
VPC and subnets
The Logstash server and simulator devices (in this demo solution, EC2 instances) do not need to be reachable from the internet. However, they need outbound internet access to download and update software packages from Amazon Linux 2 repositories, yum repositories, and the Elastic.co repository.
To simplify the demo, you can use a VPC with an internet gateway route and a public subnet with assigned public IP addresses for the instances. This will allow inbound access (SSH for troubleshooting) and outbound access to download the required packages. In production environments, we recommend that you launch the instances in private subnets with a NAT gateway route.
Security groups
The SNMP simulator instance: Inbound rules must allow UDP on port 161 (SNMP poll) from your Logstash instance’s security group.
The Logstash instance: No inbound rules are required. Leave it empty to deny any inbound traffic or, optionally, to allow SSH to log on the instance for troubleshooting or viewing Logstash debug logs.
Credential management
To demonstrate the authentication capability of SNMPv3, I configure the Logstash SNMP input plugin with SNMPv3, which supports authentication with devices and the encryption of traffic. I also create snmpv3 users on the simulated devices running an SNMP daemon.
Because Logstash server must authenticate with the simulated devices, Logstash configuration files are configured with SNMPv3 credentials. A good practice is to avoid hardcoding credentials in configuration files or instance environment variables. For this reason, you can use AWS Secrets Manager to store and retrieve the SNMPv3 credentials required to authenticate with the devices. After the EC2 launch script retrieves credentials from AWS Secrets Manager, it stores them in the Logstash secrets keystore running on the same Logstash server instance.
Note: SNMPv1 and SNMPv2c versions do not support authentication. Some older devices might still be running these versions. You can update the Logstash plugin configuration for these older versions, but I do not cover that in this post.
IAM Roles
The Logstash instance profile is configured with a role with two attached policies to communicate with AWS Secrets Manager and Amazon CloudWatch:
GetSecretValueaction for the SNMPv3 secret resource stored in AWS Secrets Manager.- The
CloudWatchAgentServerPolicymanaged policy, which allows Logstash to puts metrics in CloudWatch.
The SNMP instances profile is configured with a role with one attached policy:
GetSecretValueaction for the SNMPv3 secret resource stored in AWS Secrets Manager.
Prerequisites for deploying the solution with AWS CloudFormation
To deploy the example application, you need the following:
- Permissions in your AWS account to create the resources. This example uses admin credentials.
- A VPC with a public subnet or a private subnet with a route to a NAT gateway.
- An EC2 keypair.
DeploymentThis template creates EC2 instances, CloudWatch custom metrics and related resources. You will be billed for the AWS resources used if you create a stack from this template. |
 View source code View source code |
Download and save the provided CloudFormation template from the GitHub repository, then complete the following steps:
- On the AWS CloudFormation console, choose Create stack.
- Choose the option to use new resources.
- Upload the saved template file.
- For Stack name, enter a name for the stack.
- For network configuration, select an existing VPC and one subnet with internet access.
- For EC2 Configuration, leave defaults for demo, or adjust Logstash instance type to match Logstash JVM size.
- For troubleshooting and connectivity, enter your SSH location IP CIDR and select an existing EC2 key pair.

Figure 2: CloudFormation Step 2 – Specify stack details
- Choose Next.
- Step through the remaining pages.
- On the final page, select the acknowledgement that IAM resources can be created.

Figure 3: CloudFormation IAM capabilities acknowledgement
- Choose Create stack. It takes approximately 10 minutes to complete.
This stack creates one EC2 instance for the Logstash server and two instances running the SNMP daemon, fully configured with cfn-init helper scripts. The deployment also creates a secret with a randomly generated password in AWS Secrets Manager, the necessary EC2 IAM profiles and locked down security groups.
At a high level, the instances are bootstrapped by cfn-init as follows:
Logstash EC2:
- Installs Logstash, jq and git.
- Clones the GitHub repository on the instance.
- Copies settings and configuration files to Logstash directories.
- Updates configuration files with private IP addresses of target SNMP simulators (running on EC2) and AWS region.
- Calls the Secrets Manager API and stores the secret in the Logstash keystore.
- Starts the Logstash server.
SNMP EC2:
- Installs SNMP packages.
- Calls the Secrets Manager API and uses the retrieved credentials to create an SNMPv3 user.
- Starts the SNMP service.
Logstash configuration
I implement the advanced Logstash configuration called Pipeline-to-Pipeline Communication. This approach breaks the logic of complex pipelines into multiple smaller configurations. This module-based method improves maintainability and troubleshooting.

Figure 4: An SNMP pipeline distributing to multiple filter pipelines and collected by a CloudWatch pipeline

Figure 5: Logstash upstream, processing, and downstream stages
Upstream pipeline: A single configuration file runs the SNMP input plugin that connects to hosts using their IP address and port. It selects OIDs for polling and produces Logstash events. There is one event per host. Each event contains the data for all the polled OIDs in the form of field/value. Finally, the events are sent to the processing pipelines through Logstash outputs. Security level is set to “authPriv” for authentication and encryption in transit. Figure 6 shows the snmp.conf file.
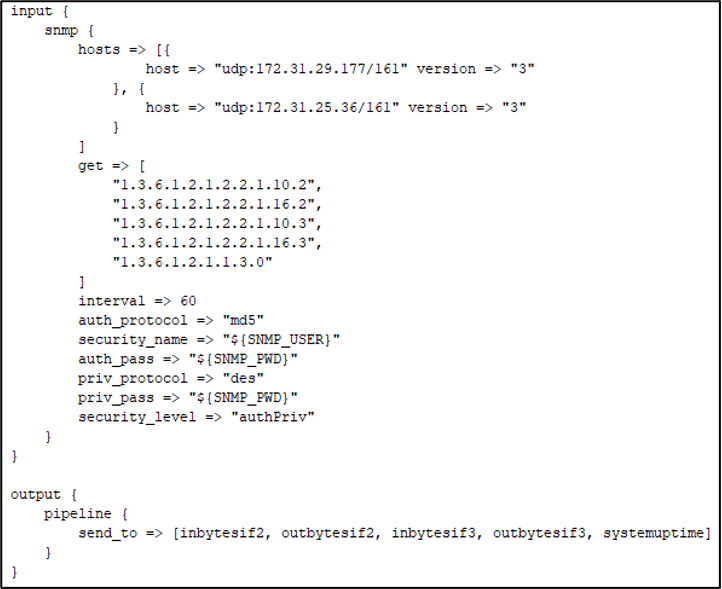
Figure 6: snmp.conf
Processing pipelines: One small configuration file per OID. The filter stage maps the OID field and value to a CloudWatch metric and then forwards the event to the final stage. Figure 7 shows the systemuptime.conf file.

Figure 7: systemuptime.conf
Downstream pipeline: In this final stage, The filter stage adds CloudWatch fields (metric dimensions and a custom namespace in CloudWatch) that apply to all metrics. Figure 8 shows the cloudwatch.conf file.
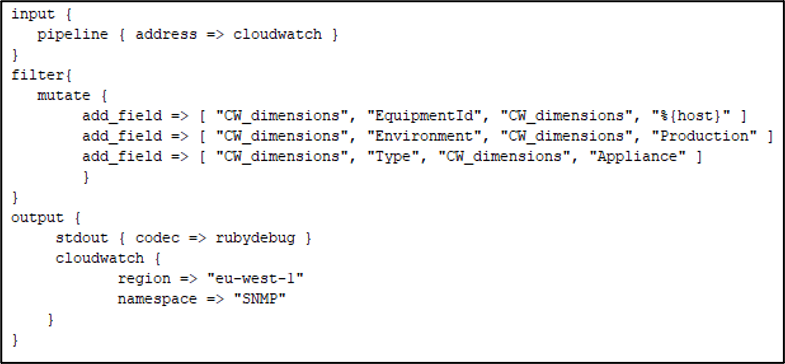
Figure 8: cloudwatch.conf
Logstash configurations are programmable and configurable, enabling many possibilities to achieve the same outcome.
Continuous deployment
Logstash server can periodically check for configuration updates by setting logstash.yml flag (config.reload.automatic: true) and automatically reloads the pipeline. You can use AWS CodeCommit for source control and AWS CodeDeploy to deploy the updated configurations to the Logstash EC2 instance. You can automate the process using AWS CodePipeline.
CloudWatch dashboard
Now that SNMP metrics are populated in CloudWatch, from the left navigation pane of the CloudWatch console, choose Metrics and then choose All metrics. In Custom Namespaces, choose the SNMP namespace.

Figure 9: CloudWatch custom metrics for SNMP created by Logstash
Note: it may take up to five minutes for the metrics to appear in the custom namespace.
You can now create dashboards and set alarms.

Figure 10: Example of a monitoring dashboard for two devices
Troubleshooting
You can investigate the following log and configuration files to troubleshoot your deployments:
| Path | Description |
| /var/log/cfn-init.log | cfn-init and command output |
| /var/log/cfn-init-cmd.log | cfn-init and command output with timestamps |
| /var/log/logstash/logstash-plain.log | Logstash internal logs during its operation |
| /etc/logstash/conf.d/ | Logstash configuration files |
| /etc/logstash/ | Logstash settings and pipelines configuration file |
Cleaning up
To clean up the demo, open the CloudFormation console and delete the stack.
Conclusion
CloudWatch provides a single pane of glass for monitoring and observability across applications and infrastructure. In this post, I showed you how to integrate SNMP-enabled devices with CloudWatch using a lightweight Logstash solution in a secure way. I also shared options for continuous deployment of Logstash using AWS Developer Tools. Logstash is also available as a Docker container and on AWS Marketplace.
For more information, see Logstash tutorial: A quick start guide.