AWS Cloud Operations Blog
Tag: Monitoring
Distributed Tracing using AWS Distro for OpenTelemetry
More and more applications are being developed using serverless architectures with multiple microservices. Customers use managed AWS services including AWS Lambda, Amazon ECS and Amazon EKS running on Amazon Elastic Compute Cloud (EC2) and AWS Fargate for running their code along with services like Amazon API Gateway, Amazon SNS, Amazon SQS, Amazon DynamoDB, Amazon S3, and others. Developers use multiple […]
Communicate monitoring information by sharing Amazon CloudWatch dashboards
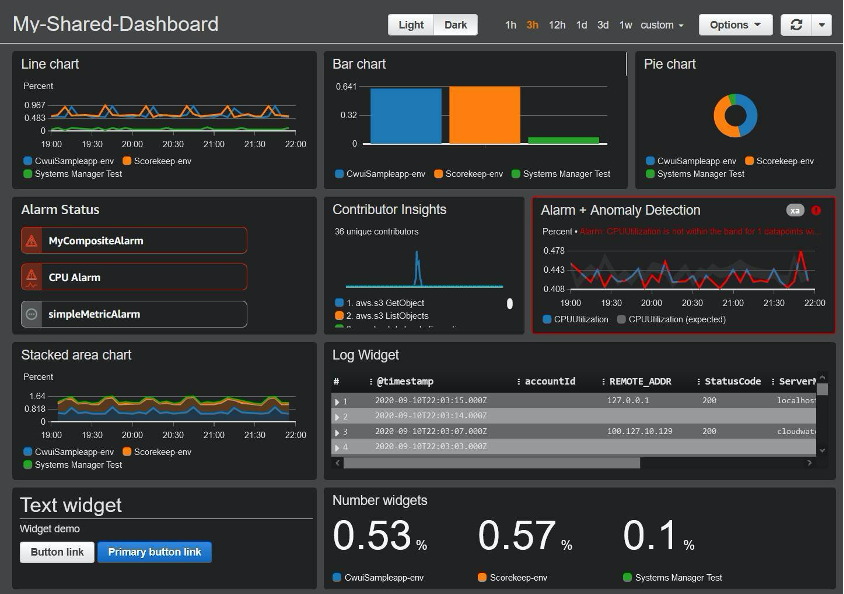
Amazon CloudWatch provides you with data and actionable insights to monitor the health and performance of your infrastructure and applications hosted on AWS and on-premises servers. CloudWatch dashboards and alarms enable you to to rapidly detect performance issues that affect end user experience. CloudWatch has added the ability to share dashboards with users outside of […]
Send real-time alerts about application anomalies using AWS X-Ray insights
Today AWS X-Ray launches support for notifications to its insights. This means that on an X-Ray group where insights are enabled, you can now configure notifications to be sent to Amazon EventBridge. Through the use of anomaly detection, AWS X-Ray helps you analyze and debug distributed applications. AWS X-Ray Insights uses anomaly detection to create actionable insights […]
Gain visibility into your Kubernetes spend with CloudZero and Amazon CloudWatch Container Insights
Container adoption has been increasing rapidly in the past few years. Customers are deploying workloads of all sizes on Amazon Elastic Kubernetes Service (Amazon EKS). Typically, cluster administrators deploy several business applications and workloads on a cluster to achieve more efficient deployment density. On large clusters in a shared infrastructure where workloads of different sizes […]
Analyze and debug applications using AWS X-Ray trace data with Grafana
Today, AWS and Grafana Labs are making available a free and open-source AWS X-Ray data source plugin. You can use the latest release of Grafana (version 7.2.0 or later) to visualize AWS X-Ray traces directly in your Grafana dashboards in order to triage performance issues in applications instrumented with X-Ray. This enables you to build a single […]
Dynamically adjusting X-Ray sampling rules
In a distributed system environment, tracing service-to-service interactions is essential to easily identify service bottlenecks, faults, and errors. AWS X-Ray allows you to set up tracing on your applications hosted on a variety of compute environments, such as Amazon Elastic Compute Cloud (Amazon EC2), AWS Elastic Beanstalk, Amazon Elastic Kubernetes Service (Amazon EKS), Amazon Elastic […]
Instantly monitor serverless applications with AWS Resource Groups
Serverless computing allows you to build and run applications without thinking about servers. Building serverless applications means that your developers can focus on their core product instead of worrying about managing and operating servers. This reduced overhead lets developers reclaim time and energy that can be spent on developing great products that scale and are reliable. […]
Actionable Insights based on anomaly detection in AWS X-Ray
Today, we launched in public preview X-Ray Insights, a new feature of AWS X-Ray, which uses anomaly detection to create actionable insights about any anomalies in your application. AWS X-Ray helps developers analyze and debug distributed applications. With this launch, you will be able to proactively identify issues in your applications caused by increases in the […]
Visualizing AWS CloudTrail Events using Kibana
In this blog post you learn how to visualize AWS CloudTrail events, near real time, using Kibana. This solution is useful if you use an ELK (Elasticsearch, Logstash, Kibana) stack to aggregate logs from all your systems and applications, analyze these logs, and create visualizations for application and infrastructure monitoring. This solution is also useful […]
Monitor your private internal endpoints 24×7 using CloudWatch Synthetics
Introduction Since Amazon CloudWatch Synthetics launched in 2019, Synthetics canaries have become the first line of defense to reliably alert developers if their public endpoints, including REST APIs and URLs, show unexpected latencies or availability drops. In addition, Synthetics canaries can also monitor for broken links, or unauthorized content changes resulting from phishing, code injection, […]


