AWS Cloud Operations Blog
Visualize data on Snowflake usage and credits using Amazon Managed Grafana
In August 2021, AWS announced Amazon Managed Grafana as generally available (GA), a fully-managed service that’s developed together with Grafana Labs and based on open source Grafana. Enhanced with enterprise capabilities, Amazon Managed Grafana makes it easier to visualize and analyze operational data at scale.
Amazon Managed Grafana is a fully-managed and secure data visualization service that enables customers to instantly query, correlate, and visualize operational metrics, logs, and traces for their applications from multiple data sources. Amazon Managed Grafana is based on the open source Grafana project, a widely-deployed data visualization tool popular for its extensible data source support. Developed together with Grafana Labs, Amazon Managed Grafana manages the provisioning, setup, scaling, and maintenance of Grafana. This eliminates the need for customers to do it themselves. Furthermore, customers benefit from built-in security features that enable compliance with governance requirements, including single sign-on, fine-grained data access control, and audit reporting.
Amazon Managed Grafana is integrated with AWS data sources that collect operational data, such as Amazon CloudWatch, Amazon Elasticsearch Service, Amazon Timestream, AWS IoT SiteWise, AWS X-Ray, and Amazon Managed Service for Prometheus (AMP). It also provides plug-ins to popular open-source databases, external Enterprise data sources like Snowflake, as well as other cloud services. Amazon Managed Grafana lets you easily visualize information from multiple AWS services, AWS accounts, and Regions in a single Grafana dashboard.
Snowflake is a cloud data platform that provides data solutions for data warehousing to data science. Snowflake is an AWS Partner with multiple AWS accreditations including AWS Competencies in Machine Learning and Data and Analytics.
In this post, we explain how to visualize Snowflake usage and billing data with Amazon Managed Grafana. By using Amazon Managed Grafana’s unique architecture we query the data in real-time from Snowflake rather than moving the data and paying for redundant storage and ingestion into Amazon Managed Grafana. Moreover, we demonstrate how to set up custom query dashboards for monitoring your Snowflake usage and billing.
Solution overview
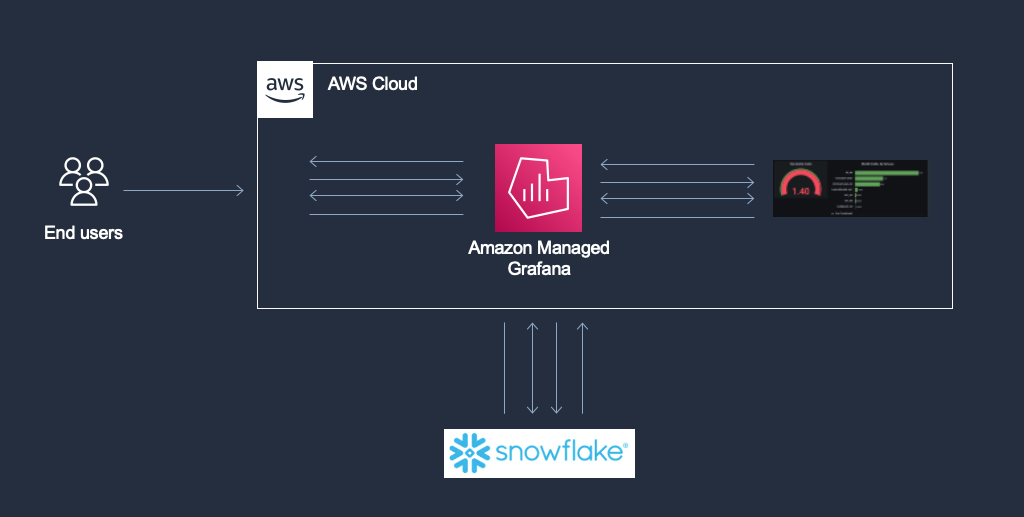
Figure 1. Architecture Diagram for this Snowflake and Amazon Managed Grafana Integration
In this example, we have integrated Amazon Managed Grafana with Snowflake as the data source to build dashboards to query and visualize Snowflake’s credits data from warehouse_metering_history table within Snowflake.
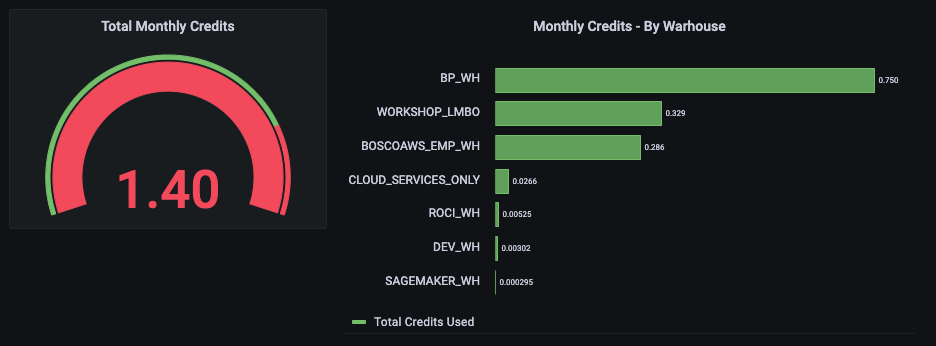
Figure 2: Visualization on Amazon Managed Grafana for Snowflake Credits Utilization
Once Amazon Managed Grafana and Snowflake have been configured, as shown in the figure above, you can visualize the total monthly Snowflake credits. In this example we have set up a Gauge metric. Furthermore, this gauge depicts a red overlay, since Snowflake credits used have reached a preconfigured threshold of 80%. However, the chart on the right depicts monthly Snowflake Credits used per-warehouse.
Walkthrough
Here are quick steps to get started with the Snowflake plugin in Amazon Managed Grafana:
- Step 1: Set up Amazon Managed Grafana
- Step 2: Set up the Snowflake Data Source on Amazon Managed Grafana
- Step 3: Set up Snowflake Dashboards on Amazon Managed Grafana
Prerequisites
For this walkthrough, you should have the following prerequisites:
• An AWS account
• Access to Amazon Managed Grafana with an Enterprise License
• Snowflake account
Step 1: Set up the Amazon Managed Grafana
Refer to Amazon Managed Grafana – Getting Started for information on how to configure Amazon Managed Grafana. Additionally, Amazon Managed Grafana also supports direct Security Assertion Markup Language (SAML) 2.0 integration via external Identity providers, without the need to go through AWS Identity and Access Management (IAM) or AWS IAM Identity Center (successor to AWS Single Sign-On). To use AWS IAM Identity Center with Amazon Managed Grafana, you must also have AWS Organizations activated in your account. If you don’t have it activated already, then Amazon Managed Grafana activates it when it activates AWS IAM Identity Center. If Amazon Managed Grafana enables Organizations, it also creates an organization for you. For more information about Organizations, see What is AWS Organizations.
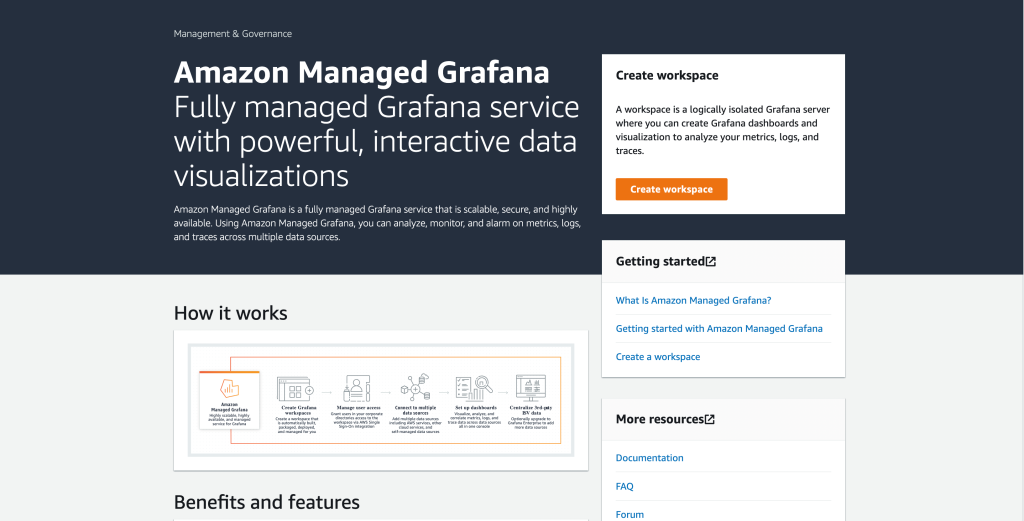
Figure 3: Amazon Managed Grafana getting started screen
Step 2: Set up the Snowflake Data Source for Amazon Managed Grafana
Authenticate into Amazon Managed Grafana environment via AWS IAM Identity Center (successor to AWS Single Sign-On) or SAML 2.0.
Next, to set up the Snowflake data source within Amazon Managed Grafana environment, choose Configuration, Data Sources, Add data source, then search and select Snowflake.
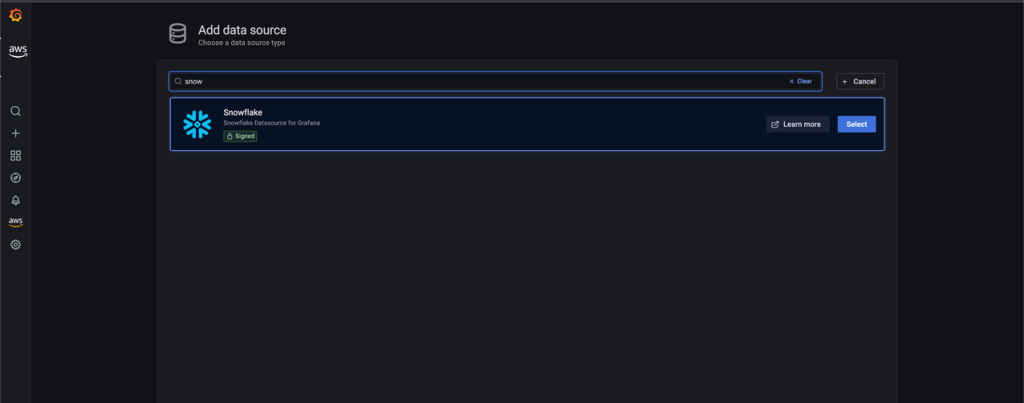
Figure 4: Adding Snowflake as Data source
Next, under Settings, enter the values for the following fields.
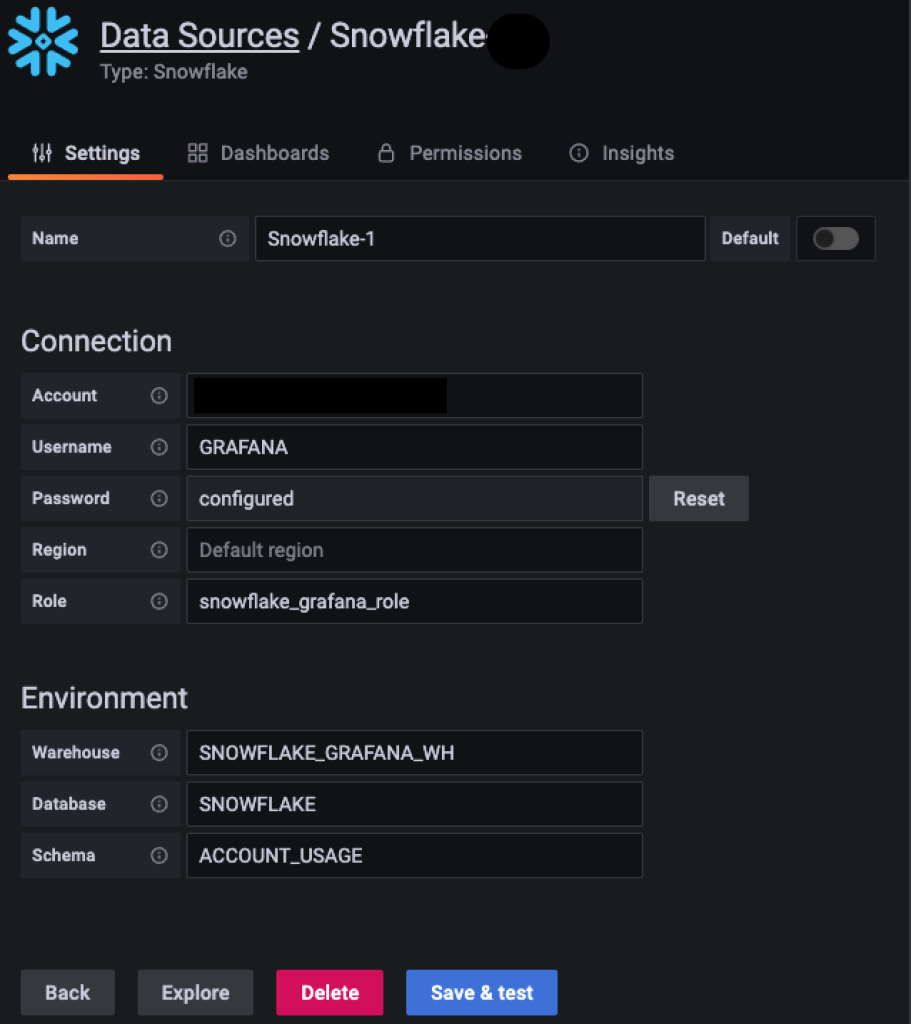
Figure 5: Configuring Snowflake Data source inside Amazon Managed Grafana
- Account name for Snowflake.
- Username for the service account.
- Password for the service account.
- Schema – set it to ACCOUNT_USAGE.
- Warehouse – provide the warehouse name.
- Database – set the warehouse name to SNOWFLAKE.
- Role – provide the respective role from Snowflake.
- Make sure that the role has imported privilege on the Snowflake database.
For example, you can run this sample query inside of your Snowflake worksheet to grant the required role.
Next, the User will require a read access to account_usage schema within Snowflake DB to perform the necessary lookups.
For example, you can run this sample query inside of your Snowflake worksheet to enable read access.
Step 3: Set up the Snowflake dashboard on Amazon Managed Grafana
Within the Amazon Managed Grafana environment, choose create a Dashboard.
Next, choose Add an empty and name the Panel ‘Credits Used’ to track the cumulative credits used.
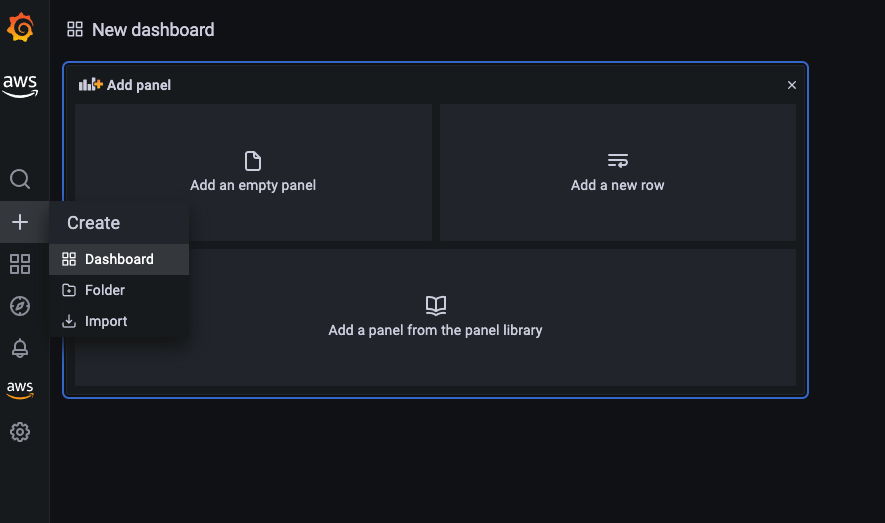
Figure 6: Create a new Dashboard inside Amazon Managed Grafana
Next, choose the newly created Snowflake data source from the drop down.
Provide the following sample query in the panel. Adjust the threshold values in the right side under Thresholds settings to reflect the color coding of the data.
Next, repeat the above steps to add an Empty panel and name the Panel ‘Credits per Warehouse’ to track the credits used per warehouse.
Choose Snowflake datasource from the drop-down at the bottom and supply the following query in the panel:
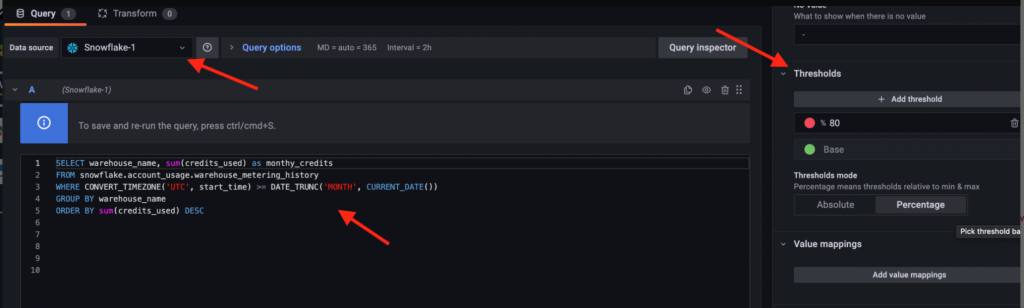
Figure 7: Query interface inside Amazon Managed Grafana
Since, Amazon Managed Grafana supports time series for more granular and detailed graph visualizations, you can use the $__timeFilter and $__timeGroup macros.
A sample time series query for visualizing Snowflake credits:
Alerting
You can configure alerts in your Amazon Managed Grafana workspace. In addition, you can enable notifications such as Amazon Simple Notification Service (Amazon SNS), Slack, OpsGenie, PagerDuty, and VictorOps to alert and notify.
In this example, via Amazon Managed Grafana let’s configure an alert on credits usage for a specific Snowflake warehouse and setup a SNS notification which will be triggered, once the pre-configured threshold value is breached.
To create an alert, add an Empty panel and name the Panel for example ‘Generate Credit Usage Alerts per Warehouse’ to track the credits used per warehouse or you can also choose Edit option inside an existing panel to modify the query and add alerts. Select the visualization as Time series to enable the Alert tab.
Choose Snowflake datasource from the drop-down at the bottom and you can supply the following sample query in the panel:
Next, select the Alert tab to create an Alert and configure the Condition to trigger an alert. An example Condition can be something like, if the average of the query is above a certain value, then trigger an Alert. You can also setup the necessary Notification channel to receive notifications.
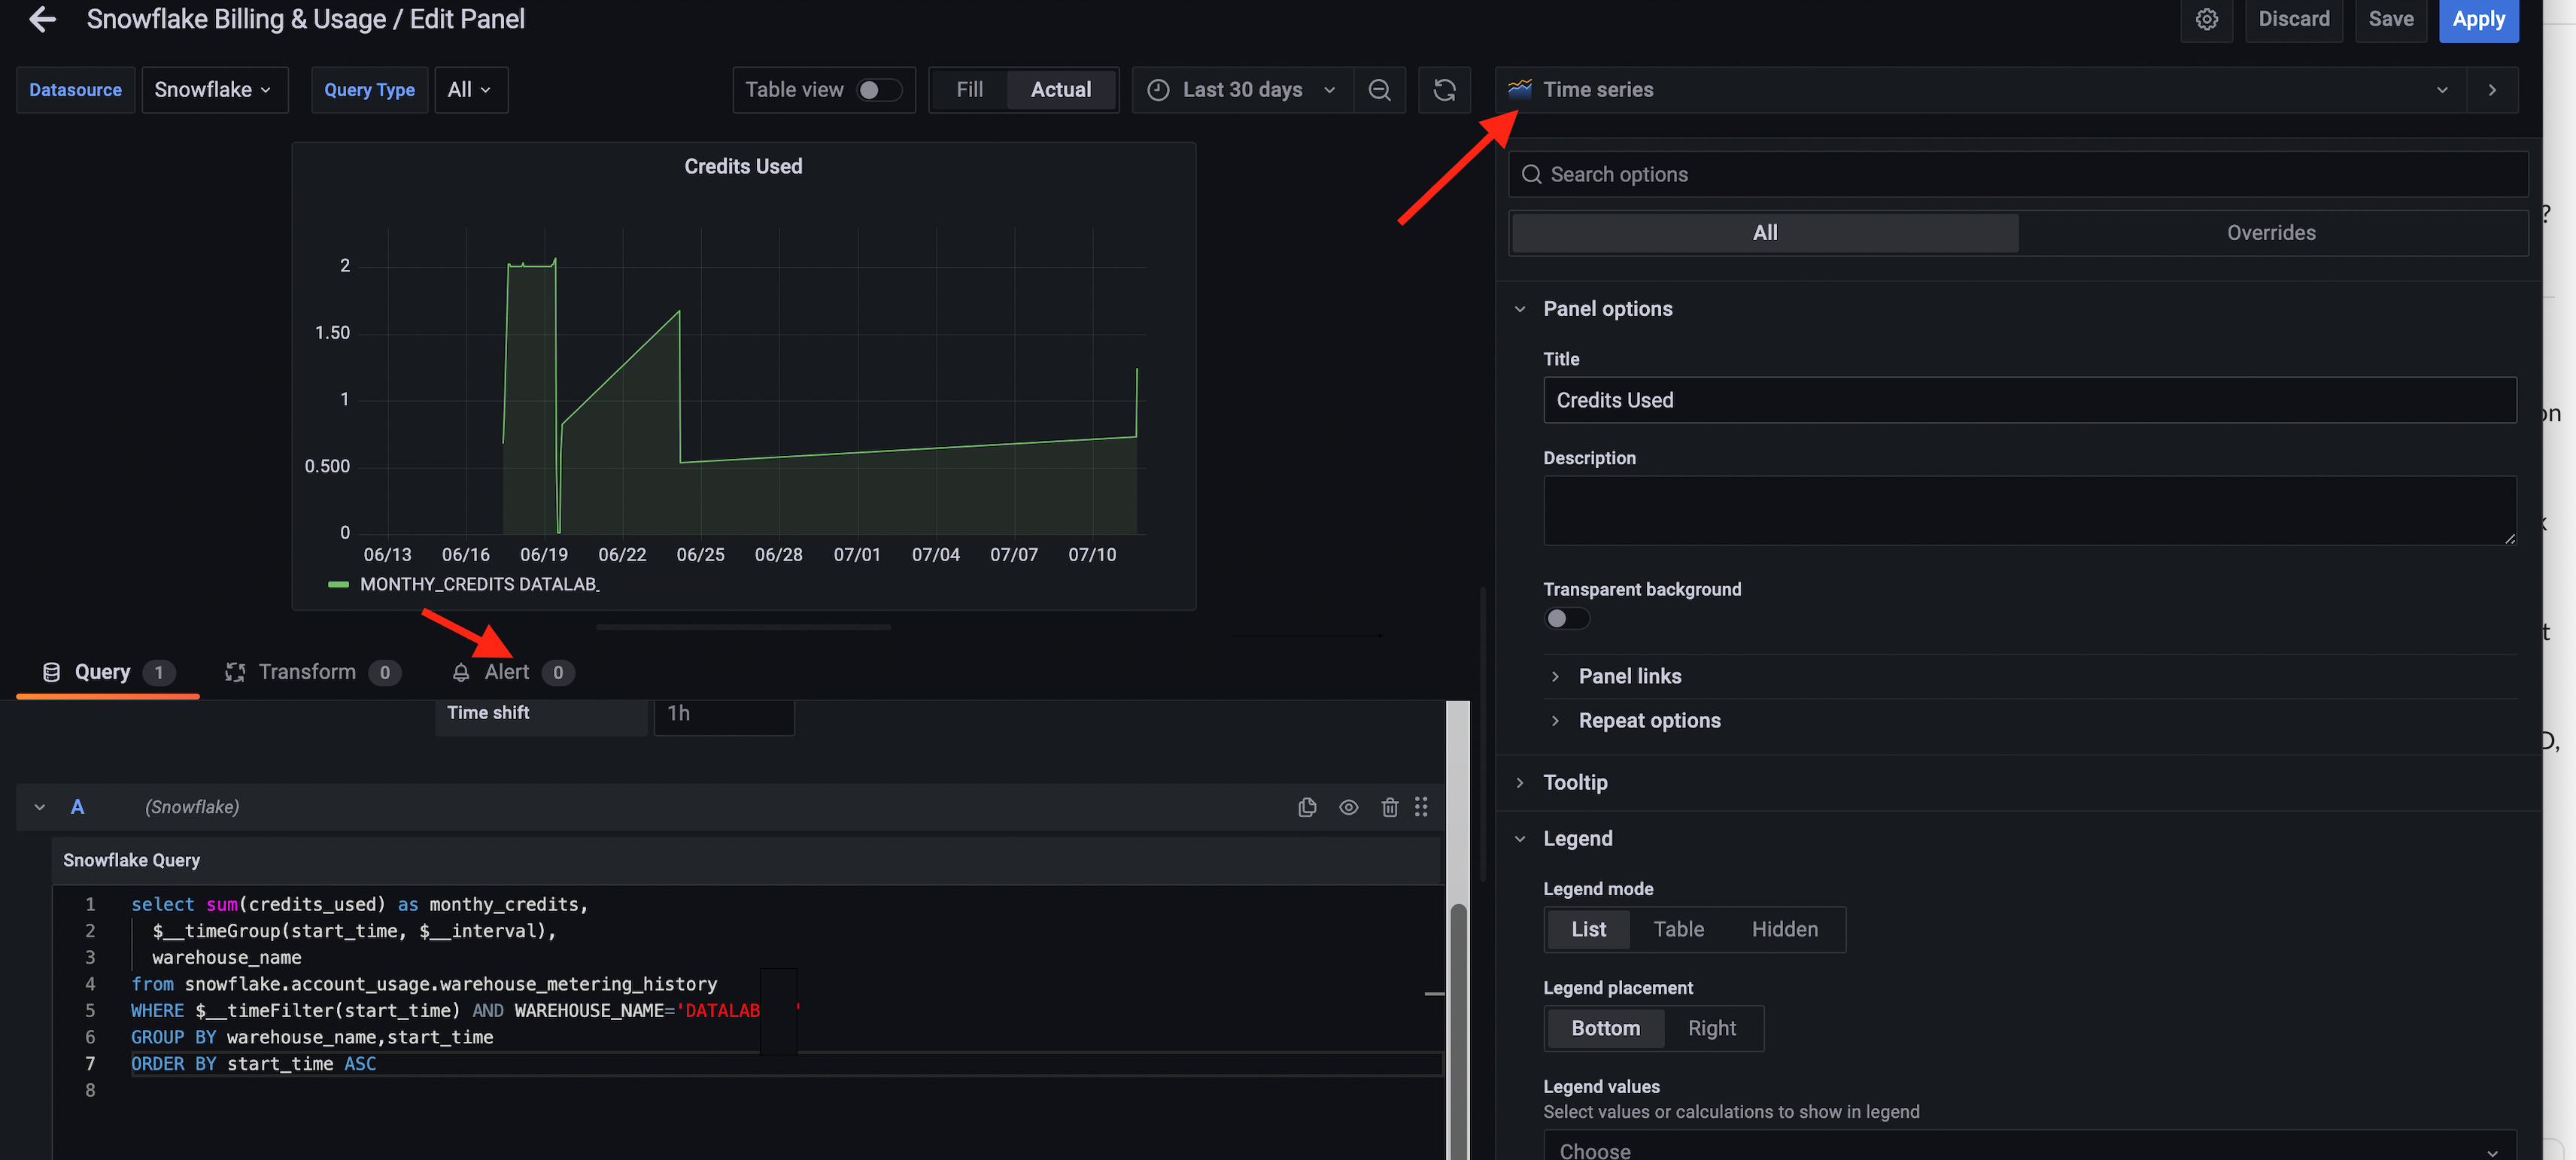
Figure 8: Alert configuration inside Amazon Managed Grafana which uses Time Series
To setup Notification Channel, select Alert icon on the left and choose Notification Channels and select New Notification Channel and configure the Notification channel.
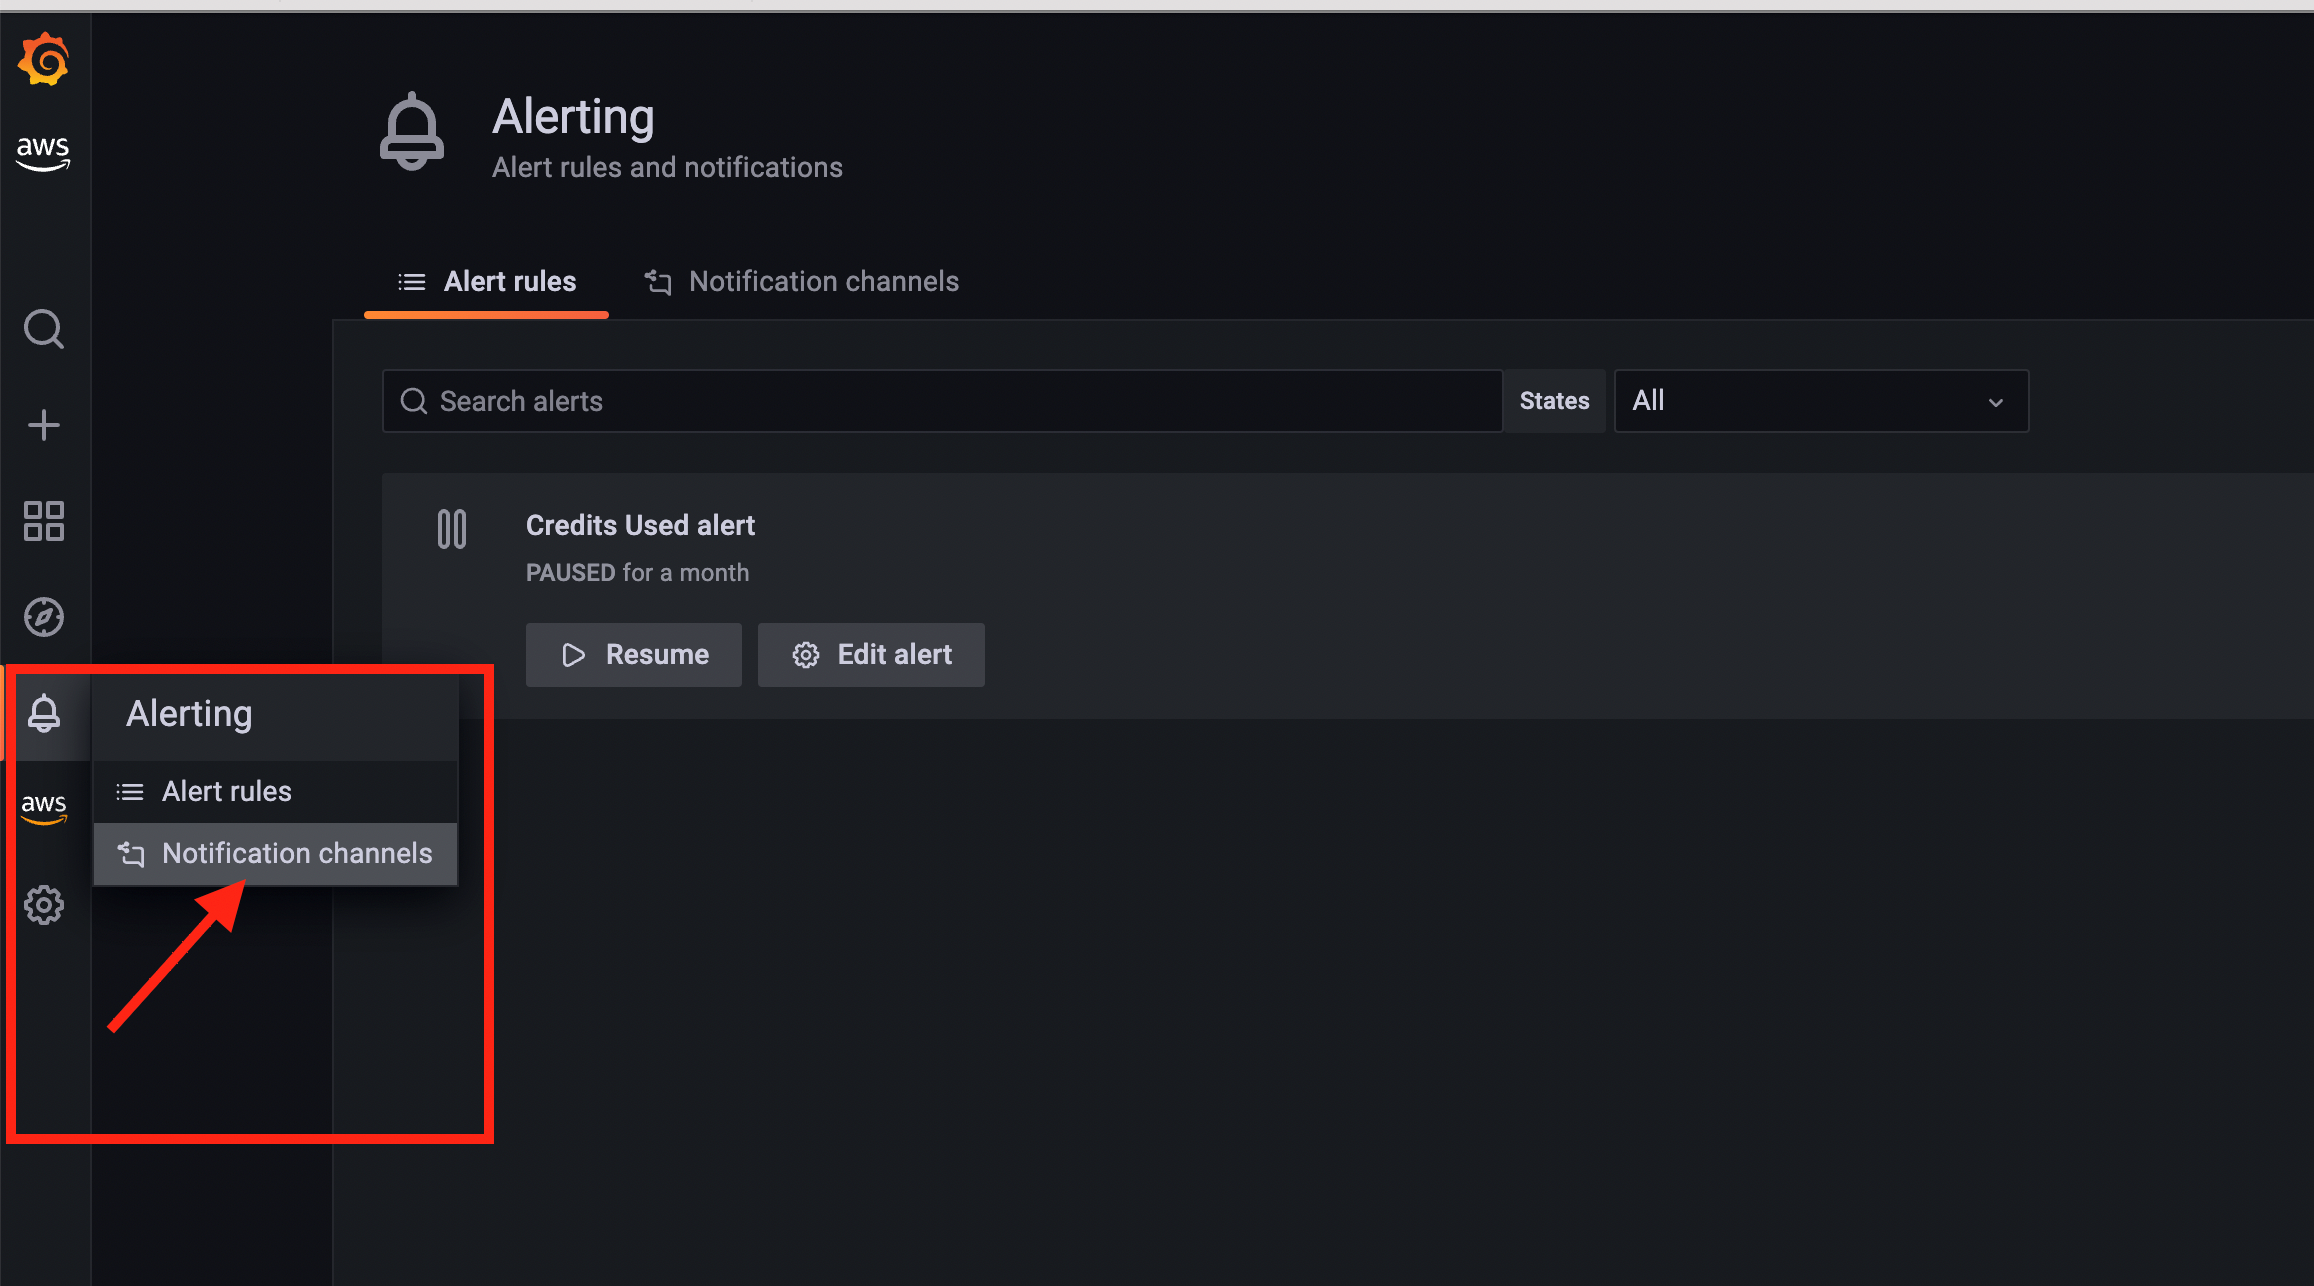
Figure 9: Configure Notification Channels under Alerting
If you have enabled service-managed permissions and included Amazon Simple Notification Service (Amazon SNS) as a notification channel for your Amazon Managed Grafana workspace, you only need to provide the SNS topic Amazon Resource Name (ARN) when you create your notification channel. The SNS topic must be prefixed with grafana for notifications to successfully publish to the topic. If you use customer-managed permissions, the IAM role that you supply should include SNS publish permissions for your SNS topic.
Under New notification Channel, provide a desired Name, Type (in this example it’s AWS SNS), Topic ARN and other required parameters, to receive the notification once the defined Threshold on your Alert is met.
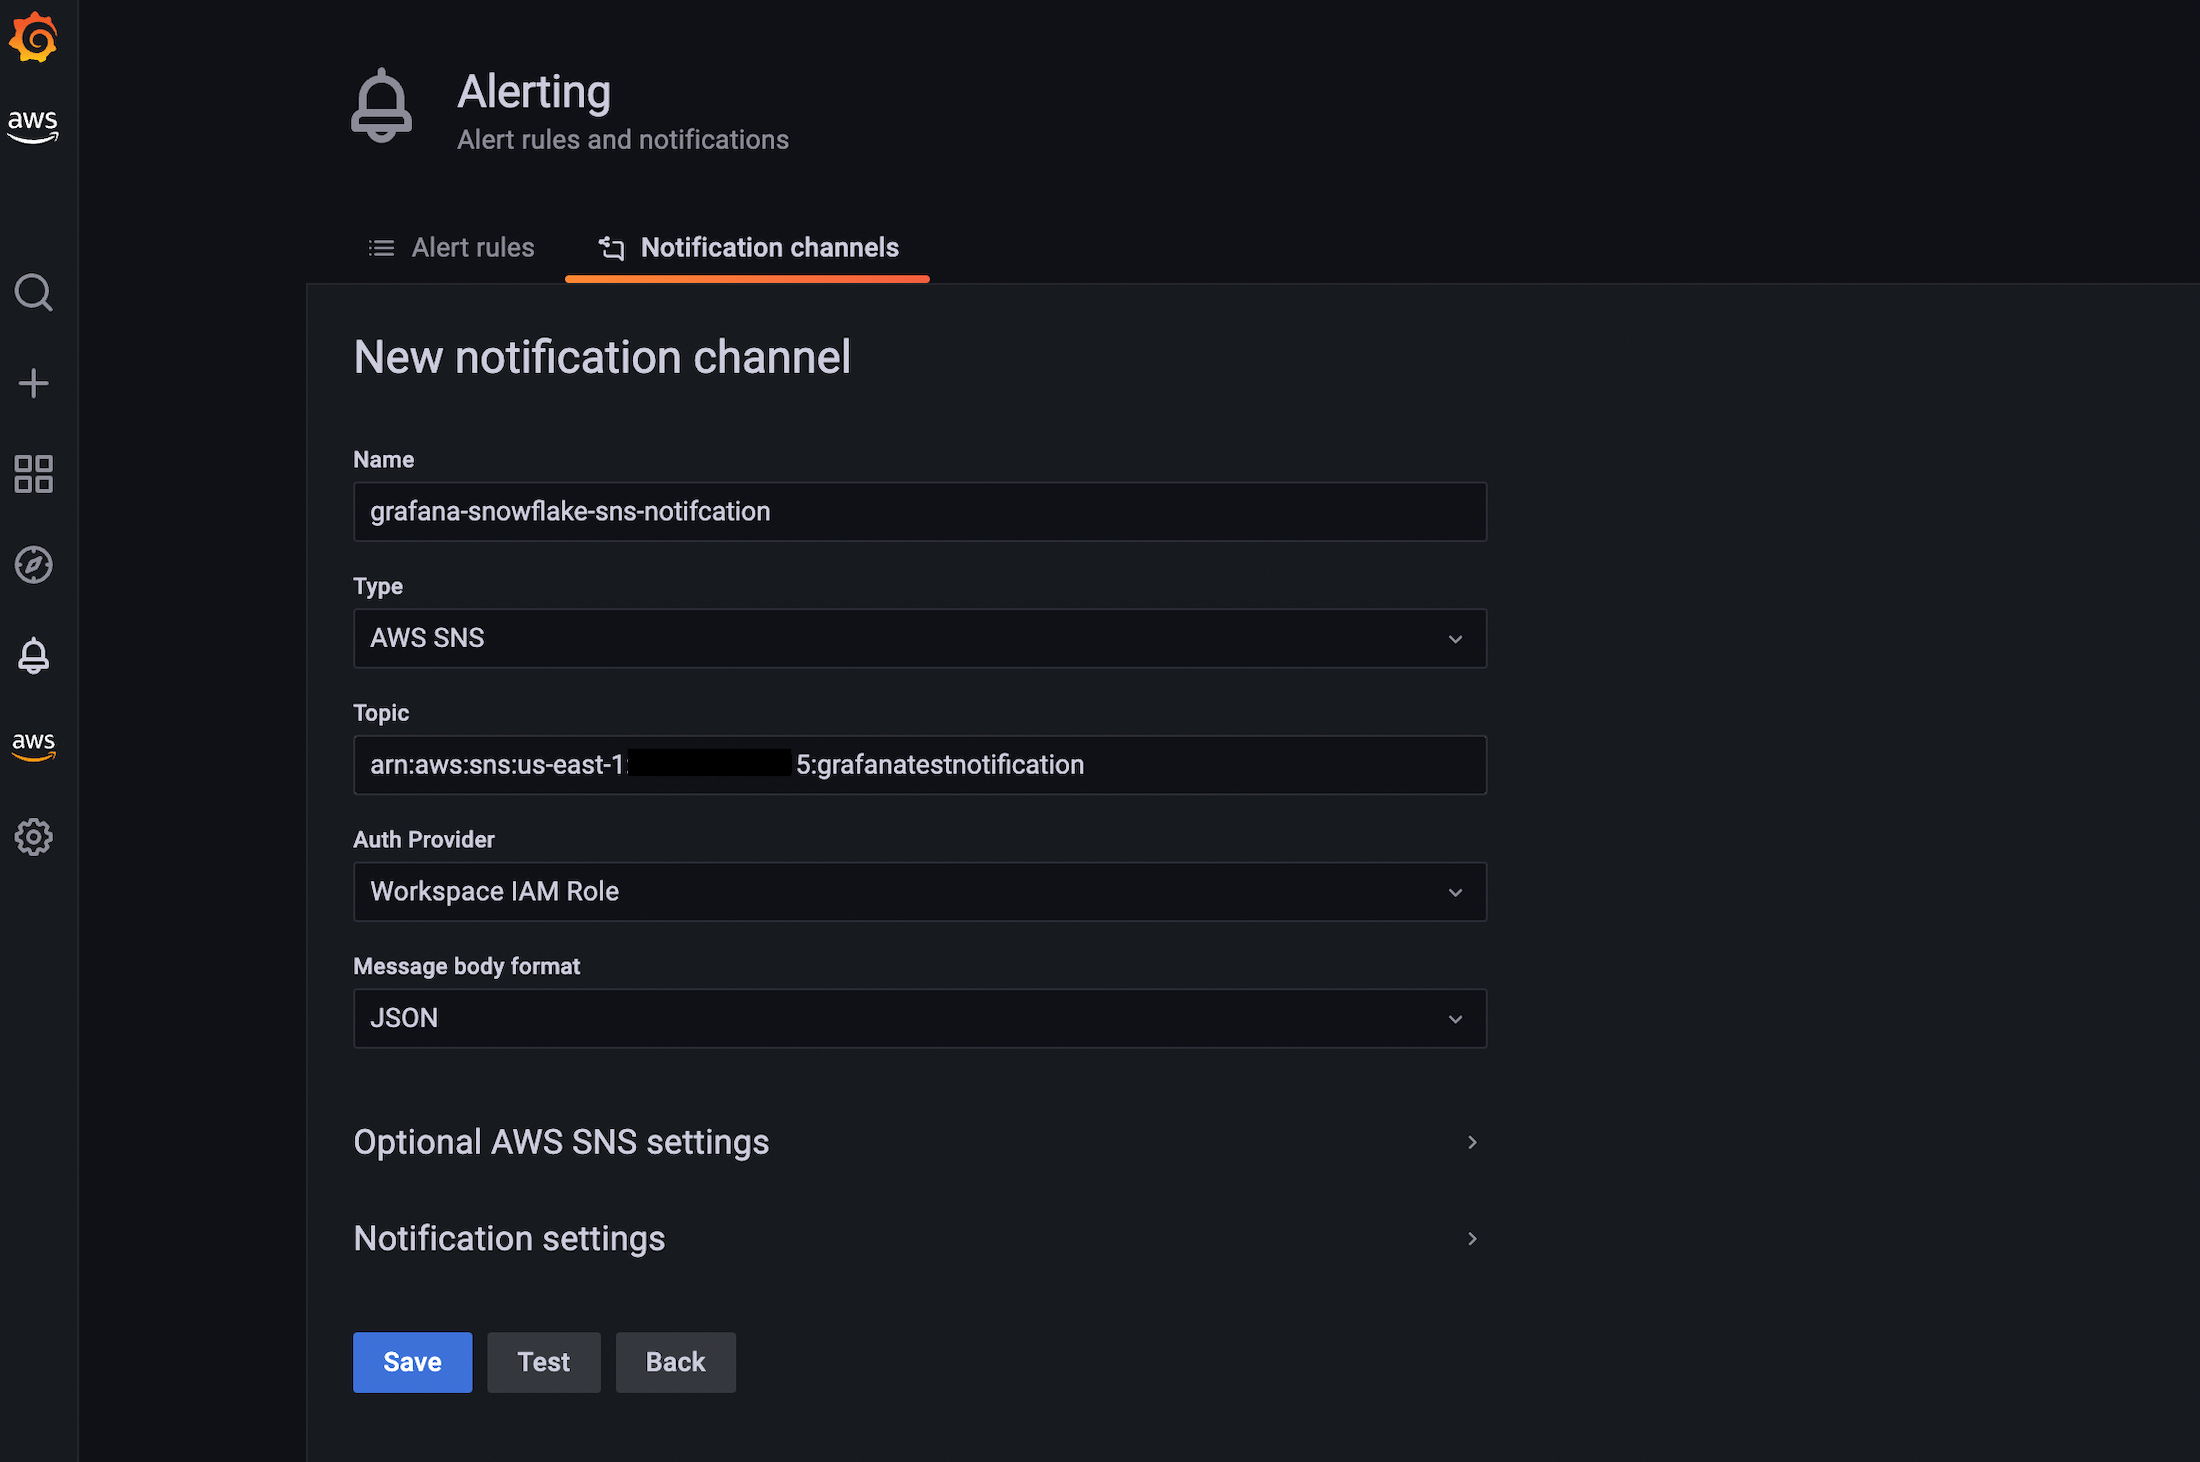
Figure 10: Configure AWS SNS Notification under New Notification channel
Cleaning up
To avoid incurring future charges, delete the resources, such as Amazon Managed Grafana workspace, Amazon SNS, etc. If you have signed-up for the Amazon Managed Grafana trial Enterprise license, then the license will expire after 30 days.
Conclusion
We’ve demonstrated how you can connect to Snowflake using Amazon Managed Grafana, as well as access credits consumed in your Snowflake account by various virtual warehouses. We also provided an overview on how to setup alerts inside Amazon Managed Grafana so that you’re notified when credit limits exceed warning thresholds to take the remedial action as needed.
Authors: