Networking & Content Delivery
Prepare and run performance tests for Amazon Cloudfront with Real User Monitoring
This blog post is written by Tanya Pahuja and Sumit Bhardwaj, Technical Account Managers – AWS Enterprise Support, with Karan Desai, Senior Solutions Architect, AWS
For consumer-facing websites and mobile apps, the speed at which the content loads on the user’s screens directly impacts the user’s browsing experience and the success of your business. If your content takes a long time to load, then your users might abandon the page before completing their transaction, thus affecting your revenue. You can use a content delivery network (CDN) like Amazon CloudFront to improve the performance of your website by securely delivering data, videos, applications, and APIs to your users globally with low latency and high transfer speeds. The static content of your website, such as HTML, images, stylesheets, and JavaScript files, can be served from cached copies stored at CloudFront edge locations and regional edge caches. Dynamic content which cannot be cached, such as newly updated content or API calls, are fetched by CloudFront from your origin servers and delivered over a fast and optimized path using the AWS global network.
To improve performance, you can simply configure your website’s traffic to be delivered over CloudFront’s globally distributed edge network by setting up a CloudFront distribution. Once you have set up your content to be delivered using CloudFront, you should monitor your website’s performance to understand the benefits you are deriving, and if there are any changes to be made to your configuration to optimize performance further. In this post, we show how to monitor your website’s performance using Amazon CloudWatch Real User Monitoring (RUM) to get insights into the difference in user experience when content is delivered with and without CloudFront.
Synthetic Monitoring and RUM for CloudFront
Typically, two different types of monitoring can be used for measuring performance of a website-
Synthetic Monitoring: This involves monitoring the performance of a website using a simulation of a user’s journey and interaction with the website. This is done in a controlled environment where variables such as geography, network, device, and browser are pre-determined and do not change. Controlling for external variables is helpful in understanding where performance bottlenecks exist on the backend infrastructure and application side, as well as identifying the source of any performance issues. However, this is not always representative of the experience your users have in the real world.
Real User Monitoring: This is a type of passive monitoring that analyzes actual user interaction with a website, typically by inserting a piece of code within the application that gathers feedback from the client or browser without having any effect on the user’s browsing experience. It gives you insights into how customers are interacting with your website and their experience with the website’s performance on their specific devices, browsers, and networks.
Architecture overview
We start by deploying a web application on Amazon Elastic Compute Cloud (Amazon EC2) instances behind an Application Load Balancer (ALB). You can use any existing web application you have, or deploy a sample three-tier web application following this tutorial. You interact with this website from your browser using the public ALB endpoint URL. This represents the baseline experience of your users before implementing CloudFront.
Once we have sufficient data, we configure a CloudFront distribution pointing to the same ALB we used earlier as the “origin” for this distribution. CloudFront provides a unique domain name for each distribution. Now, we interact with the website from the browser, but this time using the CloudFront URL. This represents the user experience after CloudFront has been implemented. We can compare the data captured from the two tests to understand the performance enhancements your users are getting by adding CloudFront for your content delivery. The following diagram shows the architecture for our tests.

Figure 1: Architecture diagram of the solution
CloudWatch Monitoring for CloudFront
Before we go into RUM, we can explore the CloudFront operational metrics that are directly integrated with CloudWatch. These metrics are available in the CloudWatch console and do not incur any additional cost. You can monitor the number of HTTP requests served by your CloudFront distribution, bytes downloaded and uploaded by users, and number of 4XX and 5XX errors, as seen in the following screenshot. You can also turn on additional metrics at an additional cost, such as the cache hit rate of your CloudFront distribution and origin latency for serving non-cached content.
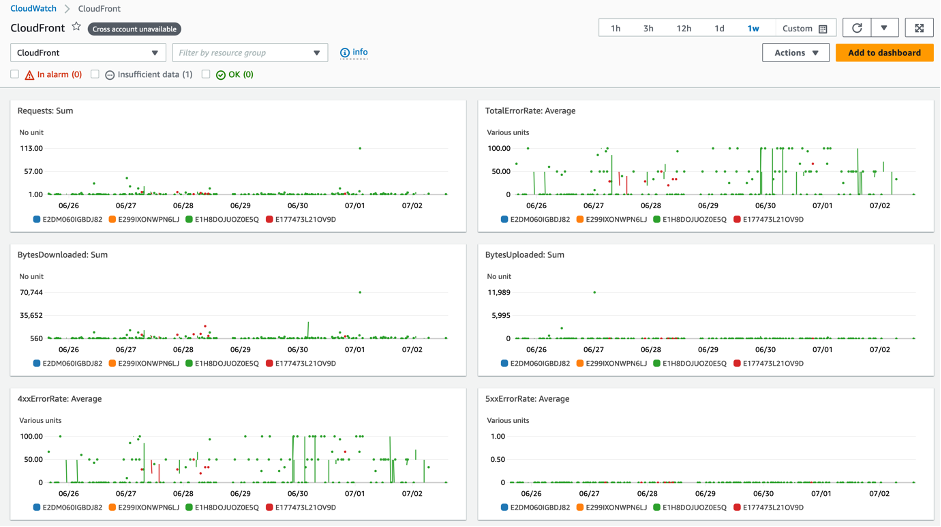
Figure 2: CloudFront monitoring metrics on CloudWatch
This data can be useful in determining the health of your website and getting an overview of user traffic coming to your website. However, it does not give insights about the user experience in terms of your website’s performance. This is where we leverage RUM.
Using RUM to examine a website’s performance
Now, we can move to RUM for the same web application. For this, you must first create an app monitor in CloudWatch RUM and insert the code snippet generated by it into the HTML page of your website whose performance you would like to monitor.
1) RUM without CloudFront
We start by first measuring performance without CloudFront. Get your ALB endpoint URL from the AWS Management Console, and access your website in the browser using this URL. As you browse the website, the code inserted in the web page sends several performance metrics to CloudWatch RUM. These can be monitored under the CloudWatch RUM section on the Console, as seen in the following screenshots.
Note that to install the CloudWatch RUM web client as an embedded script, you must paste the RUM web client configuration code snippet inside the <head> element of your application, above any other <script> tags.

Figure 3: Example of CloudWatch RUM script inserted into HTML page
The Performance tab shows the vital signs for the webpage, such as page load times and any errors encountered by the user, followed by additional information. The vital signs are apportioned into three levels: Positive, Tolerable, and Frustrating.
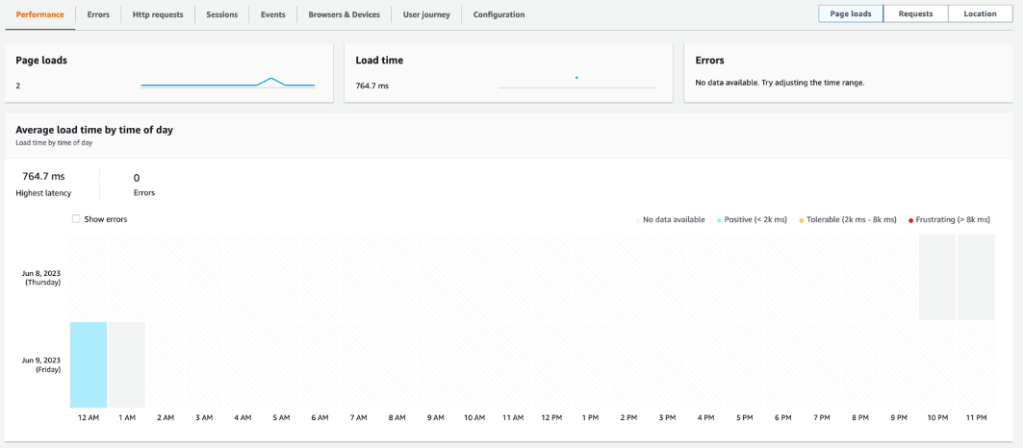
Figure 4: CloudWatch Performance tab showing page load times
You can also see the time taken by each of the steps that go into loading a webpage completely on the browser of the user. These include the time taken to establish the initial connection, SSL handshake, time to load the first byte of content, complete load time, etc.
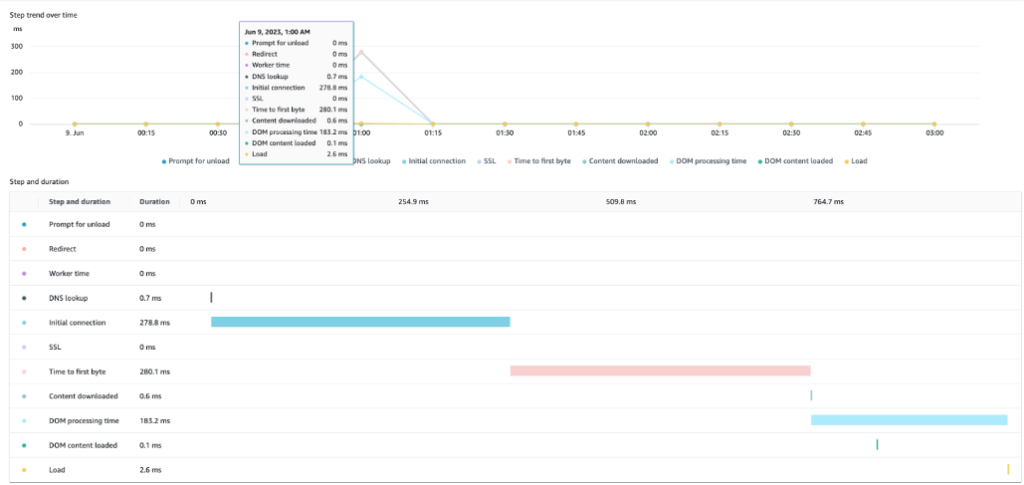
Figure 5: Example of granular breakdown of time taken for each step involved in loading a webpage
In the preceding example, you can observe that the average time it takes to load a web page for this particular user is 764ms, with the initial connection taking 278ms and Time to first Byte 280ms. You can use this as a baseline to compare how the performance is when we deliver this same webpage using CloudFront.
2) RUM with CloudFront
Now you can go to the CloudFront distribution you created earlier on the AWS Console and get the CloudFront domain URL. Then, you can access the website using this URL in your browser. This once again sends new data points to CloudWatch RUM, which shows the user experience when the content is delivered using CloudFront. You can monitor the performance metrics again.
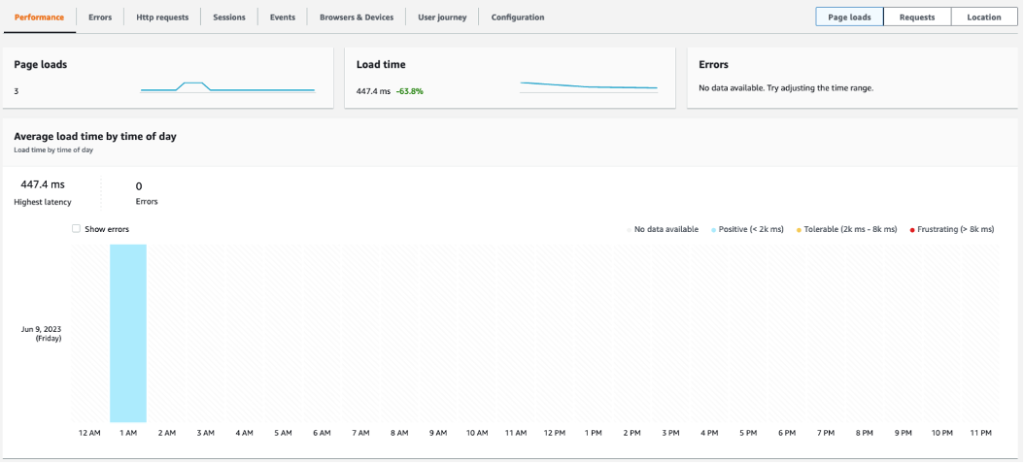
Figure 6: CloudWatch Performance tab showing page load times with CloudFront enabled
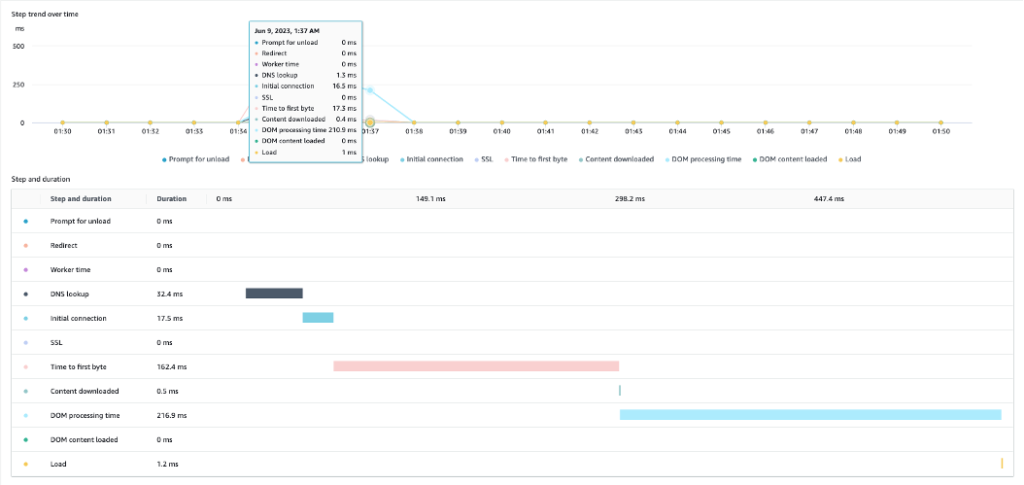
Figure 7: Granular breakdown of time taken for each step involved in loading a webpage with CloudFront enabled
In the preceding example, you can see that the total time it takes to load a web page for the same user is now 447ms. It has taken only 17.5ms for the initial connection. Here you can observe that deploying CloudFront in front of the ALB has improved the user experience by accelerating page load times by almost 40%
CloudWatch RUM provides several additional insights for your website delivered using CloudFront. You can see the performance of your website for users in different geographies and compare which users are getting a good experience or a frustrating experience due to longer page load times, as seen in the following screenshot.
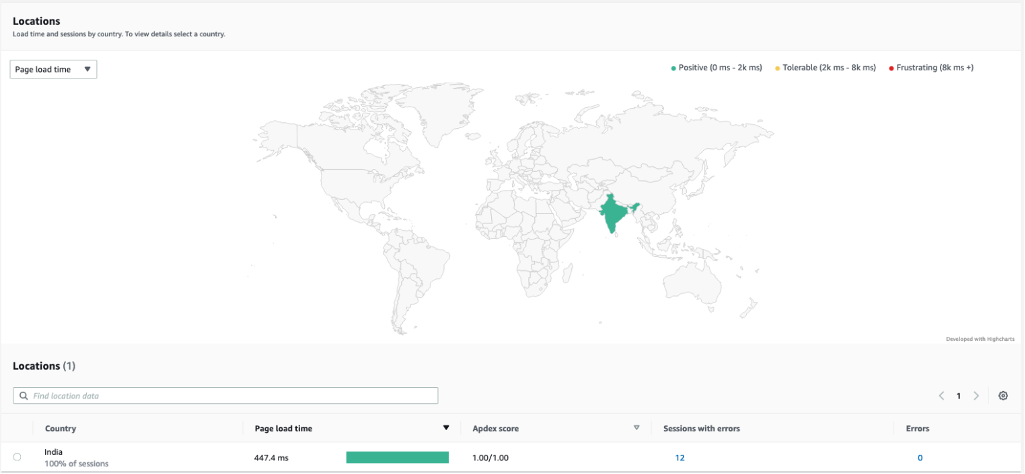
Figure 8: Example of page load performance by geographical locations of users, provided by CloudWatch RUM
You can also get the details of the browsing experience for your users accessing your website using different browsers and device types, as seen in the following screenshot.

Figure 9: Example of page load performance by browser of users, provided by CloudWatch RUM
Furthermore, you can access the original log entries for every event that RUM is monitoring, as well as the user journey as they navigate your website, as seen in the following screenshot.
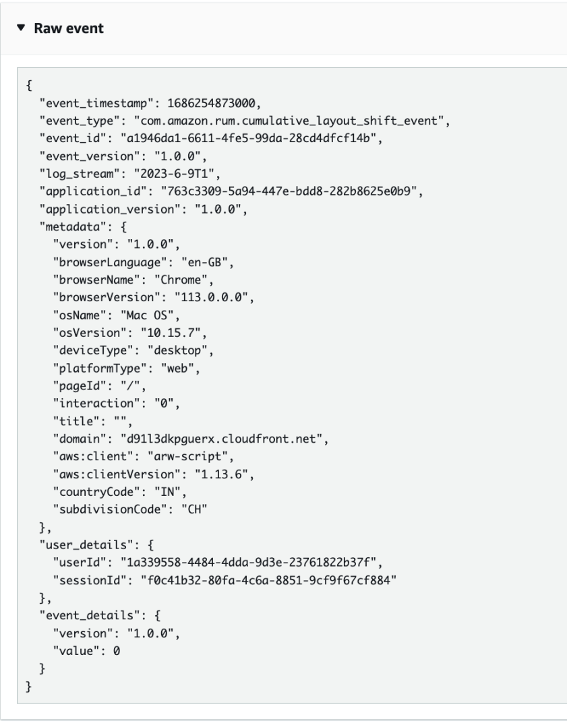
Figure 10: Example of a CloudWatch RUM raw event log
You can also follow the complete user journey from landing page to subsequent interactions with the website, as seen in the screenshot below.
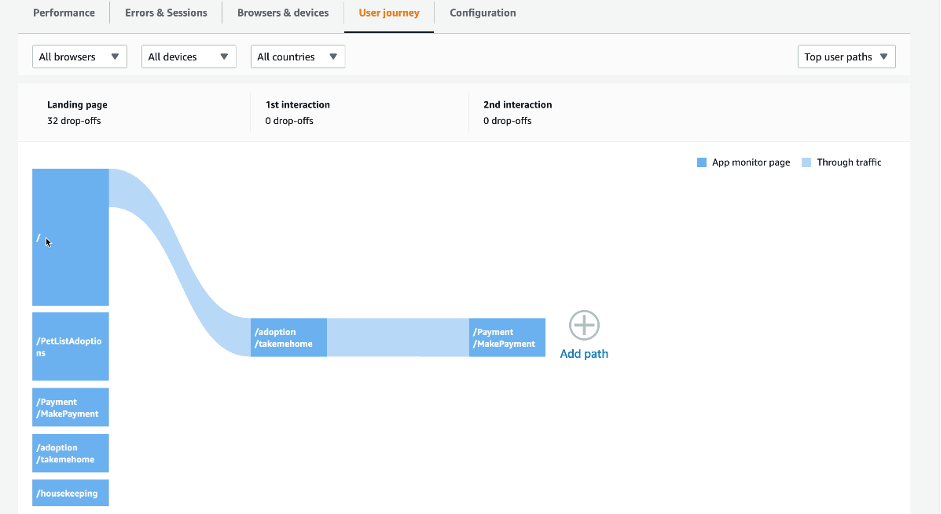
Figure 11: Example of user journey tracked using CloudWatch RUM
Conclusion
In this post, you learned how RUM can be used to get insights into your website’s performance for your end users, and how can you monitor the improvements you can get by leveraging CloudFront. Once you have this data, you can identify which aspects of your application can be further optimized to enhance user experience, and you can further improve your website performance by configuring various features offered by CloudFront.

Karan Desai
Karan is a Solutions Architect at AWS in India. He has over twelve years of cloud industry experience, with a focus on edge technologies and security. He currently works with companies in their early phases of cloud adoption, designing scalable cost-efficient solutions to modernize and grow using AWS. Outside of work, he can be found traveling to offbeat places and trying out unusual foods.

Tanya Pahuja
Tanya is a Technical Account Manager at AWS based out of Delhi, India. With a passion for digital transformation, she is committed to partnering with customers to ensure their success on AWS. She is also a regular speaker at AWS events and on the AWS Twitch channel. Beyond her professional sphere, she has a penchant for classical musical instruments.

Sumit Bhardwaj
Sumit is a Technical Account Manager at AWS with 9+ years of industry experience. He is a technology enthusiast, enjoys tackling complex challenges and ensuring flawless cloud operations for AWS customers. Beyond his professional pursuits, Sumit enjoys delving into books during his free time. He’s also an avid traveler, always eager to explore new places.