AWS Security Blog
Automatically detect and block low-volume network floods
In this blog post, I show you how to deploy a solution that uses AWS Lambda to automatically manage the lifecycle of Amazon VPC Network Access Control List (ACL) rules to mitigate network floods detected using Amazon CloudWatch Logs Insights and Amazon Timestream.
Application teams should consider the impact unexpected traffic floods can have on an application’s availability. Internet-facing applications can be susceptible to traffic that some distributed denial of service (DDoS) mitigation systems can’t detect. For example, hit-and-run events are a popular approach that use short-lived floods that reoccur at random intervals. Each burst is small enough to go unnoticed by mitigation systems, but still occur often enough and are large enough to be disruptive. Automatically detecting and blocking temporary sources of invalid traffic, combined with other best practices, can strengthen the resiliency of your applications and maintain customer trust.
Use resilient architectures
AWS customers can use prescriptive guidance to improve DDoS resiliency by reviewing the AWS Best Practices for DDoS Resiliency. It describes a DDoS-resilient reference architecture as a guide to help you protect your application’s availability.
The best practices above address the needs of most AWS customers; however, in this blog we cover a few outlier examples that fall outside normal guidance. Here are a few examples that might describe your situation:
- You need to operate functionality that isn’t yet fully supported by an AWS managed service that takes on the responsibility of DDoS mitigation.
- Migrating to an AWS managed service such as Amazon Route 53 isn’t immediately possible and you need an interim solution that mitigates risks.
- Network ingress must be allowed from a wide public IP space that can’t be restricted.
- You’re using public IP addresses assigned from the Amazon pool of public IPv4 addresses (which can’t be protected by AWS Shield) rather than Elastic IP addresses.
- The application’s technology stack has limited or no support for horizontal scaling to absorb traffic floods.
- Your HTTP workload sits behind a Network Load Balancer and can’t be protected by AWS WAF.
- Network floods are disruptive but not significant enough (too infrequent or too low volume) to be detected by your managed DDoS mitigation systems.
For these situations, VPC network ACLs can be used to deny invalid traffic. Normally, the limit on rules per network ACL makes them unsuitable for handling truly distributed network floods. However, they can be effective at mitigating network floods that aren’t distributed enough or large enough to be detected by DDoS mitigation systems.
Given the dynamic nature of network traffic and the limited size of network ACLs, it helps to automate the lifecycle of network ACL rules. In the following sections, I show you a solution that uses network ACL rules to automatically detect and block infrastructure layer traffic within 2–5 minutes and automatically removes the rules when they’re no longer needed.
Detecting anomalies in network traffic
You need a way to block disruptive traffic while not impacting legitimate traffic. Anomaly detection can isolate the right traffic to block. Every workload is unique, so you need a way to automatically detect anomalies in the workload’s traffic pattern. You can determine what is normal (a baseline) and then detect statistical anomalies that deviate from the baseline. This baseline can change over time, so it needs to be calculated based on a rolling window of recent activity.
Z-scores are a common way to detect anomalies in time-series data. The process for creating a Z-score is to first calculate the average and standard deviation (a measure of how much the values are spread out) across all values over a span of time. Then for each value in the time window calculate the Z-score as follows:
Z-score = (value – average) / standard deviation
A Z-score exceeding 3.0 indicates the value is an outlier that is greater than 99.7 percent of all other values.
To calculate the Z-score for detecting network anomalies, you need to establish a time series for network traffic. This solution uses VPC flow logs to capture information about the IP traffic in your VPC. Each VPC flow log record provides a packet count that’s aggregated over a time interval. Each flow log record aggregates the number of packets over an interval of 60 seconds or less. There isn’t a consistent time boundary for each log record. This means raw flow log records aren’t a predictable way to build a time series. To address this, the solution processes flow logs into packet bins for time series values. A packet bin is the number of packets sent by a unique source IP address within a specific time window. A source IP address is considered an anomaly if any of its packet bins over the past hour exceed the Z-score threshold (default is 3.0).
When overall traffic levels are low, there might be source IP addresses with a high Z-score that aren’t a risk. To mitigate against false positives, source IP addresses are only considered to be an anomaly if the packet bin exceeds a minimum threshold (default is 12,000 packets).
Let’s review the overall solution architecture.
Solution overview
This solution, shown in Figure 1, uses VPC flow logs to capture information about the traffic reaching the network interfaces in your public subnets. CloudWatch Logs Insights queries are used to summarize the most recent IP traffic into packet bins that are stored in Timestream. The time series table is queried to identify source IP addresses responsible for traffic that meets the anomaly threshold. Anomalous source IP addresses are published to an Amazon Simple Notification Service (Amazon SNS) topic. A Lambda function receives the SNS message and decides how to update the network ACL.
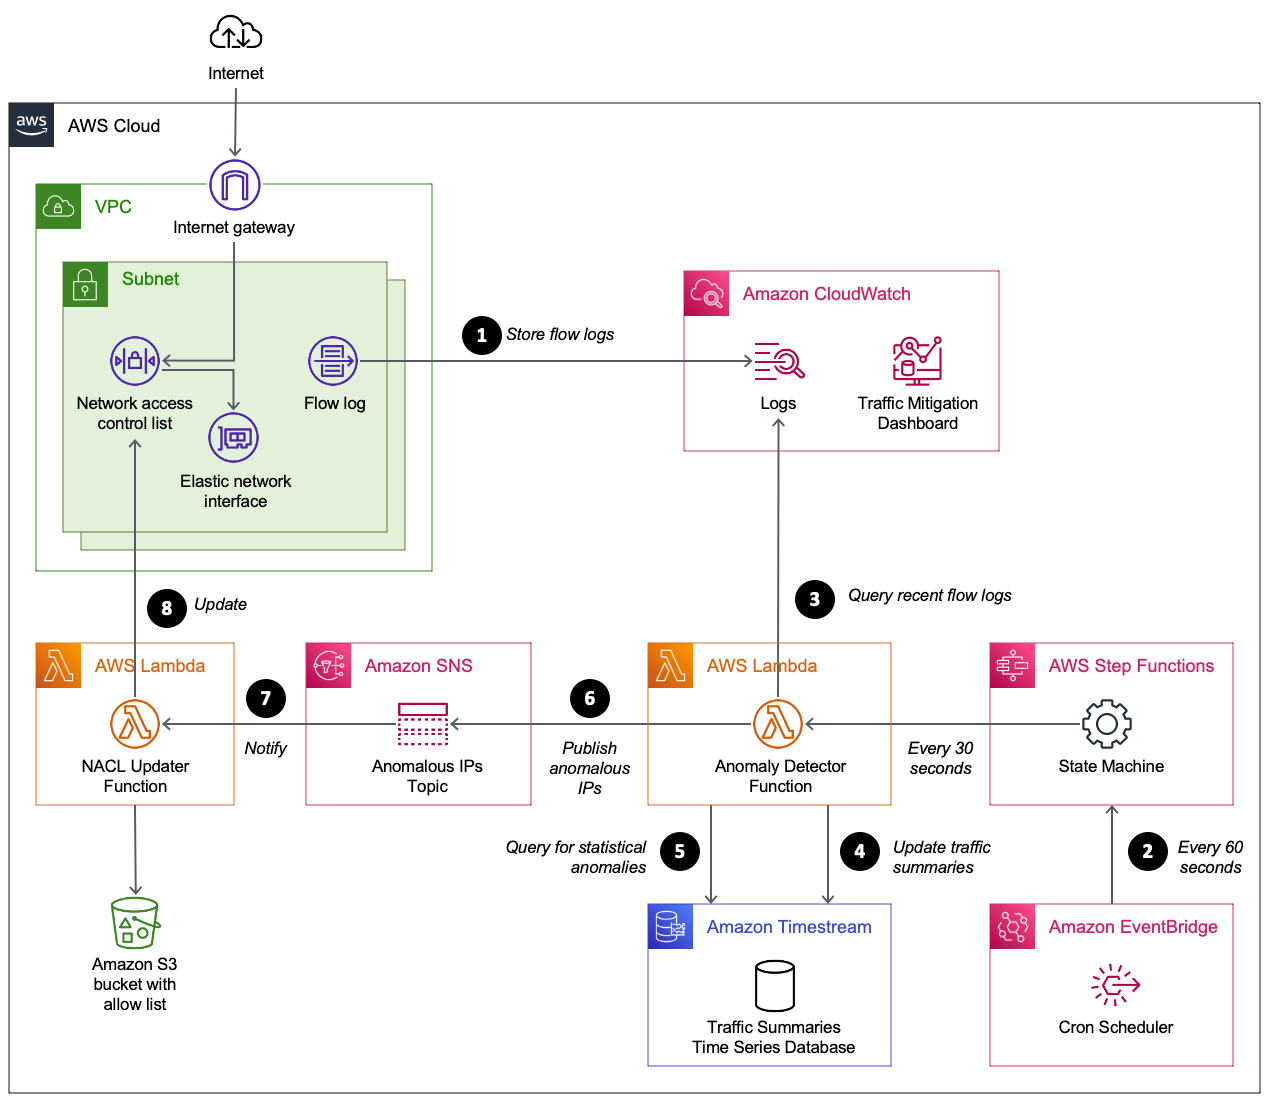
Figure 1: Automating the detection and mitigation of traffic floods using network ACLs
How it works
The numbered steps that follow correspond to the numbers in Figure 1.
- Capture VPC flow logs. Your VPC is configured to stream flow logs to CloudWatch Logs. To minimize cost, the flow logs are limited to particular subnets and only include log fields required by the CloudWatch query. When protecting an endpoint that spans multiple subnets (such as a Network Load Balancer using multiple availability zones), each subnet shares the same network ACL and is configured with a flow log that shares the same CloudWatch log group.
- Scheduled flow log analysis. Amazon EventBridge starts an AWS Step Functions state machine on a time interval (60 seconds by default). The state machine starts a Lambda function immediately, and then again after 30 seconds. The Lambda function performs steps 3–6.
- Summarize recent network traffic. The Lambda function runs a CloudWatch Logs Insights query. The query scans the most recent flow logs (5-minute window) to summarize packet frequency grouped by source IP. These groupings are called packet bins, where each bin represents the number of packets sent by a source IP within a given minute of time.
- Update time series database. A time series database in Timestream is updated with the most recent packet bins.
- Use statistical analysis to detect abusive source IPs. A Timestream query is used to perform several calculations. The query calculates the average bin size over the past hour, along with the standard deviation. These two values are then used to calculate the maximum Z-score for all source IPs over the past hour. This means an abusive IP will remain flagged for one hour even if it stopped sending traffic. Z-scores are sorted so that the most abusive source IPs are prioritized. If a source IP meets these two criteria, it is considered abusive.
- Maximum Z-score exceeds a threshold (defaults to 3.0).
- Packet bin exceeds a threshold (defaults to 12,000). This avoids flagging source IPs during periods of overall low traffic when there is no need to block traffic.
- Publish anomalous source IPs. Publish a message to an Amazon SNS topic with a list of anomalous source IPs. The function also publishes CloudWatch metrics to help you track the number of unique and abusive source IPs over time. At this point, the flow log summarizer function has finished its job until the next time it’s invoked from EventBridge.
- Receive anomalous source IPs. The network ACL updater function is subscribed to the SNS topic. It receives the list of anomalous source IPs.
- Update the network ACL. The network ACL updater function uses two network ACLs called blue and green. This verifies that the active rules remain in place while updating the rules in the inactive network ACL. When the inactive network ACL rules are updated, the function swaps network ACLs on each subnet. By default, each network ACL has a limit of 20 rules. If the number of anomalous source IPs exceeds the network ACL limit, the source IPs with the highest Z-score are prioritized. CloudWatch metrics are provided to help you track the number of source IPs blocked, and how many source IPs couldn’t be blocked due to network ACL limits.
Prerequisites
This solution assumes you have one or more public subnets used to operate an internet-facing endpoint.
Deploy the solution
Follow these steps to deploy and validate the solution.
- Download the latest release from GitHub.
- Upload the AWS CloudFormation templates and Python code to an S3 bucket.
- Gather the information needed for the CloudFormation template parameters.
- Create the CloudFormation stack.
- Monitor traffic mitigation activity using the CloudWatch dashboard.
Let’s review the steps I followed in my environment.
Step 1. Download the latest release
I create a new directory on my computer named auto-nacl-deploy. I review the releases on GitHub and choose the latest version. I download auto-nacl.zip into the auto-nacl-deploy directory. Now it’s time to stage this code in Amazon Simple Storage Service (Amazon S3).
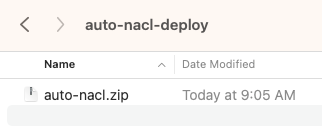
Figure 2: Save auto-nacl.zip to the auto-nacl-deploy directory
Step 2. Upload the CloudFormation templates and Python code to an S3 bucket
I extract the auto-nacl.zip file into my auto-nacl-deploy directory.
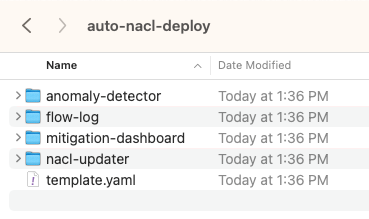
Figure 3: Expand auto-nacl.zip into the auto-nacl-deploy directory
The template.yaml file is used to create a CloudFormation stack with four nested stacks. You copy all files to an S3 bucket prior to creating the stacks.
To stage these files in Amazon S3, use an existing bucket or create a new one. For this example, I used an existing S3 bucket named auto-nacl-us-east-1. Using the Amazon S3 console, I created a folder named artifacts and then uploaded the extracted files to it. My bucket now looks like Figure 4.
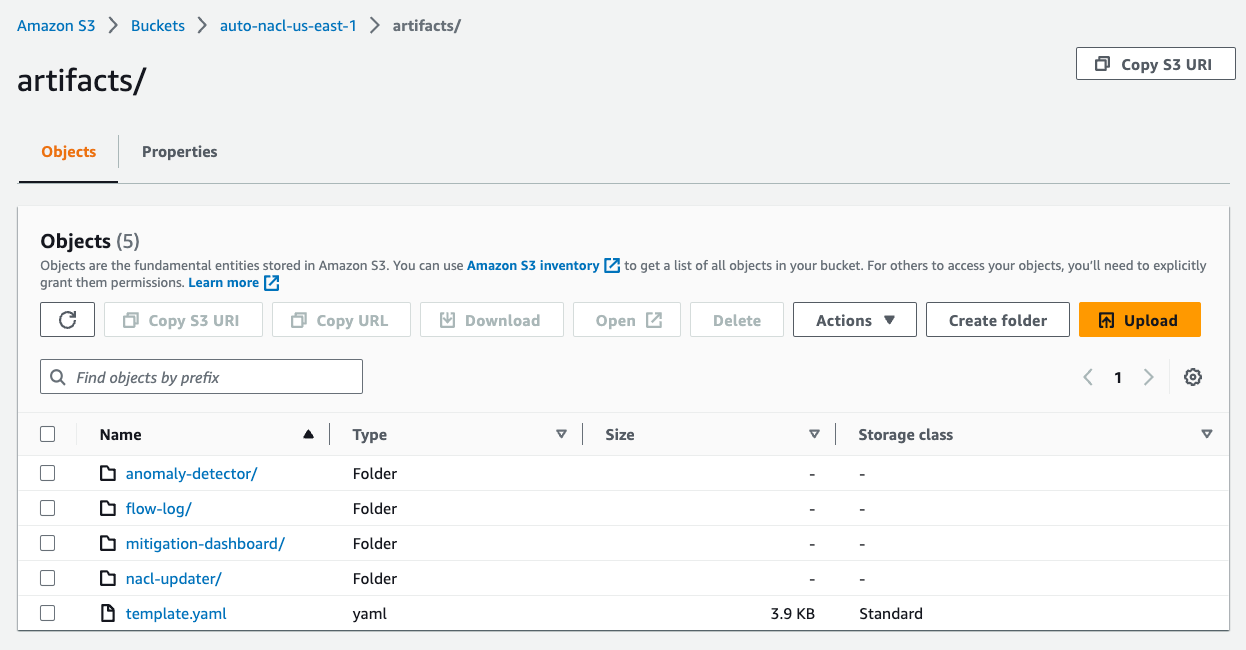
Figure 4: Upload the extracted files to Amazon S3
Step 3. Gather information needed for the CloudFormation template parameters
There are six parameters required by the CloudFormation template.
| Template parameter | Parameter description |
| VpcId | The ID of the VPC that runs your application. |
| SubnetIds | A comma-delimited list of public subnet IDs used by your endpoint. |
| ListenerPort | The IP port number for your endpoint’s listener. |
| ListenerProtocol | The Internet Protocol (TCP or UDP) used by your endpoint. |
| SourceCodeS3Bucket | The S3 bucket that contains the files you uploaded in Step 2. This bucket must be in the same AWS Region as the CloudFormation stack. |
| SourceCodeS3Prefix | The S3 prefix (folder) of the files you uploaded in Step 2. |
For the VpcId parameter, I use the VPC console to find the VPC ID for my application.
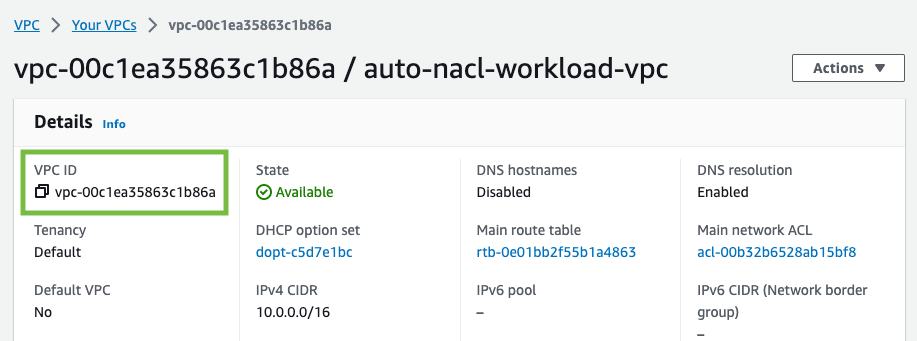
Figure 5: Find the VPC ID
For the SubnetIds parameter, I use the VPC console to find the subnet IDs for my application. My VPC has public and private subnets. For this solution, you only need the public subnets.
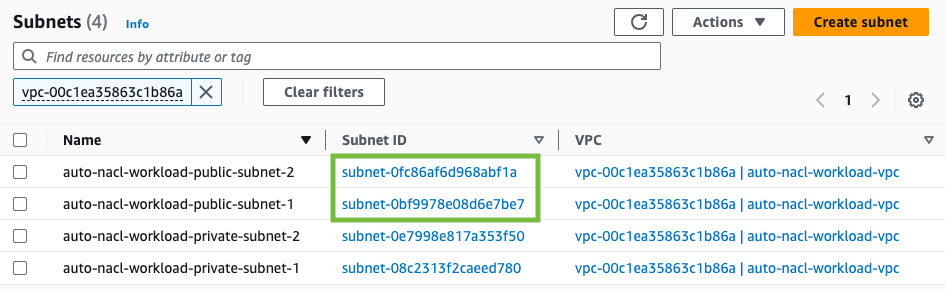
Figure 6: Find the subnet IDs
My application uses a Network Load Balancer that listens on port 80 to handle TCP traffic. I use 80 for ListenerPort and TCP for ListenerProtocol.
The next two parameters are based on the Amazon S3 location I used earlier. I use auto-nacl-us-east-1 for SourceCodeS3Bucket and artifacts for SourceCodeS3Prefix.
Step 4. Create the CloudFormation stack
I use the CloudFormation console to create a stack. The Amazon S3 URL format is https://<bucket>.s3.<region>.amazonaws.com/<prefix>/template.yaml. I enter the Amazon S3 URL for my environment, then choose Next.
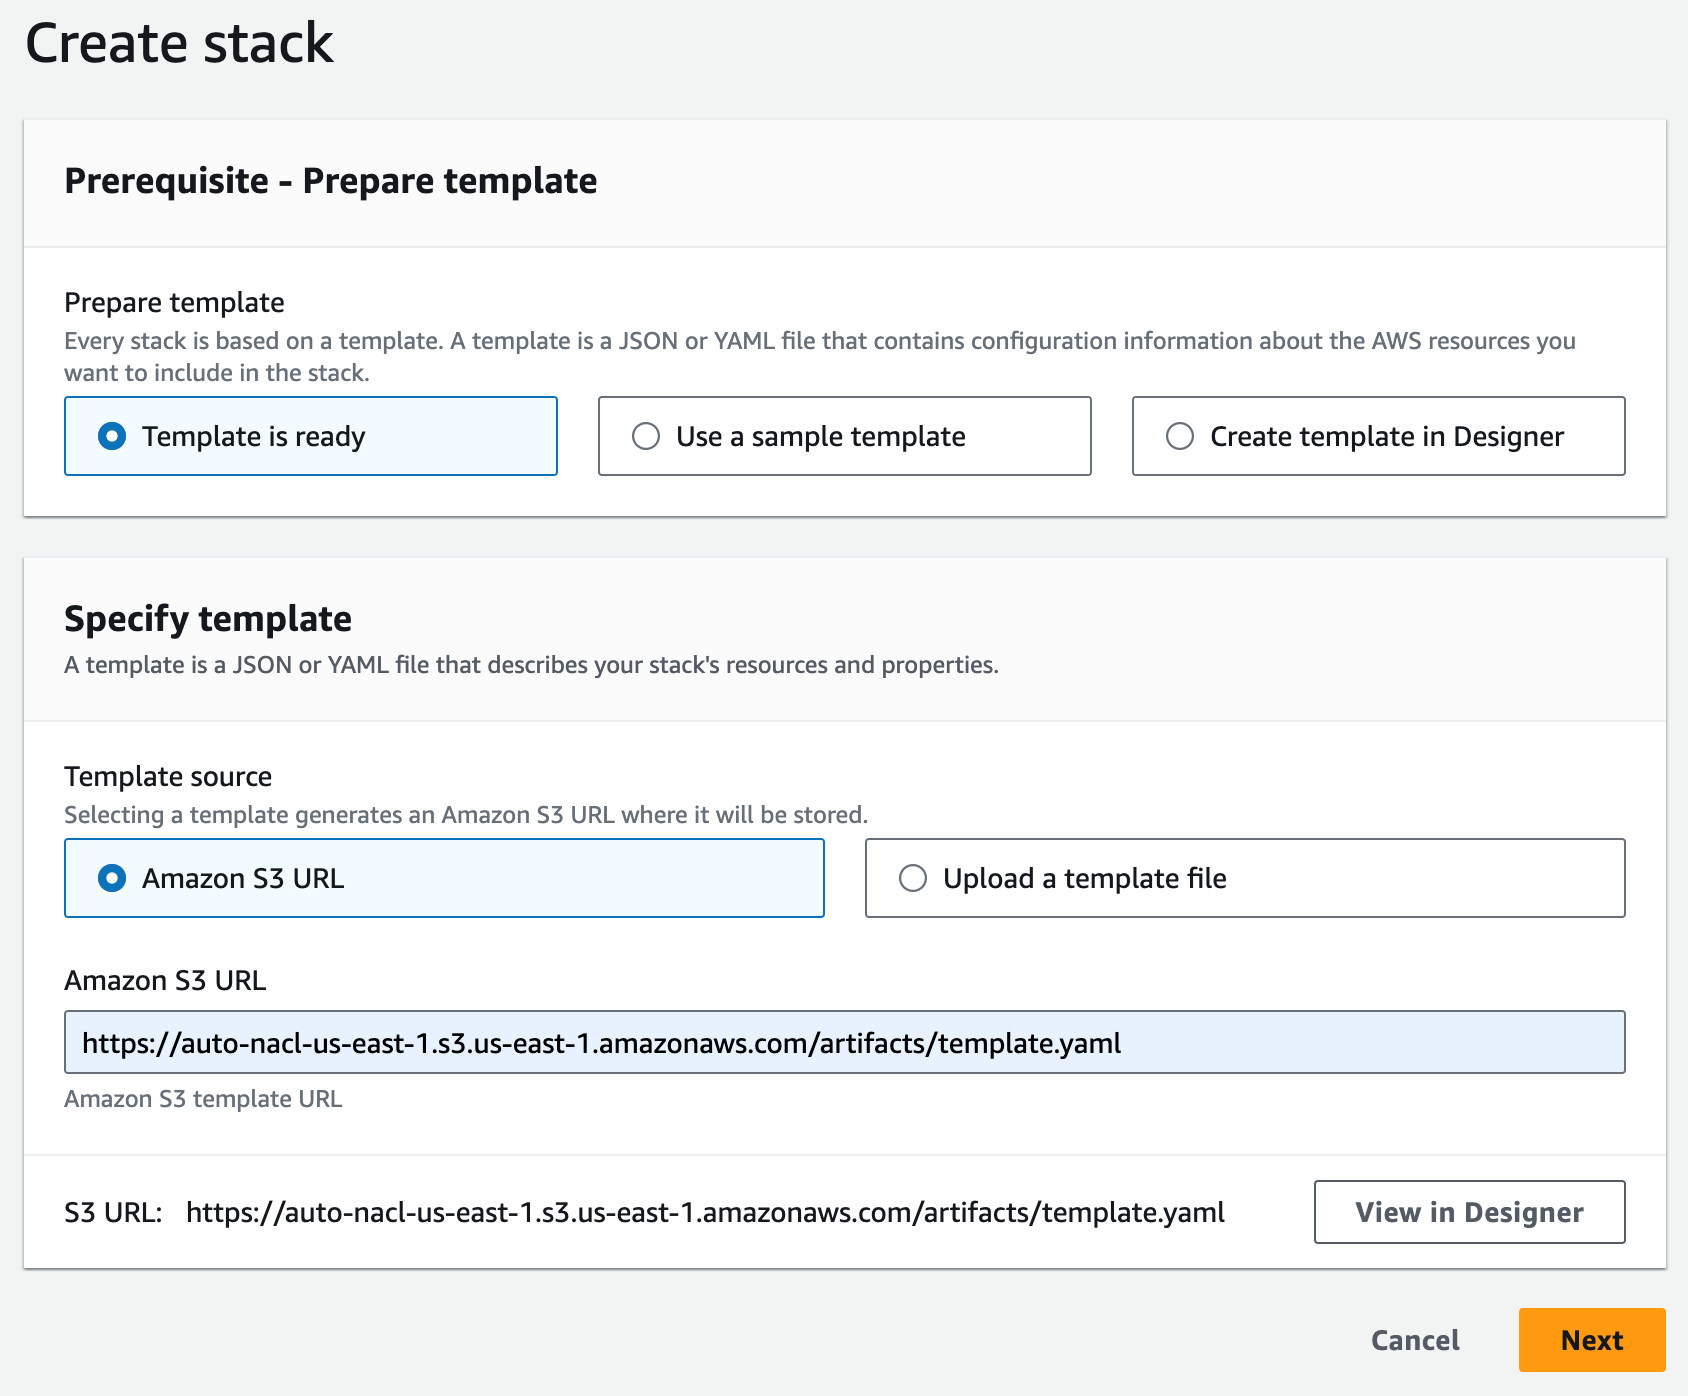
Figure 7: Specify the CloudFormation template
I enter a name for my stack (for example, auto-nacl-1) along with the parameter values I gathered in Step 3. I leave all optional parameters as they are, then choose Next.
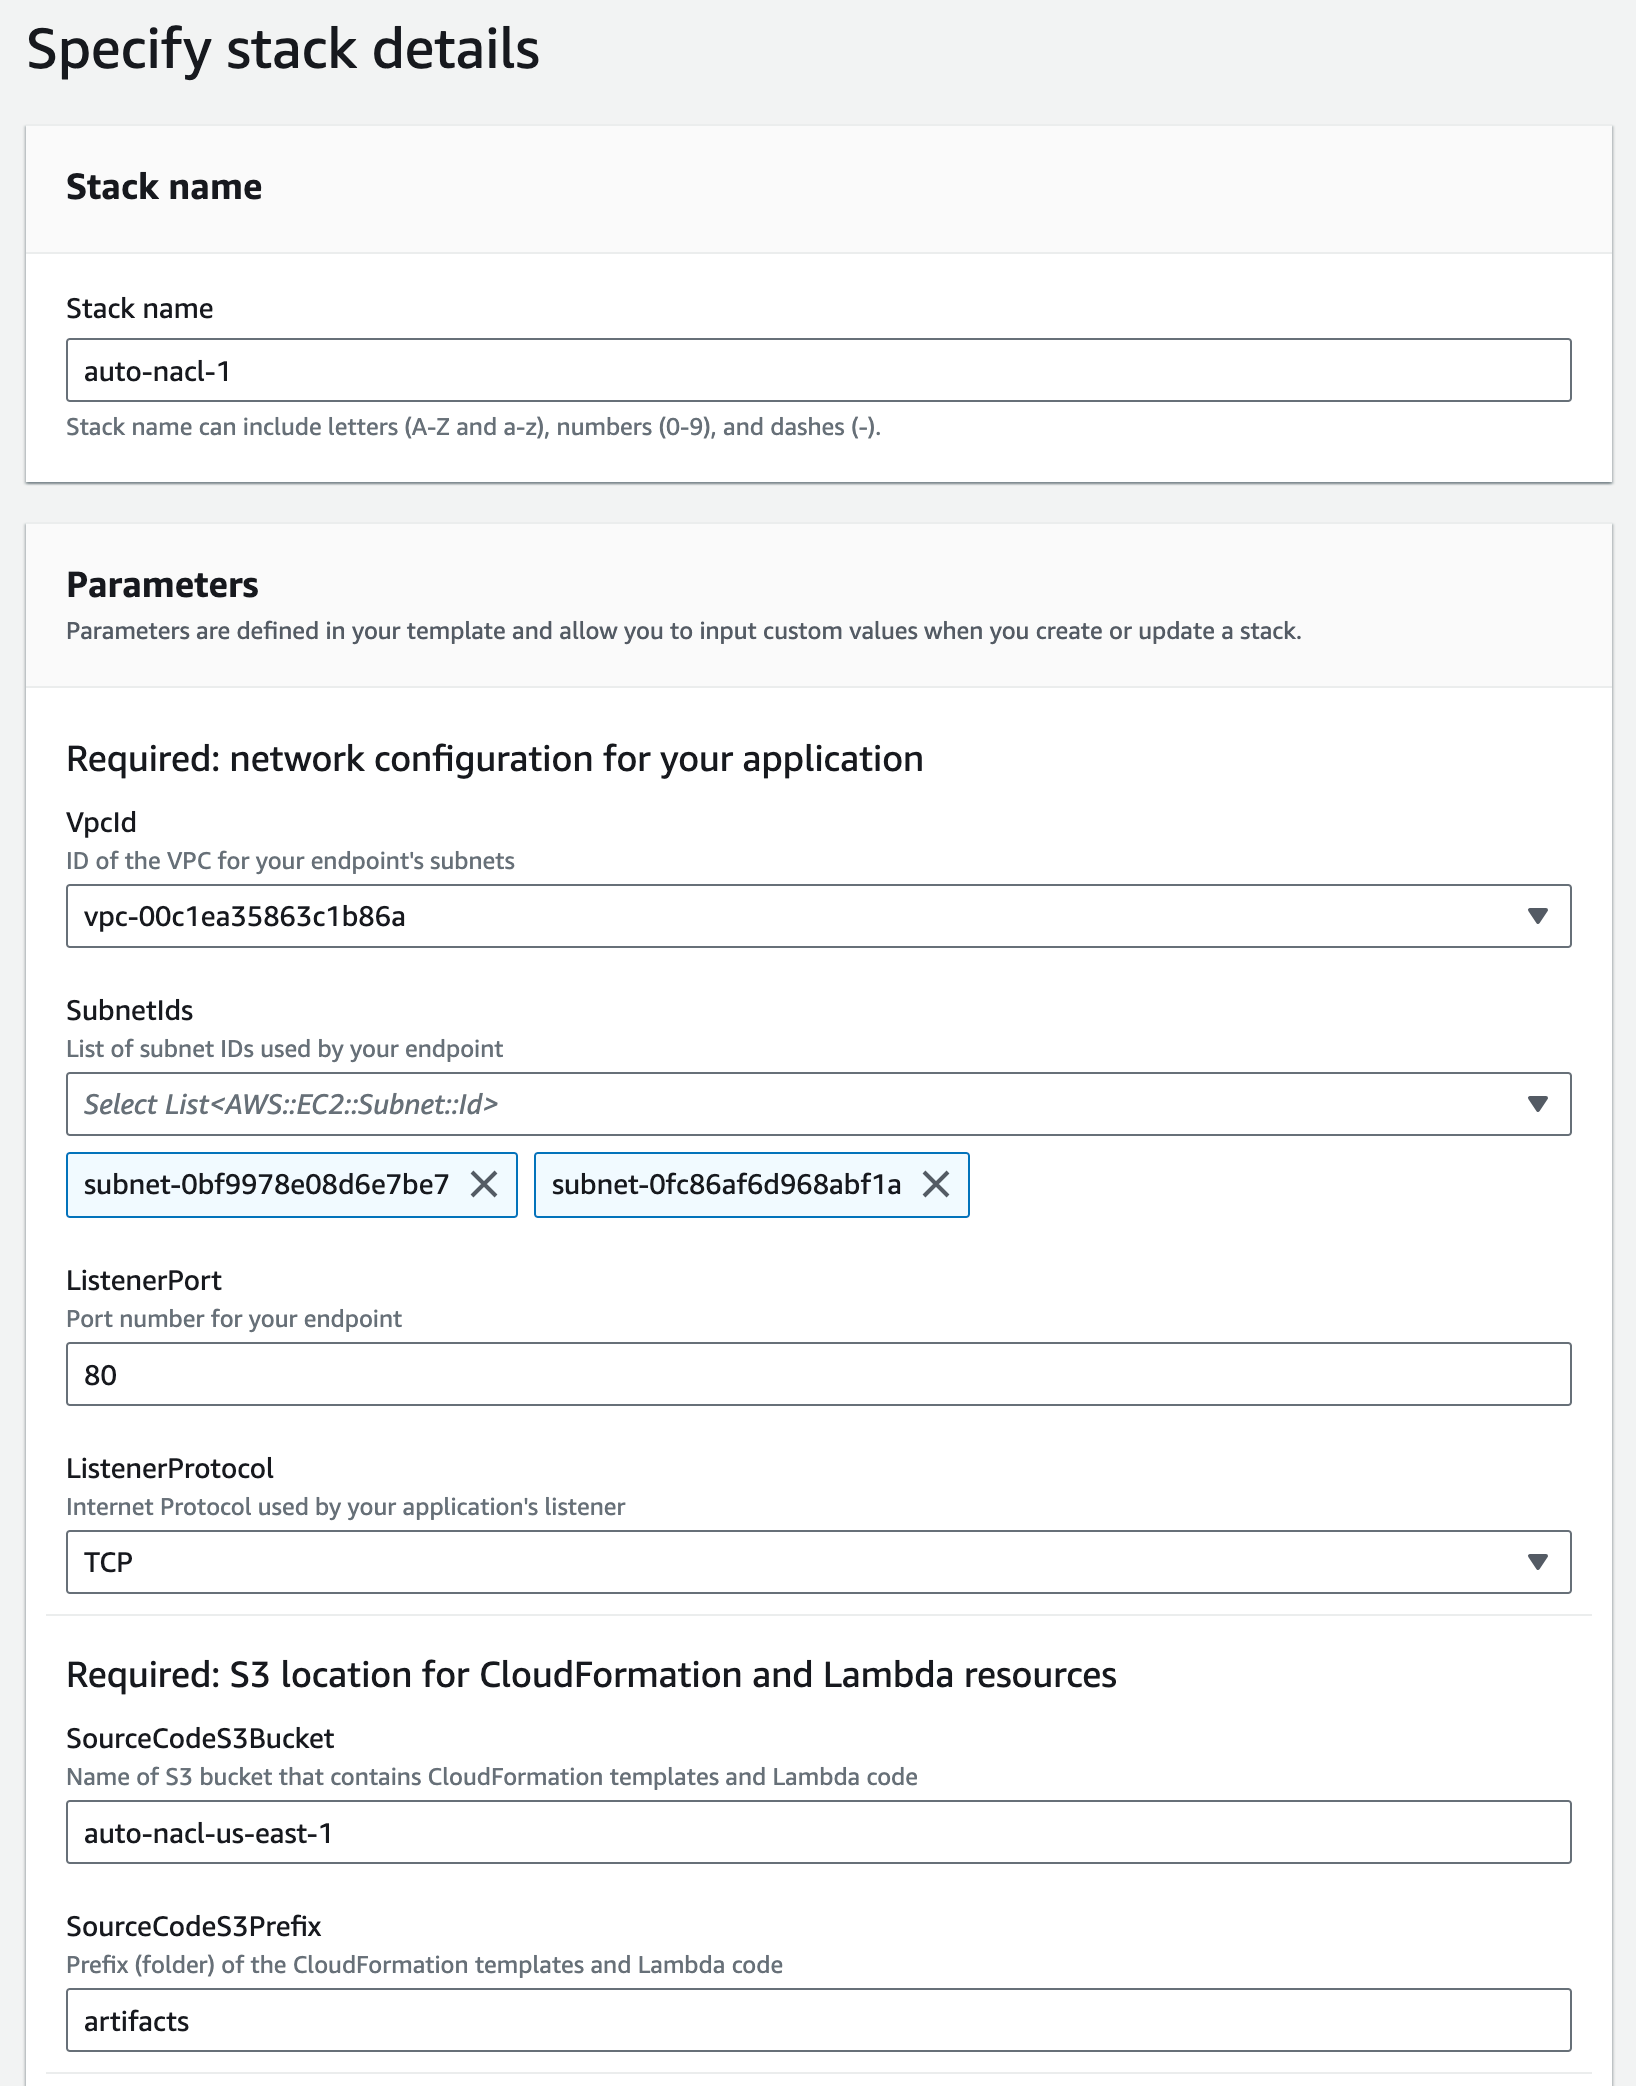
Figure 8: Provide the required parameters
I review the stack options, then scroll to the bottom and choose Next.
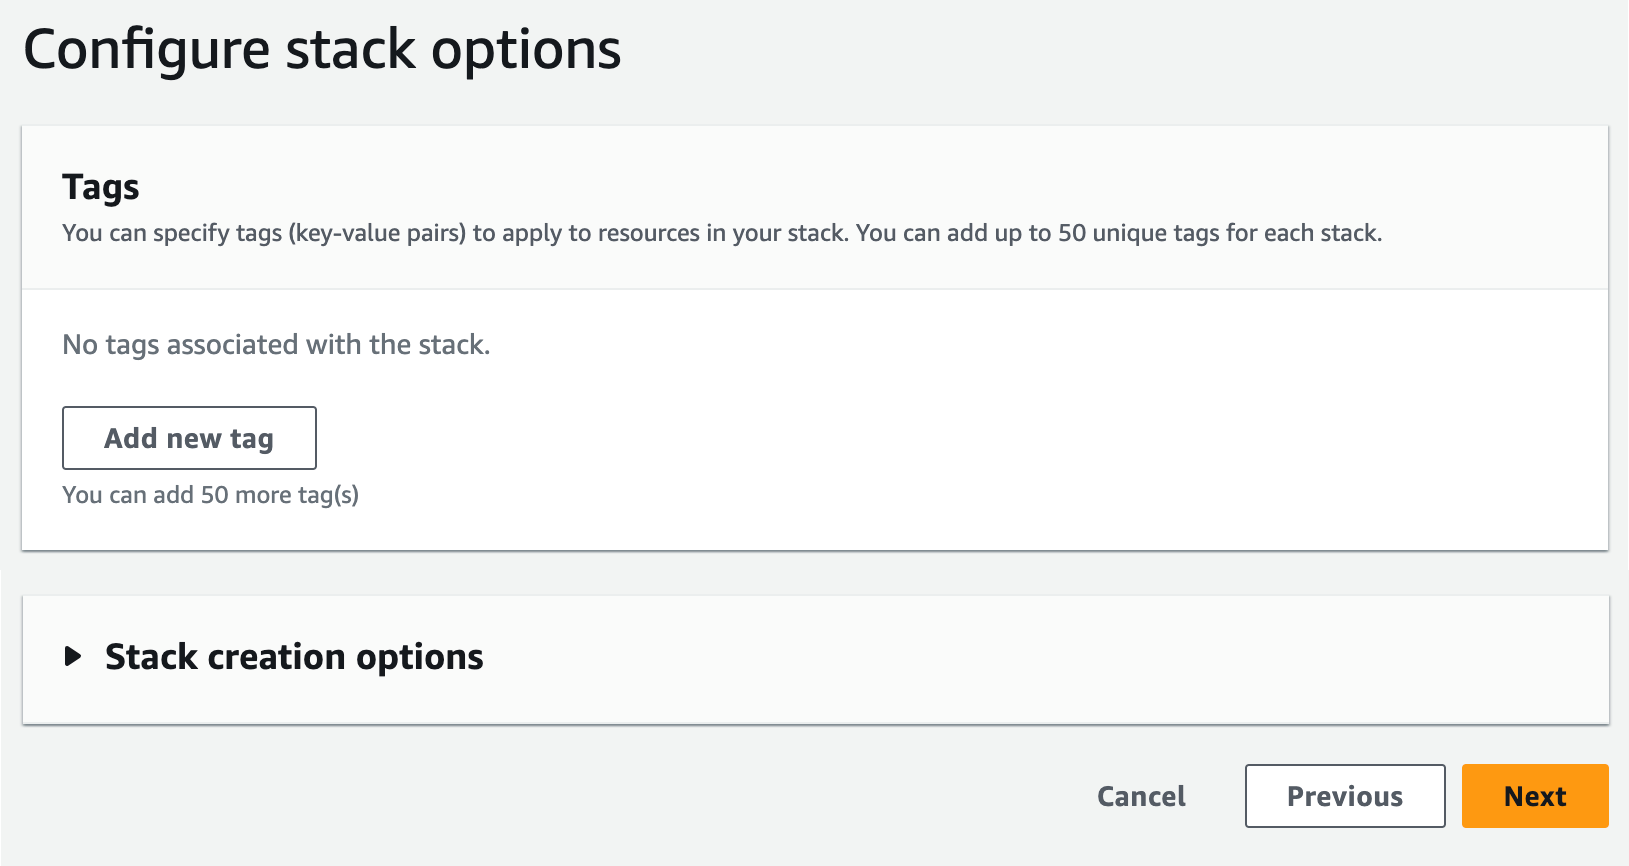
Figure 9: Review the default stack options
I scroll down to the Capabilities section and acknowledge the capabilities required by CloudFormation, then choose Submit.
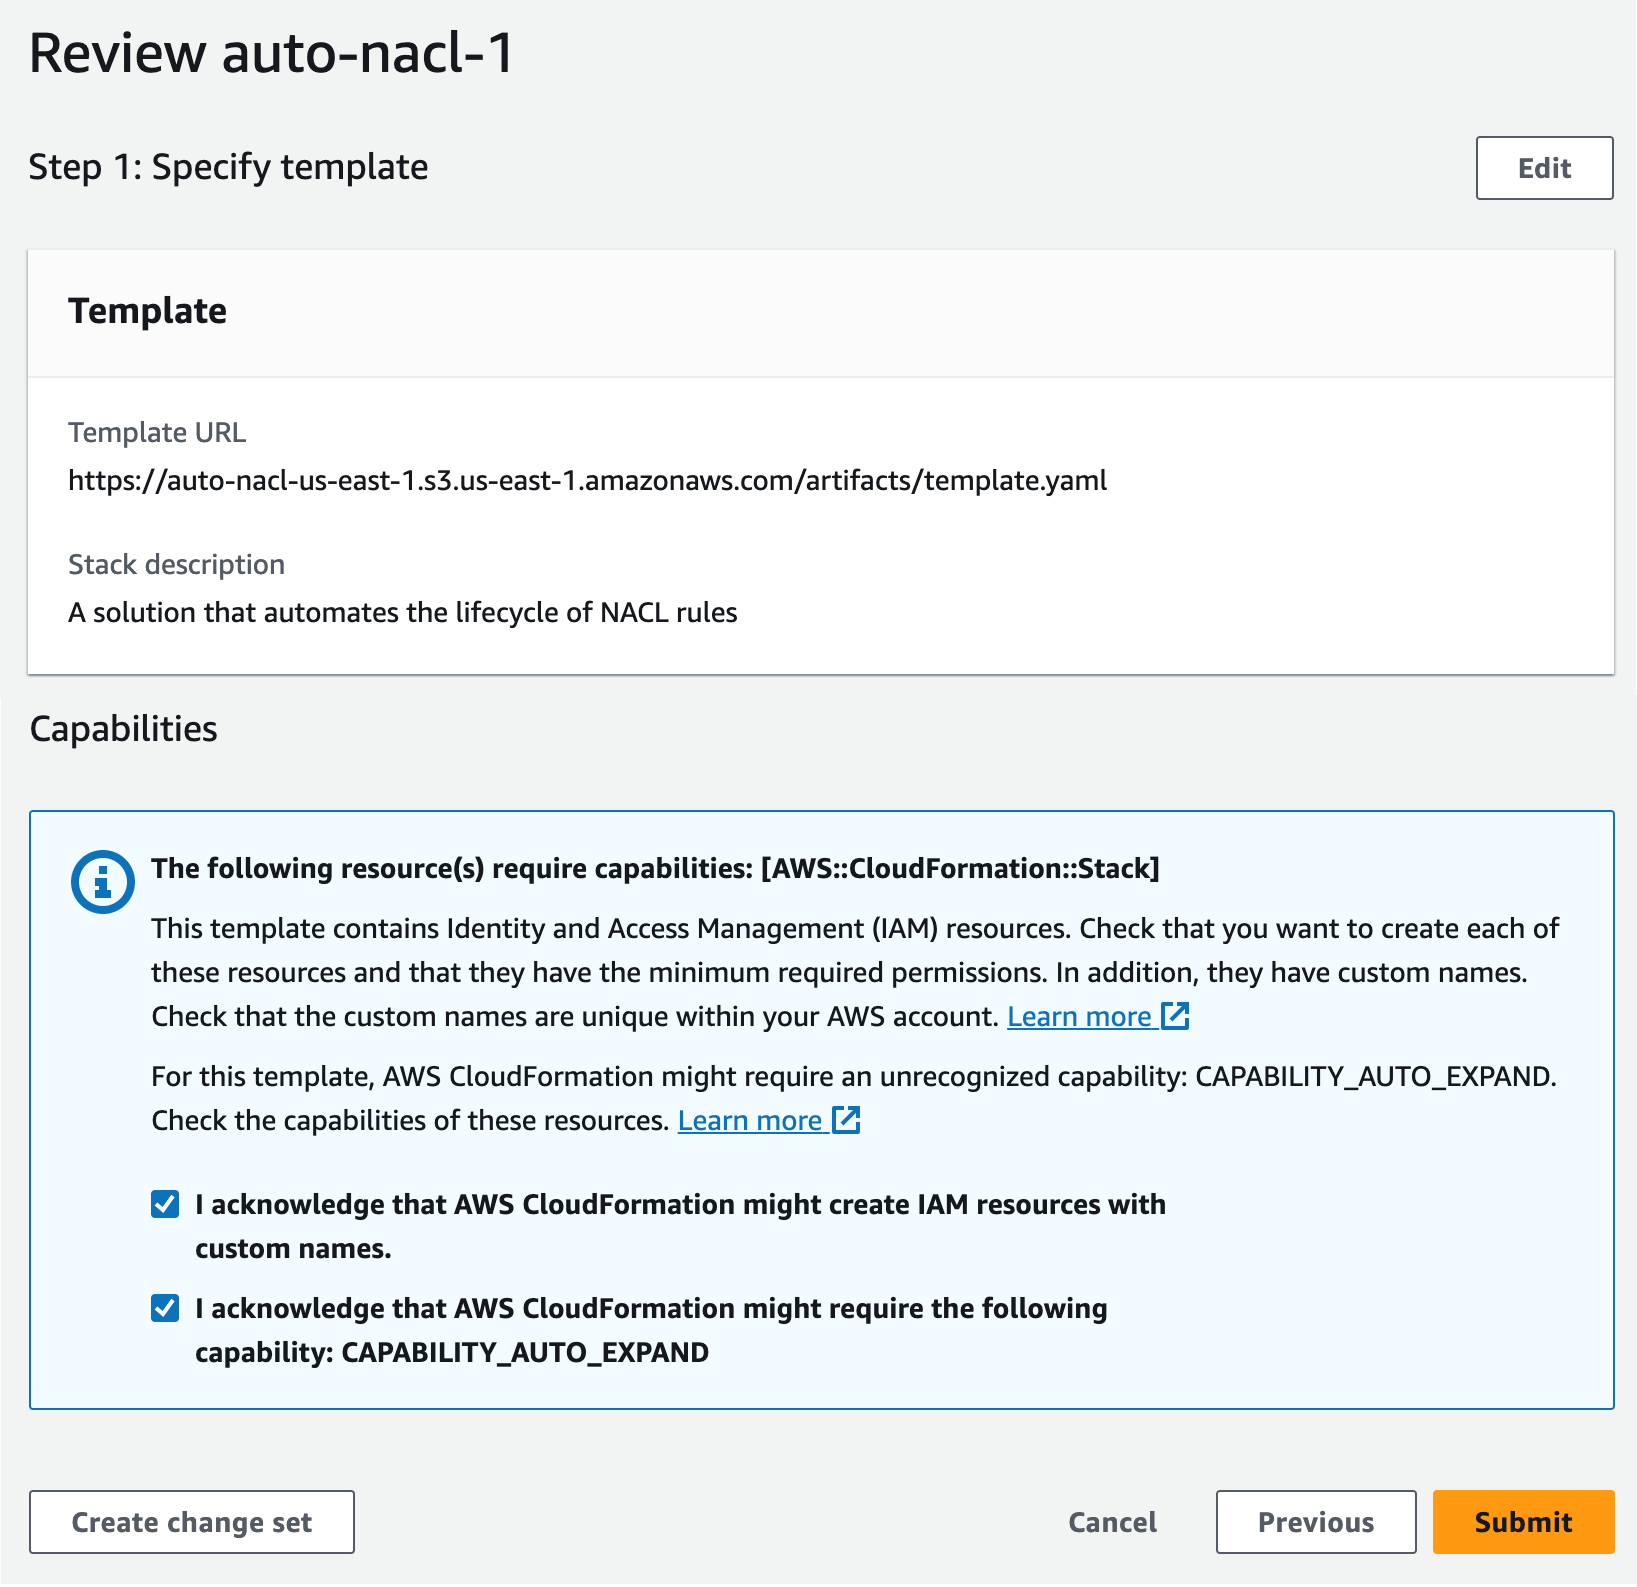
Figure 10: Acknowledge the capabilities required by CloudFormation
I wait for the stack to reach CREATE_COMPLETE status. It takes 10–15 minutes to create all of the nested stacks.
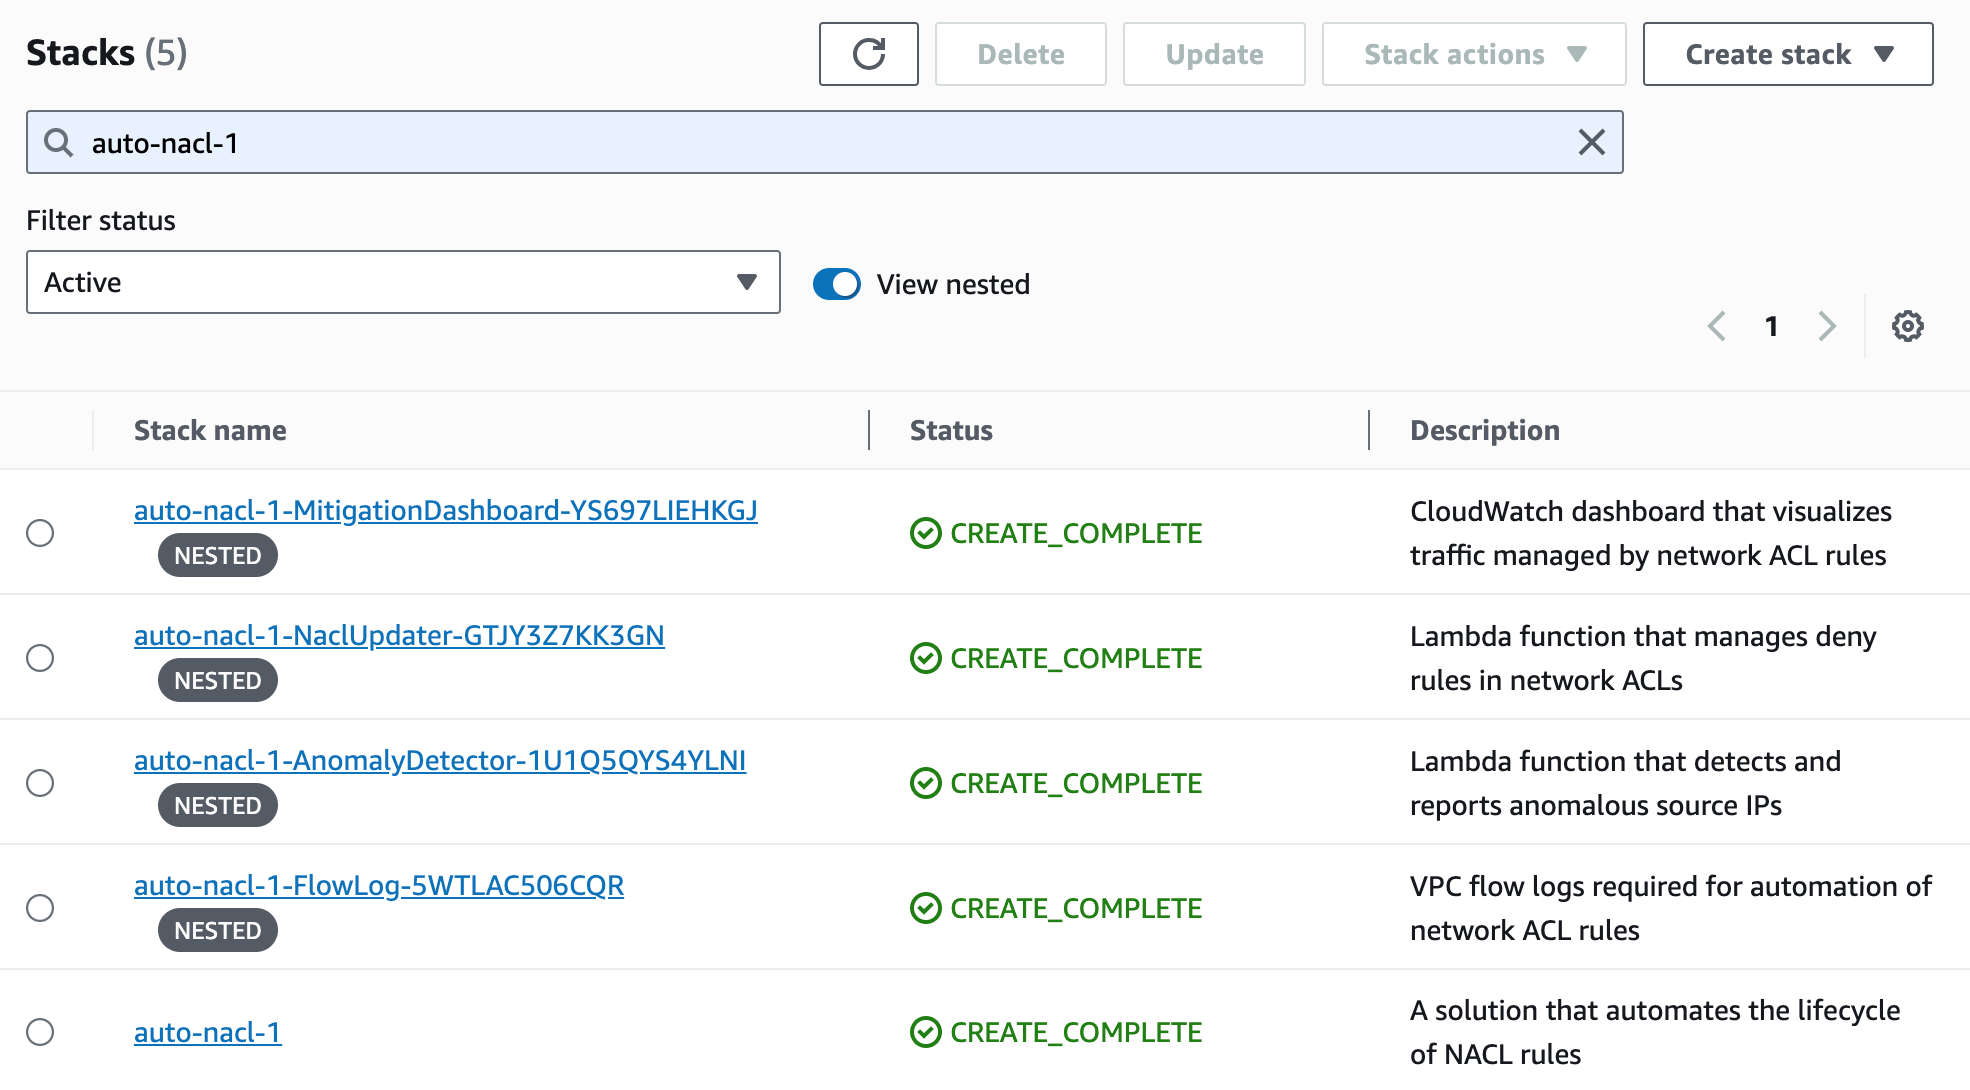
Figure 11: Wait for the stacks to complete
Step 5. Monitor traffic mitigation activity using the CloudWatch dashboard
After the CloudFormation stacks are complete, I navigate to the CloudWatch console to open the dashboard. In my environment, the dashboard is named auto-nacl-1-MitigationDashboard-YS697LIEHKGJ.
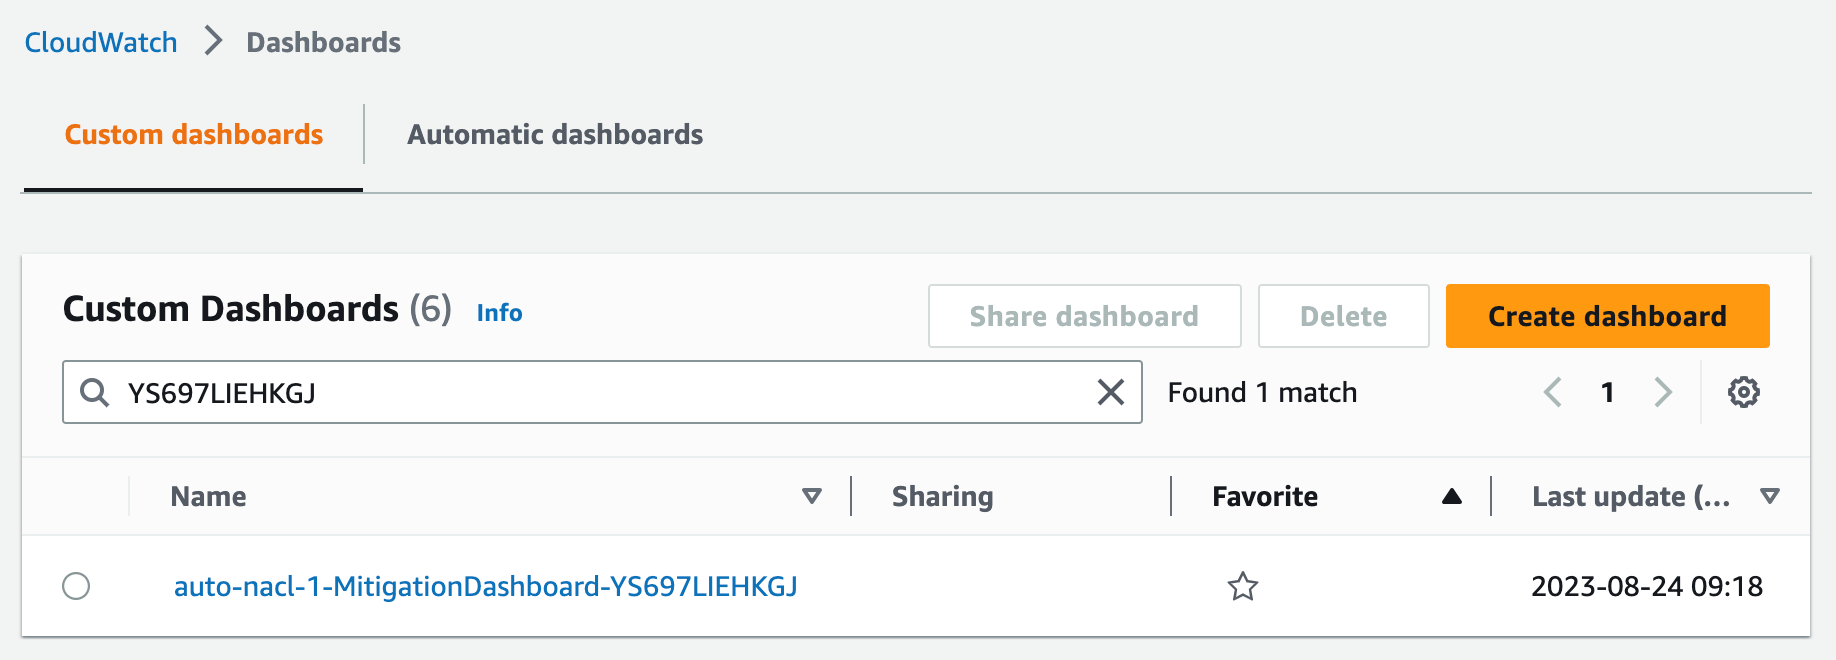
Figure 12: Find the CloudWatch dashboard
Initially, the dashboard, shown in Figure 13, has little information to display. After an hour, I can see the following metrics from my sample environment:
- The Network Traffic graph shows how many packets are allowed and rejected by network ACL rules. No anomalies have been detected yet, so this only shows allowed traffic.
- The All Source IPs graph shows how many total unique source IP addresses are sending traffic.
- The Anomalous Source Networks graph shows how many anomalous source networks are being blocked by network ACL rules (or not blocked due to network ACL rule limit). This graph is blank unless anomalies have been detected in the last hour.
- The Anomalous Source IPs graph shows how many anomalous source IP addresses are being blocked (or not blocked) by network ACL rules. This graph is blank unless anomalies have been detected in the last hour.
- The Packet Statistics graph can help you determine if the sensitivity should be adjusted. This graph shows the average packets-per-minute and the associated standard deviation over the past hour. It also shows the anomaly threshold, which represents the minimum number of packets-per-minute for a source IP address to be considered an anomaly. The anomaly threshold is calculated based on the CloudFormation parameter MinZScore.
anomaly threshold = (MinZScore * standard deviation) + average
Increasing the MinZScore parameter raises the threshold and reduces sensitivity. You can also adjust the CloudFormation parameter MinPacketsPerBin to mitigate against blocking traffic during periods of low volume, even if a source IP address exceeds the minimum Z-score.
- The Blocked IPs grid shows which source IP addresses are being blocked during each hour, along with the corresponding packet bin size and Z-score. This grid is blank unless anomalies have been detected in the last hour.
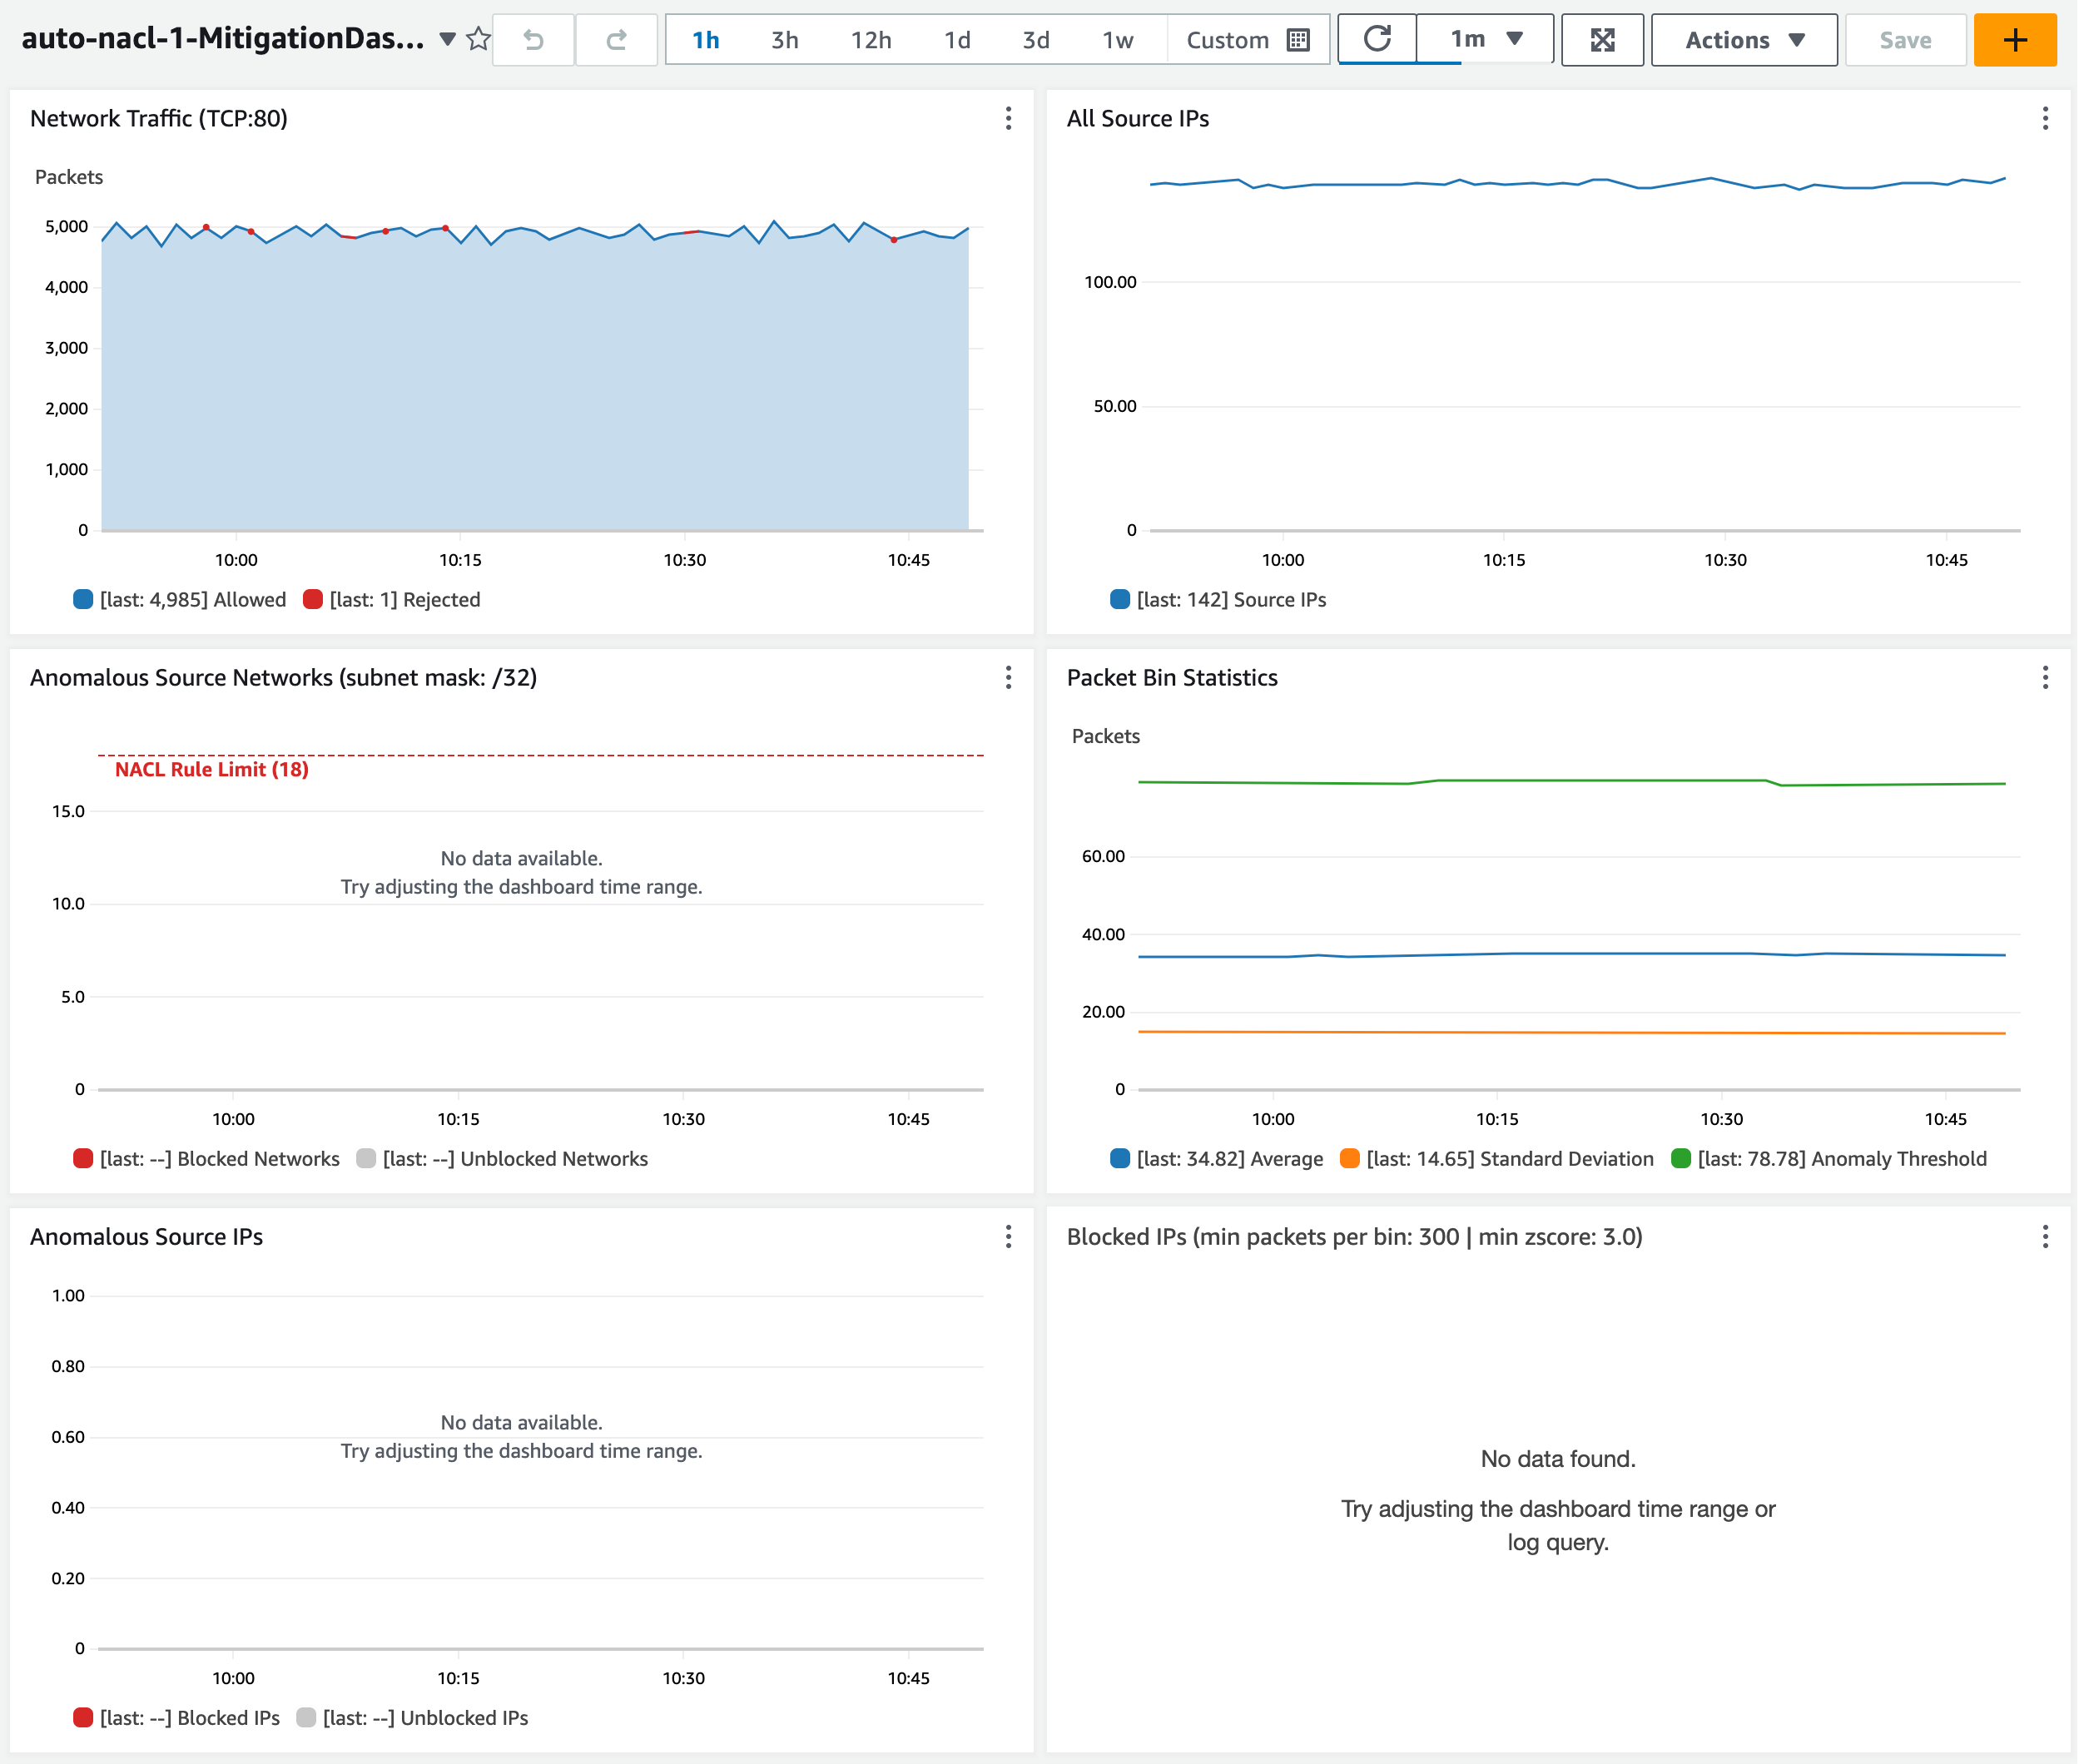
Figure 13: Observe the dashboard after one hour
Let’s review a scenario to see what happens when my endpoint sees two waves of anomalous traffic.
By default, my network ACL allows a maximum of 20 inbound rules. The two default rules count toward this limit, so I only have room for 18 more inbound rules. My application sees a spike of network traffic from 20 unique source IP addresses. When the traffic spike begins, the anomaly is detected in less than five minutes. Network ACL rules are created to block the top 18 source IP addresses (sorted by Z-score). Traffic is blocked for about 5 minutes until the flood subsides. The rules remain in place for 1 hour by default. When the same 20 source IP addresses send another traffic flood a few minutes later, most traffic is immediately blocked. Some traffic is still allowed from two source IP addresses that can’t be blocked due to the limit of 18 rules.
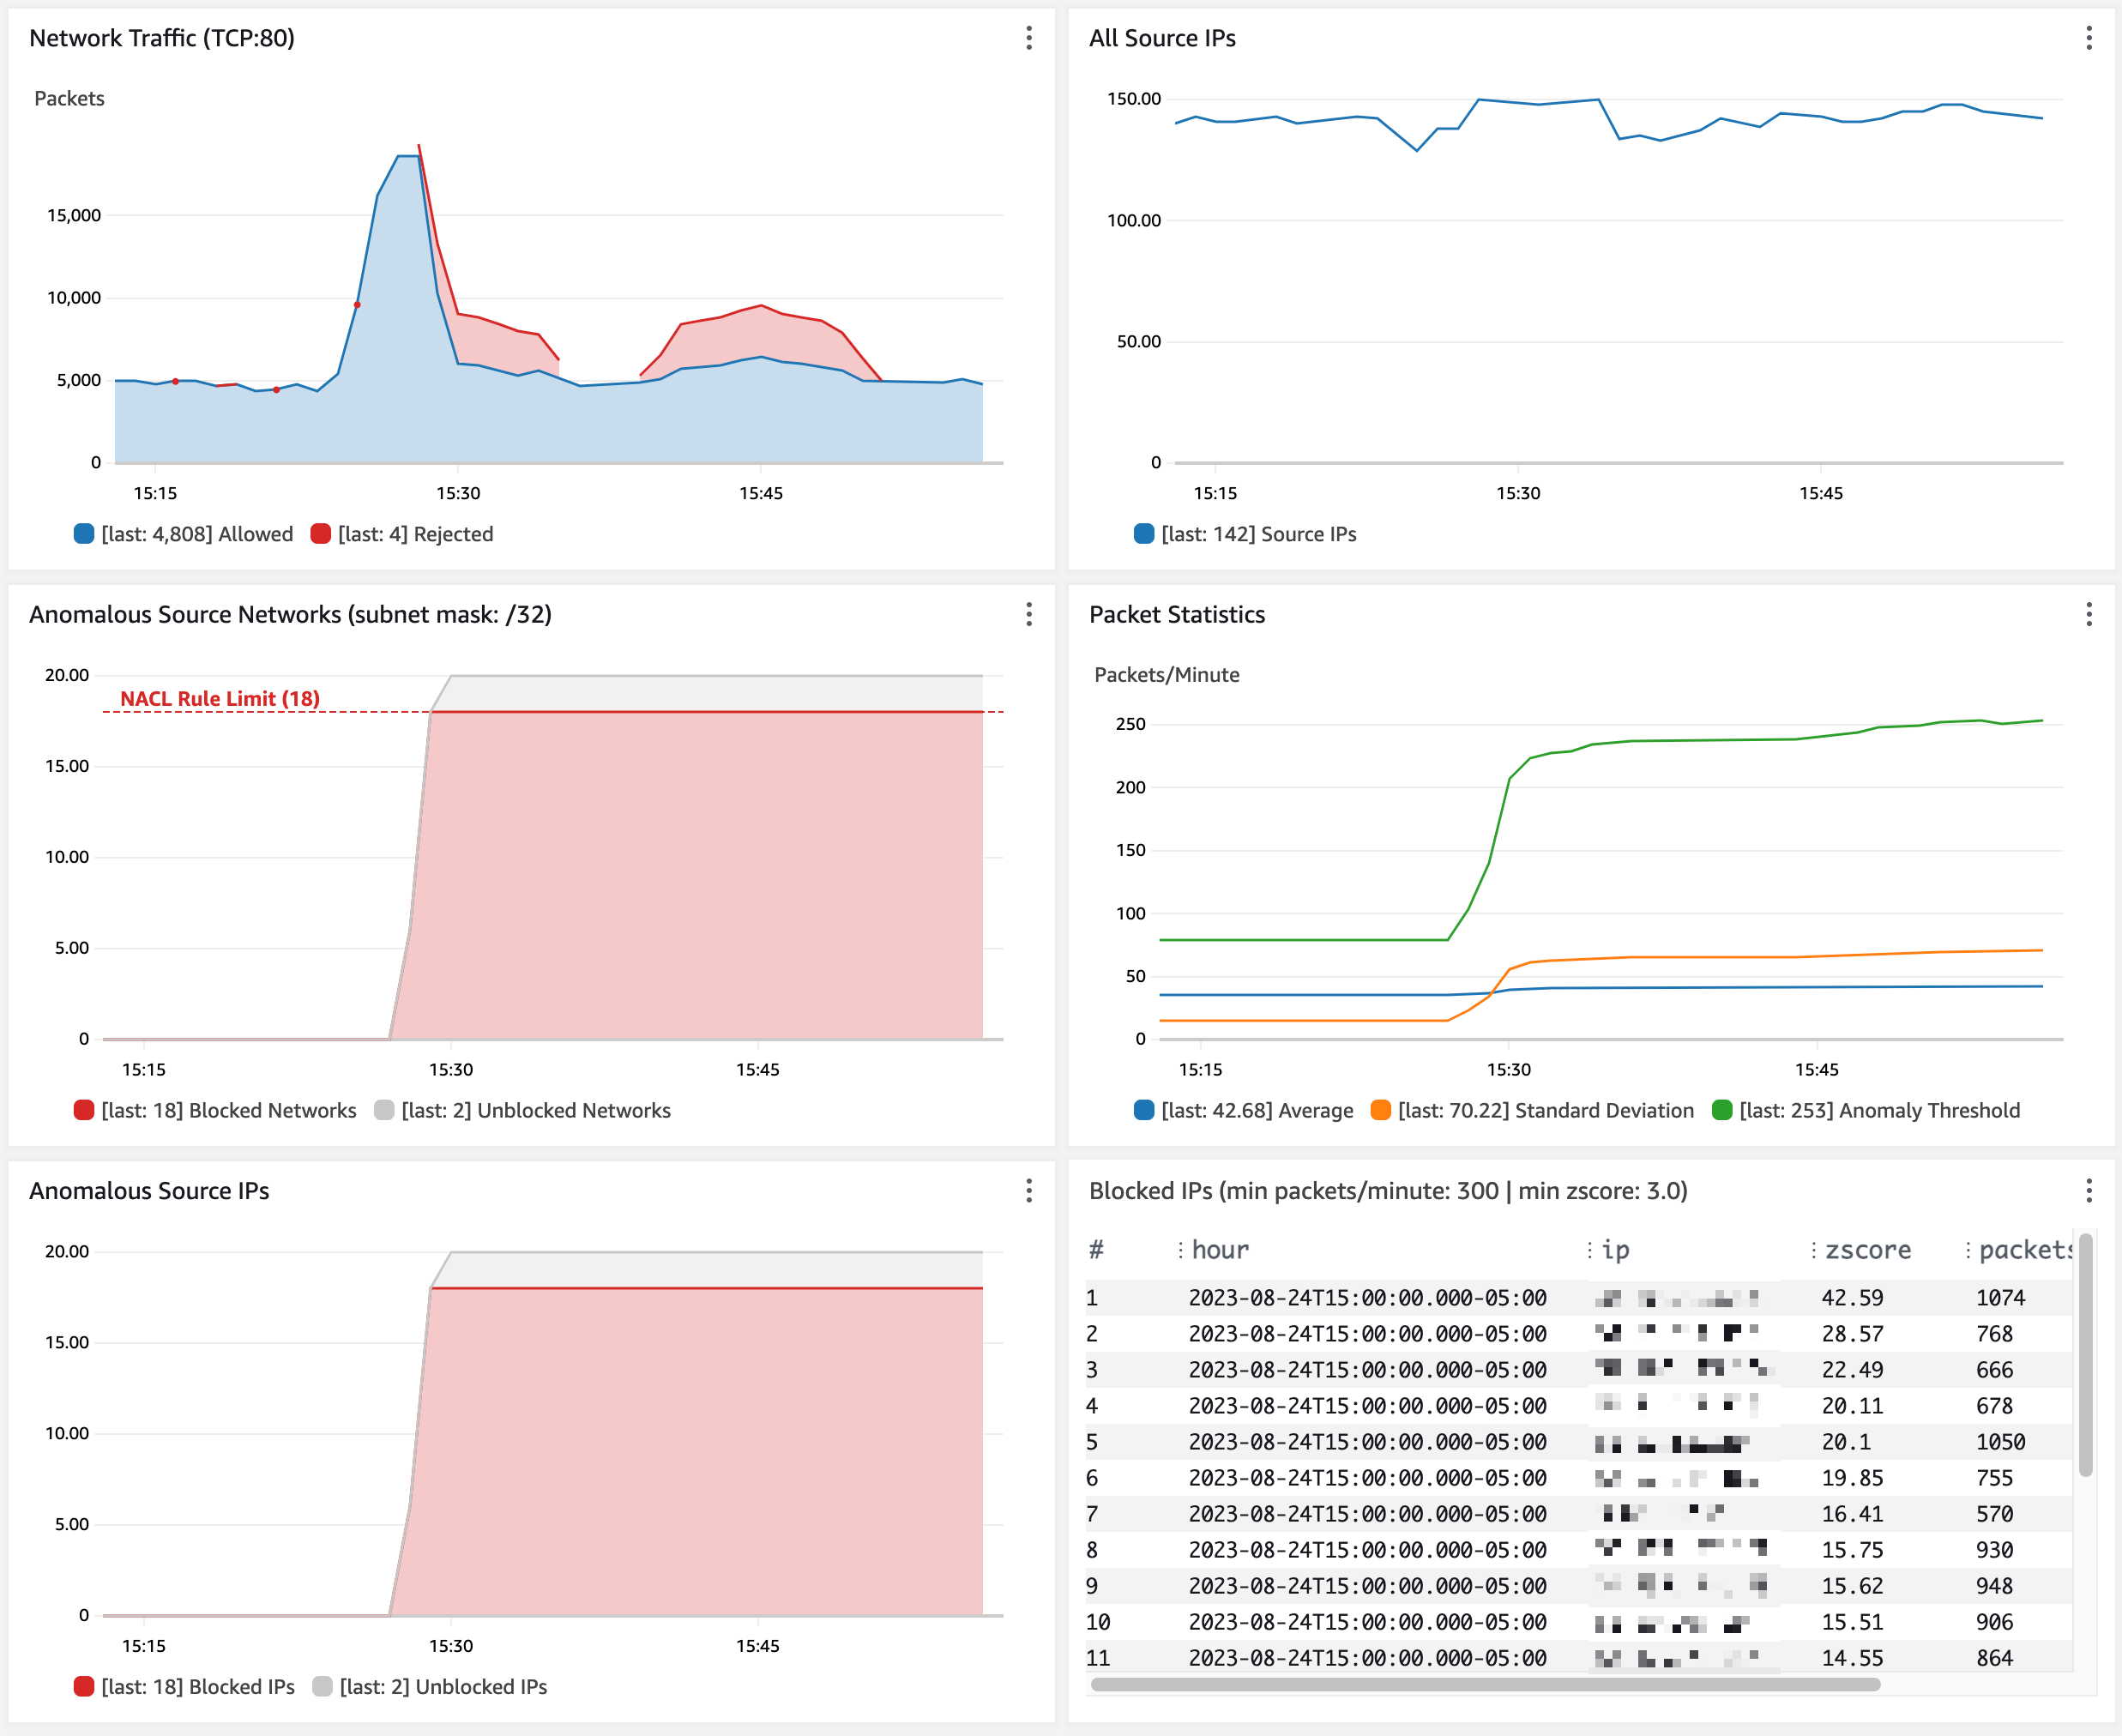
Figure 14: Observe traffic blocked from anomalous source IP addresses
Customize the solution
You can customize the behavior of this solution to fit your use case.
- Block many IP addresses per network ACL rule. To enable blocking more source IP addresses than your network ACL rule limit, change the CloudFormation parameter NaclRuleNetworkMask (default is 32). This sets the network mask used in network ACL rules and lets you block IP address ranges instead of individual IP addresses. By default, the IP address 192.0.2.1 is blocked by a network ACL rule for 192.0.2.1/32. Setting this parameter to 24 results in a network ACL rule that blocks 192.0.2.0/24. As a reminder, address ranges that are too wide might result in blocking legitimate traffic.
- Only block source IPs that exceed a packet volume threshold. Use the CloudFormation parameter MinPacketsPerBin (default is 12,000) to set the minimum packets per minute. This mitigates against blocking source IPs (even if their Z-score is high) during periods of overall low traffic when there is no need to block traffic.
- Adjust the sensitivity of anomaly detection. Use the CloudFormation parameter MinZScore to set the minimum Z-score for a source IP to be considered an anomaly. The default is 3.0, which only blocks source IPs with packet volume that exceeds 99.7 percent of all other source IPs.
- Exclude trusted source IPs from anomaly detection. Specify an allow list object in Amazon S3 that contains a list of IP addresses or CIDRs that you want to exclude from network ACL rules. The network ACL updater function reads the allow list every time it handles an SNS message.
Limitations
As covered in the preceding sections, this solution has a few limitations to be aware of:
- CloudWatch Logs queries can only return up to 10,000 records. This means the traffic baseline can only be calculated based on the observation of 10,000 unique source IP addresses per minute.
- The traffic baseline is based on a rolling 1-hour window. You might need to increase this if a 1-hour window results in a baseline that allows false positives. For example, you might need a longer baseline window if your service normally handles abrupt spikes that occur hourly or daily.
- By default, a network ACL can only hold 20 inbound rules. This includes the default allow and deny rules, so there’s room for 18 deny rules. You can increase this limit from 20 to 40 with a support case; however, it means that a maximum of 18 (or 38) source IP addresses can be blocked at one time.
- The speed of anomaly detection is dependent on how quickly VPC flow logs are delivered to CloudWatch. This usually takes 2–4 minutes but can take over 6 minutes.
Cost considerations
CloudWatch Logs Insights queries are the main element of cost for this solution. See CloudWatch pricing for more information. The cost is about 7.70 USD per GB of flow logs generated per month.
To optimize the cost of CloudWatch queries, the VPC flow log record format only includes the fields required for anomaly detection. The CloudWatch log group is configured with a retention of 1 day. You can tune your cost by adjusting the anomaly detector function to run less frequently (the default is twice per minute). The tradeoff is that the network ACL rules won’t be updated as frequently. This can lead to the solution taking longer to mitigate a traffic flood.
Conclusion
Maintaining high availability and responsiveness is important to keeping the trust of your customers. The solution described above can help you automatically mitigate a variety of network floods that can impact the availability of your application even if you’ve followed all the applicable best practices for DDoS resiliency. There are limitations to this solution, but it can quickly detect and mitigate disruptive sources of traffic in a cost-effective manner. Your feedback is important. You can share comments below and report issues on GitHub.
If you have feedback about this post, submit comments in the Comments section below.
Want more AWS Security news? Follow us on Twitter.