AWS Database Blog
Audit Amazon Aurora Database Logs for Connections, Query Patterns, and More, using Amazon Athena and Amazon QuickSight
Amazon Aurora offers a high-performance advanced auditing feature that logs detailed database activity to the database audit logs in Amazon CloudWatch. If you are using Aurora 1.10.1 or greater, you can use advanced auditing to meet regulatory or compliance requirements by capturing eligible events like tables queried, queries issued, and connections and disconnections. You can also use advanced auditing in tandem with Amazon Athena and Amazon QuickSight for easy, low-cost reporting on the logs when you write the logs to Amazon S3.
The previous blog post Monitoring Amazon Aurora Audit Events with Amazon CloudWatch showed you how to send Aurora audit logs to CloudWatch for continuously monitoring activity in your DB clusters. This post shows how to do these things:
- Export your Aurora audit logs from CloudWatch to S3.
- Use Amazon Athena for historical analysis of events in your DB clusters.
- Build rich visualization with Amazon QuickSight.

Prerequisites
As prerequisites, we recommend the following:
- Amazon Aurora Cluster running in your AWS account configured with Aurora auditing and sending data to CloudWatch. For more information, see the AWS Database blog post Monitoring Amazon Aurora Audit Events With Amazon CloudWatch, or the Aurora documentation.
- Familiarity with Amazon Athena. For more information, see the Athena documentation.
- Familiarity with Amazon QuickSight. For more information, see Amazon QuickSight documentation.
Getting started
On your Amazon Aurora cluster, you enable the collection of audit logs by setting several DB cluster parameters. When advanced auditing is enabled, you can use it to log any combination of the events in the table following. For more information, see the blog post Monitoring Amazon Aurora Audit Events with Amazon CloudWatch. Choose one or more of the events following for advanced auditing.
| Event | Definition |
| CONNECT | Logs both successful and failed connections and also disconnections. This event includes user information. |
| QUERY | Logs all queries in plain text, including queries that fail due to syntax or permission errors. |
| QUERY_DCL | Similar to the QUERY event, but returns only data control language (DCL) queries (GRANT, REVOKE, and so on). |
| QUERY_DDL | Similar to the QUERY event, but returns only data definition language (DDL) queries (CREATE, ALTER, and so on). |
| QUERY_DML | Similar to the QUERY event, but returns only data manipulation language (DML) queries (INSERT, UPDATE, and so on). |
| TABLE | Logs the tables that were affected by query execution. |
Viewing logs
Recent logs are still available in the AWS RDS Management Console, but now you can capture and keep logs for extended periods of time. This functionality means that even when you are writing thousands of transactions per second, the data is preserved in CloudWatch for as long as you choose to keep it. For information about how to change your log retention setting, see Change Log Data Retention in CloudWatch Logs in the CloudWatch documentation.
Console
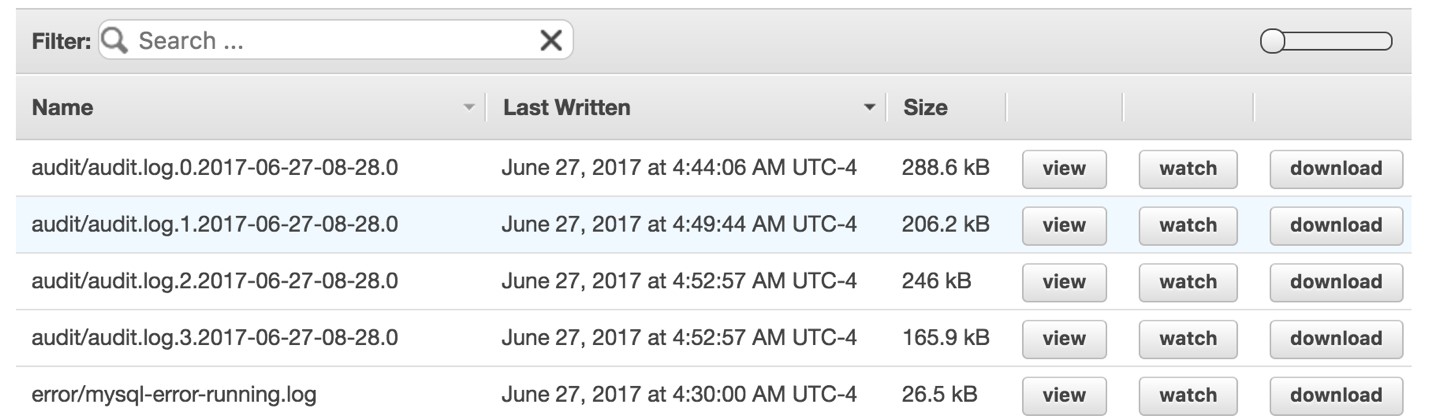
To view the log data in the console, choose one of your Aurora cluster instances and then choose Logs to open the list of log files for the instance. From the list, look for the audit logs and choose either view, watch, or download. View shows you the entire log on your screen. Watch displays a tail of the log showing the most recent events. Download opens a link from which you can save logs as a file on your computer to view in an editor.
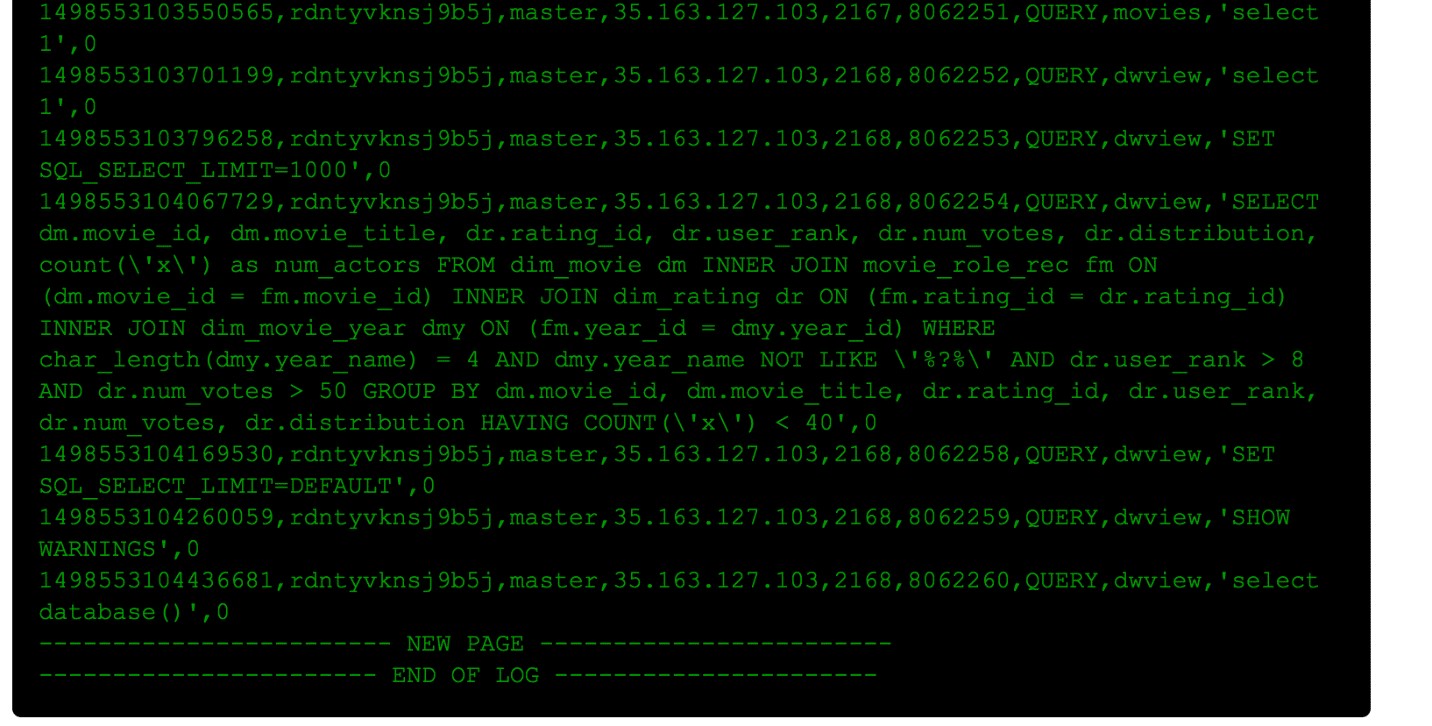
When you view an audit log, you can see the identity of the user running the query and the timestamp of the query execution. Depending on the setting you chose for the audit, a log might also include the detailed SQL code for the operation among other columns. For detailed information about each of the columns output to the audit logs, see the Aurora auditing documentation.
CloudWatch
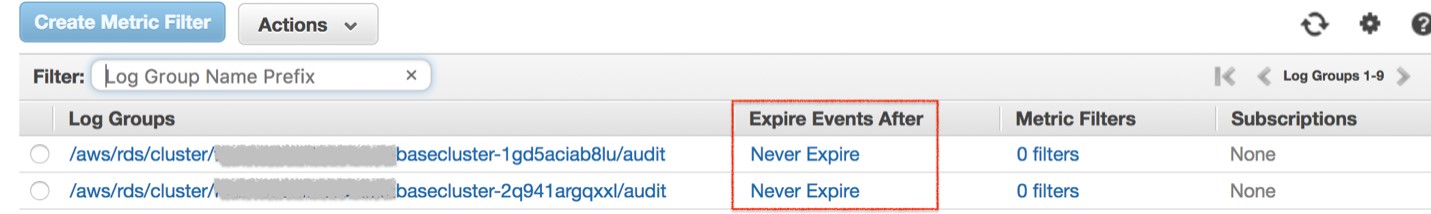
Audit logs in Aurora are rotated when they reach 100 MB. With your audit logs in CloudWatch, you gain control over how long you retain your logs in CloudWatch Logs. By default, your logs are stored indefinitely in CloudWatch. You can specify how long you want CloudWatch to retain your logs. To do so, open the CloudWatch console, choose Logs, locate your log group, and then choose Expire Event After. From here, you can select a retention period that’s suitable for you.
When your logs are available in CloudWatch Logs, you can search across your logs or a subset of logs by specific terms, phrases, or values. To do so, on the CloudWatch console choose Logs, and then locate and select your log group. Choose Search Log Group to search across all your logs. You can also select specific log streams using the check boxes.

Log files are in UTF-8 encoding. Logs are written in multiple files, the number of which varies based on instance size. To see the latest events, you can sort by the time value when you are searching through the logs.
Storing logs in S3
Amazon CloudWatch Logs is a great feature for continuous monitoring, storing, and accessing your log files. You can use the CloudWatch Logs console to view the audit logs periodically and do searching and filtering. To look at patterns in your logs, and perform deeper historical analysis with Athena, you can extract the data from the CloudWatch logs message field. You can do so using either the API or the AWS CLI and store the result in S3. Find detailed information about how to download the logs, and what options to use, in the log access section of the CloudWatch documentation.
You can use the CLI to download the log files, extract the message portion of the logs, and then push the result to S3. Once the message payload is in S3, you can query it with Athena.
Note: The previous example code uploads the log message extracts to an S3 bucket with a key that corresponds to the log group name.
Querying logs directly in S3 with Athena
To look at all the logs in aggregate in your S3 bucket, you can use Amazon Athena. If you are new to Amazon Athena, you can find a good introductory post on the AWS Blog in Amazon Athena—Interactive SQL Queries for Data in Amazon S3.
Set up a table in Athena
To set up an Athena query for this dataset, start by opening Amazon Athena from the console. On the Query Editor screen, you can enter the following Hive DDL syntax into the query window to create your table.
Query data with Athena
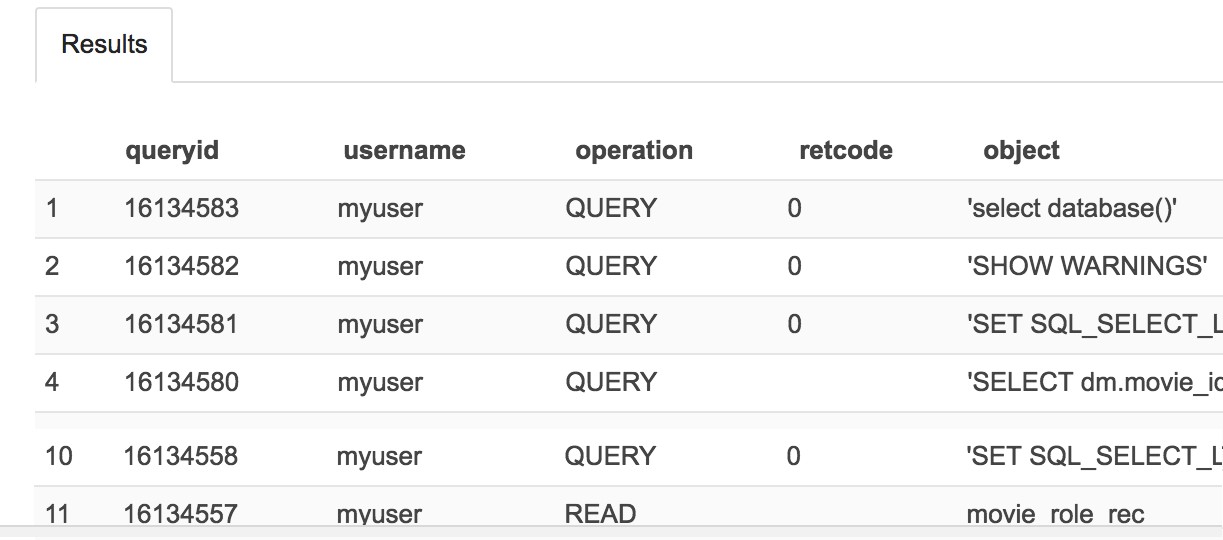
Your log entries are not in sequential order and might be duplicated between extraction runs if you extract logs frequently over time. To put the logs in time order, you can use the timestamp value. To get a list of users and operations that have run against the cluster, issue a distinct query against the data.
The results of this previous query show which of your users have accessed the cluster most recently, what objects they read, and what queries they issued.
Visualizing log data with Amazon QuickSight
Now that you have the raw data from the logs in S3 and Amazon Athena, you can visualize your audit records through Amazon QuickSight in just a few clicks. If you are new to Amazon QuickSight, you can find a good introductory post on the AWS News Blog in Amazon QuickSight – Fast & Easy to Use Business Intelligence for Big Data at 1/10th the Cost of Traditional Solutions.
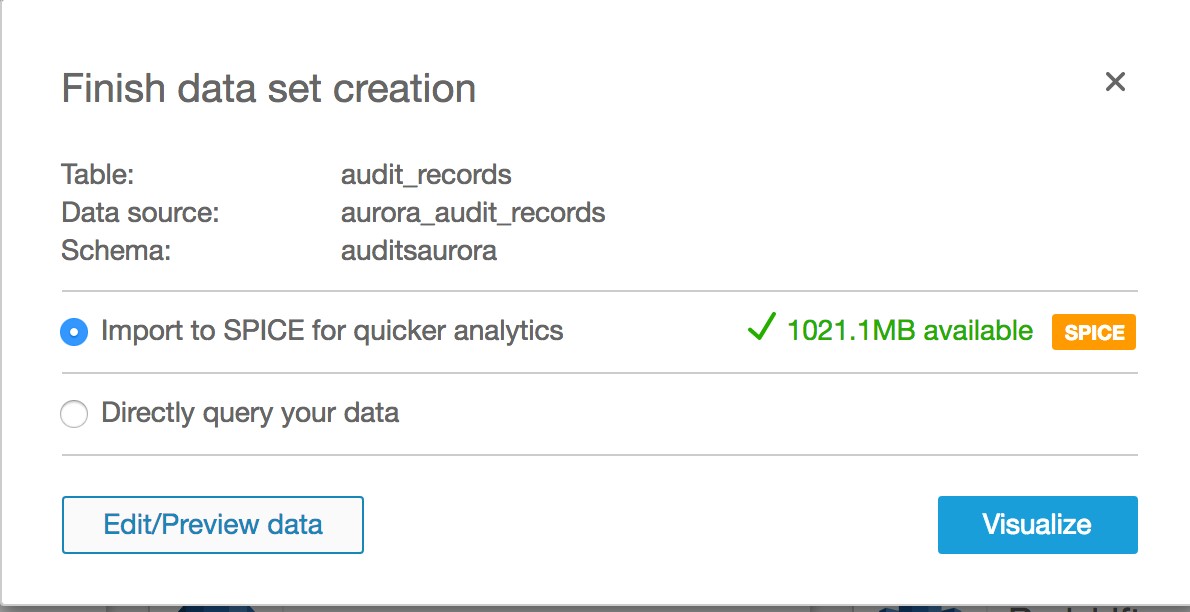
To visualize your data, open the Amazon QuickSight dashboard and choose New analysis and then New data set. You can choose Athena as your data source, enter a name for this data source, and then choose Create data source. Choose the database and the table you created in Athena, and then choose Select. Choose either SPICE or Direct query and then Edit/Preview data to enter a query rather than just a raw select from the table.
On the preview pane, choose Switch to custom SQL tool, and then enter the query to retrieve the distinct list of records from the data source. Give your query a name, and then choose Save & visualize from the top bar.

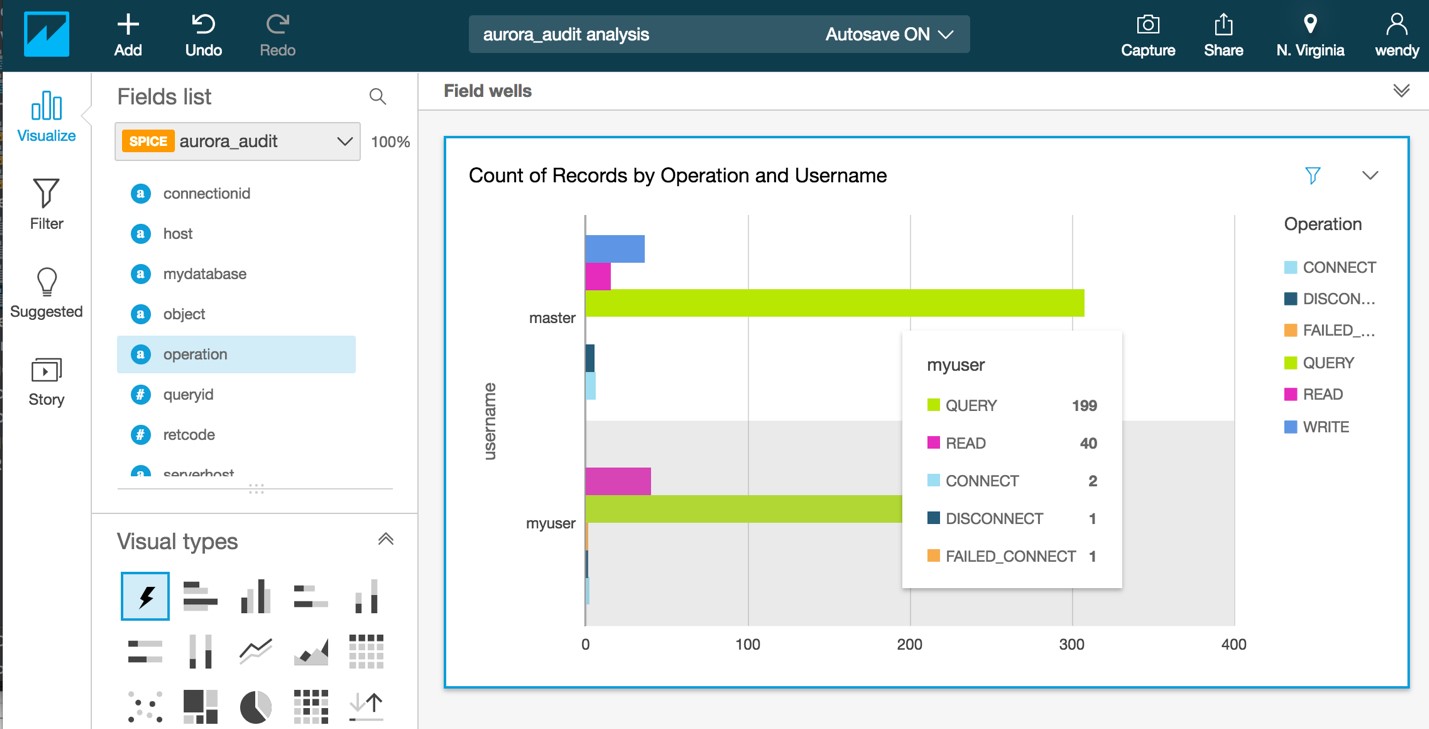
To look at the count of records by operation and users, you add username and then add operation to the visualization. You can then use filtering to reduce the focus down to the users and events that you are interested in for analysis. The following resulting graph example shows that the user has issued 199 queries against the cluster since auditing was started.
Summary
Amazon Aurora’s advanced auditing feature is a powerful solution that you can combine with other AWS services to gain visibility into user activity on your database. By writing advanced auditing logs from your Amazon Aurora cluster to CloudWatch, you can store them as long as you require them. When the data is in S3, it can be automatically tiered into lower-cost, longer-term storage using lifecycle policies. With Amazon Athena and Amazon QuickSight, you have lightweight, limited-cost query and reporting tools for data like logs that you access infrequently.
About the Author
 Wendy Neu has worked as a Data Architect with Amazon since January 2015. Prior to joining Amazon, she worked as a consultant in Cincinnati, OH helping customers integrate and manage their data from different unrelated data sources.