AWS Partner Network (APN) Blog
New Analytics and Insights Dashboard Features in AWS Partner Central
“AWS Transforms the Partner Experience” is a blog series on updates to AWS Marketplace, AWS Partner Central, and programs.
By Luca Certini, Sr. Manager, Product Management – AWS
By Krystle DuBeau, APO Discovery and Analytics Manager – AWS
As we continue to transform the partner experience, we’re introducing updates to the Analytics and Insights Dashboard (previously AWS Partner Analytics Dashboard) to give you more visibility and deeper insights into your data.
The latest updates include new Marketing Campaigns and Training and Certifications tabs, expanded funding insights, and enhancements to the Opportunities and Leads tabs.
In 2023, we unified AWS Marketplace insights and AWS Partner Network (APN) data in a single location to give partners—including eligible AWS Marketplace Sellers—a consolidated view across their Amazon Web Services (AWS) business.
In this post, we’ll explore the latest updates, benefits, and high-level features of the dashboard that partners can use to gain insights into their AWS business.
New features and tabs
Investments tab updates
Now you can gain insight into revenue generated through the AWS Migration Acceleration Program (MAP)—allowing you to easily view and verify status of your funding investment and claim readiness.
Previously, partners received MAP benefits upon project or milestone completion. The Investment tab now surfaces the necessary information to track revenue-based outcomes, enabling you to claim MAP funding benefits through a new MAP template in AWS Partner Funding Portal (APFP).
New Marketing Campaigns tab
Analyze the performance of AWS-led marketing campaigns you participate in and track demand generation metrics. Multi-select filters enables users to parse key metrics including campaign, location, and AWS customer segment and industry.
New Training and Certifications tab
Track your team’s training and certification achievements, including insights on further development opportunities.

Figure 1 – Filter data by Total or Unique Individuals.
Enhanced view of APN Customer Engagements (ACE) data
New filters and views in the Opportunities tab to provide deeper insights into your opportunity pipeline, including Opportunity “Type” to track Net New Business vs. Renewal opportunities.
Expanded Discounts insights
View insights for Partner Growth Discount (formerly Rebate), Public Sector Discount, and Partner Originated Discounts in the Solution Provider and Distributor tab. The new consolidated view enables you to efficiently track AWS initiatives, such as the Customer Engagement Incentive (CEI).
The Seller Insights dashboard consolidates all AWS Marketplace Seller Dashboards into one convenient location so that you can access AWS Marketplace and APN analytics through a unified tool, including data on billed revenue, collections and disbursements, agreements and renewals, taxes, and product usage.
To access the Seller Insights dashboard, partners must link their AWS Partner Central and AWS Marketplace seller accounts. To learn more, review the Getting Started Guide in AWS Partner Central.

Figure 2 – Toggle between partner insights and AWS Marketplace insights in the drop-down menu.
Benefits
With a consolidated view, the dashboard provides transparency into the data needed to evaluate and maximize business growth—reducing operational effort and time to revenue recognition.
Business insights include win/loss trends, geographic strengths/weaknesses, and key attributes that drive AWS referrals.
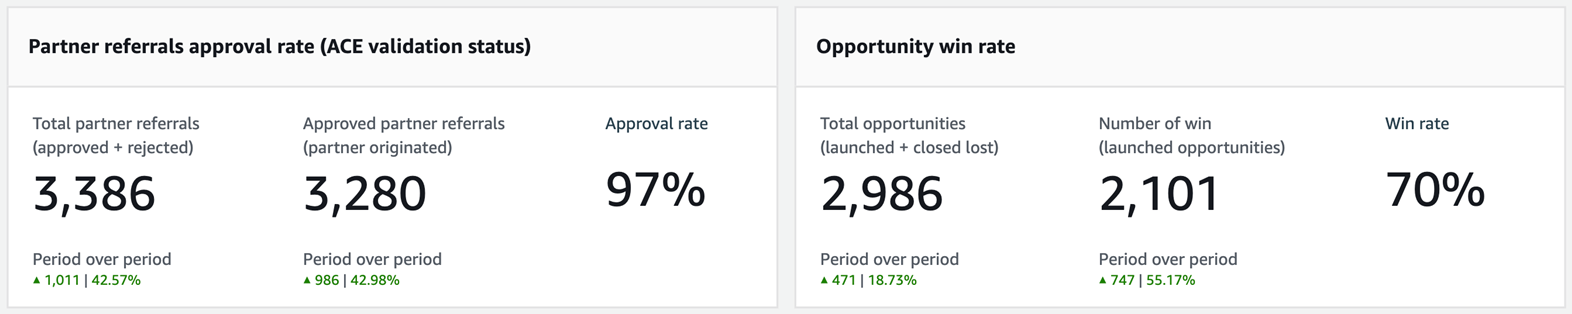
Figure 3 – Partner referrals approval rate and opportunity win rate.
The dashboard is customizable by metrics and date ranges, which provides flexibility to align with how partners manage their business. In the dashboard, users can:
- Review historical sales and opportunity trends in customized, time-bound intervals broken out by partner originated and AWS originated opportunities.
- Forecast estimated pipeline future revenue through quantitative insights on leads, opportunities, and conversion success rates.
- Track and measure the approved cash, credits, and discounts (Investments) they may receive from AWS along their partner journey.
Scheduled automatic refreshes provide timely information.
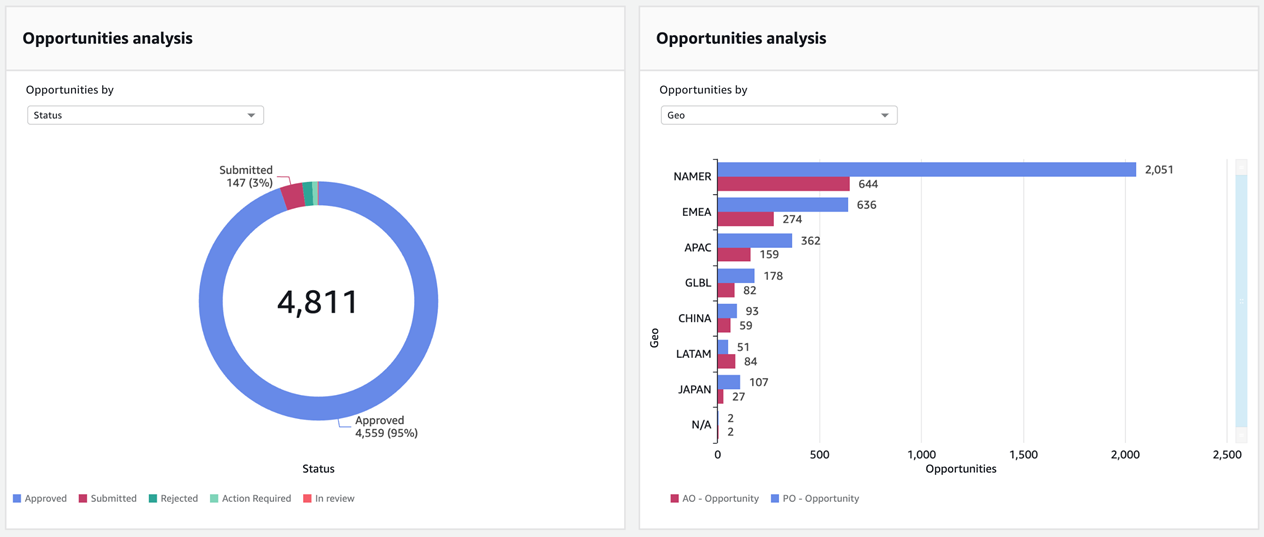
Figure 4 – APN Customer Engagements KPIs.
What partners are saying
Feedback from pilot partners played a key role in helping our team develop and optimize the dashboard and KPIs.
Jim Burnham, Strategic Partnerships Director at Ansys says, “Love the dashboard—especially the insights I can get into customer behavior and demographics.”
Partners tell us that the dashboard is comprehensive and features the right amount of data.
“Having a dashboard like this means I don’t have to spend hours creating views and graphs and re-cutting the data,” says Rob Nash, Vice President, Consulting Services and Global AWS Alliance Lead at CGI.
With deeper insights into their AWS business, partners can maximize their organization’s growth. “The Analytics and Insights Dashboard plays a vital role in our day-to-day operations; helping us optimize our work-loads, engagements, and deliverables,” explains Zeeshan Qureshi, Director at INIT.
What’s next?
Future updates include personalized and actionable growth recommendations to drive customer demand and ACE eligibility tracking.
For partners with strategic collaboration agreements, we’re working on incorporating granular data on your progress and contract goals.
Get started
Partners at the Validated or Differentiated stage can access Analytics and Insights through AWS Partner Central via the Analytics tab.
Learn more about the dashboard’s functionality and the latest updates in the Analytics and Insights User Guide and FAQs (login required).