AWS Partner Network (APN) Blog
Centralized AWS Observability with Grafana Cloud for Monitoring, Analytics, and Optimization
By Ana Ivanov, Software Engineer – Grafana Labs
By Kyle Eckhart, Sr. Software Engineer – Grafana Labs
By Richard Lam, Sr. Group Product Manager – Grafana Labs
By Parth Shah and Jason Mimick, Solutions Architects – AWS
 |
| Grafana Labs |
 |
Amazon CloudWatch is used to collect and analyze observability data from AWS services, but while Amazon Web Services (AWS) remains the most broadly adopted cloud platform, not every company uses it exclusively. This means customers need tools which give a centralized view across all environments.
Grafana Labs is an AWS Partner and AWS Marketplace Seller that supports any and all data sources that matter to their users, and has collaborated with AWS for years through fully managed CloudWatch metrics integrations.
Now, Grafana Labs is taking that support to another level by rolling out an updated AWS experience that expands the number of AWS offerings which can be monitored in Grafana Cloud.
Customers can use Grafana Cloud to connect over 60 of the most popular AWS services. Interacting with those services in Grafana Cloud is easier than ever, providing one portal to set up and manage an entire AWS observability strategy. This post takes a closer look at the changes that will make it easier to manage your AWS environment.
Grafana Cloud for AWS Observability
Grafana Labs supports users’ infrastructure and applications wherever they are, regardless of data type or source. However, centralized observability is critical to fully understand the state of your systems. In fact, Grafana Labs’ Observability Survey found that 83% of companies that have centralized observability have saved time or effort as a result.
The new AWS integration helps organizations centralize their observability. Many users are already leveraging Grafana to monitor their core infrastructure and services, and these integrations help users to centralize their critical observability data into a single place, which makes it easier to troubleshoot issues as they arise.
If observability data is dispersed across many systems, then problem diagnoses is harder. This results in longer mean times for issue resolution.
In addition to the growing catalog of AWS services which connect to Grafana Cloud through the AWS integration, here are some other key benefits of this solution:
- Simple to configure, follows AWS best practices for granting third parties access with no exchange of credentials required.
- Access to a fast, scalable backend you don’t have to manage.
- Explore data using Prometheus-native query language—the de facto standard in observability.
- Query Amazon CloudWatch metric data by resource tags.
- Single data queries in a consistent language across a single dataset.
- Unlimited queries with no rate limits.
- One tool for monitoring, share with colleagues and teams.
Monitoring AWS Metrics with Grafana Cloud
Getting started with the AWS integration for Grafana Cloud is easy. Just follow these simple steps:
- Sign up for a forever free Grafana Cloud account if needed.
- Navigate to the Connections > Connect data page.
- Search for AWS and click on the AWS card.
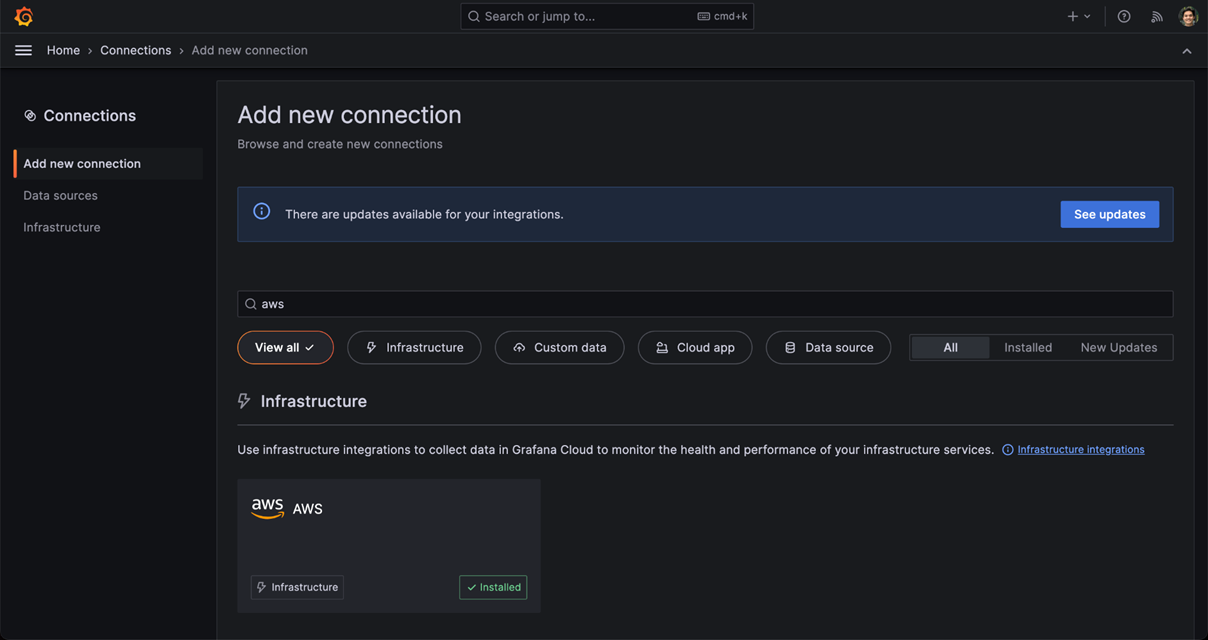
Figure 1 – Navigate to Connections and search for the AWS card.
- Select CloudWatch metrics integration.
- The CloudWatch integration setup has two options: automatically or manually configuring the AWS Identity and Access Management (IAM) authorization role for the connection to AWS.
- Automatic method has options for either using AWS CloudFormation or Terraform to create the role. T
- Manual route requires you to create the role yourself.
- Once the role is created, enter the role’s Amazon Resource Name (ARN) into the connection setup.
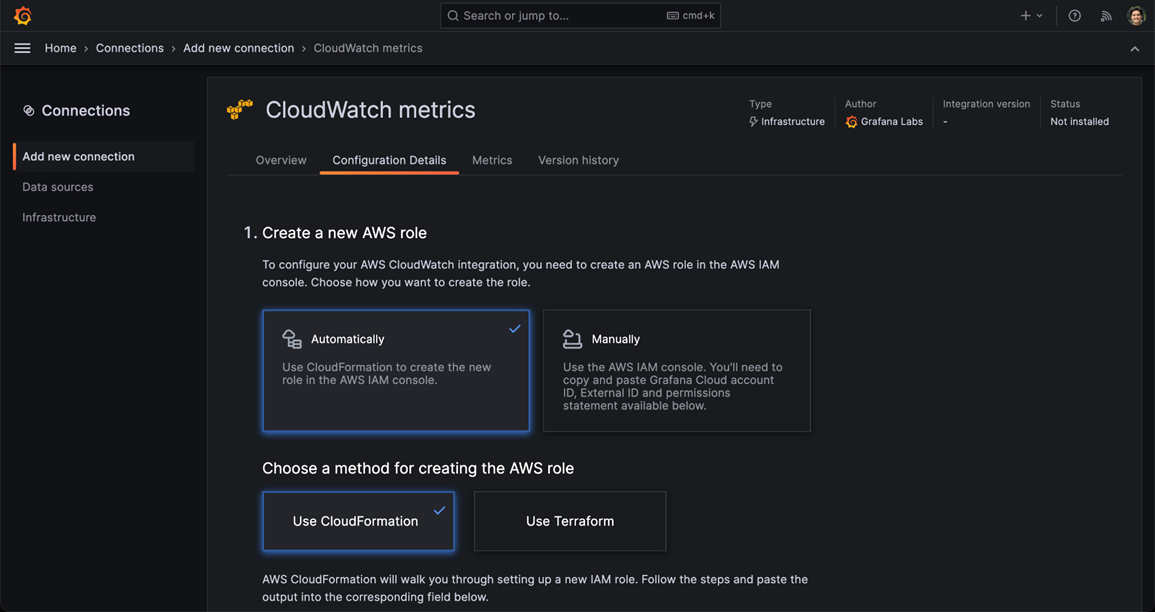
Figure 2 – AWS CloudFormation is used to create the role.
- Next, select the AWS services to connect and create a scrape job. A best practice it to create one scrape job per service.
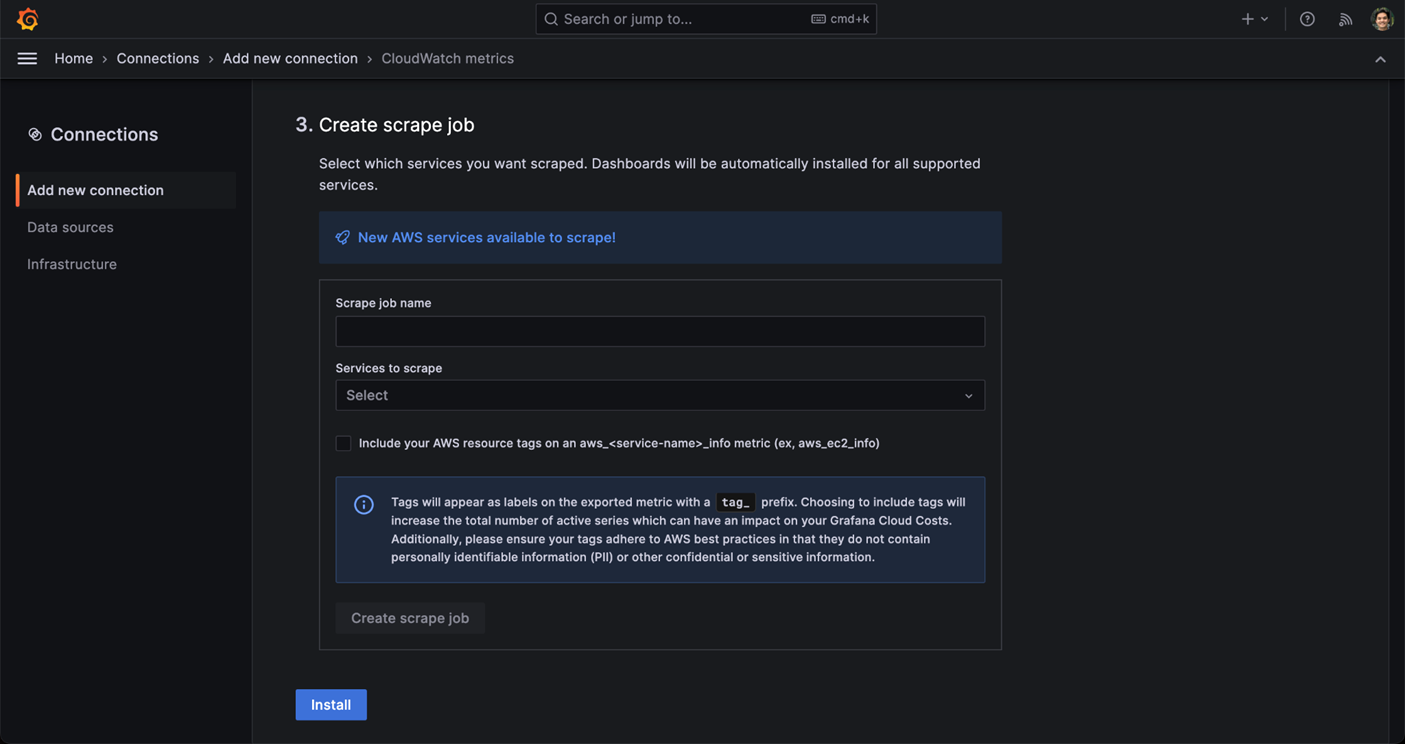
Figure 3 – Create a scrape job name and select corresponding AWS service to scrape.
- Granularly tune the different AWS services that connect to Grafana Cloud, if desired. For each service, select the exact metric to connect and pick from various statistics by metric (average, maximum, minimum, percentiles).
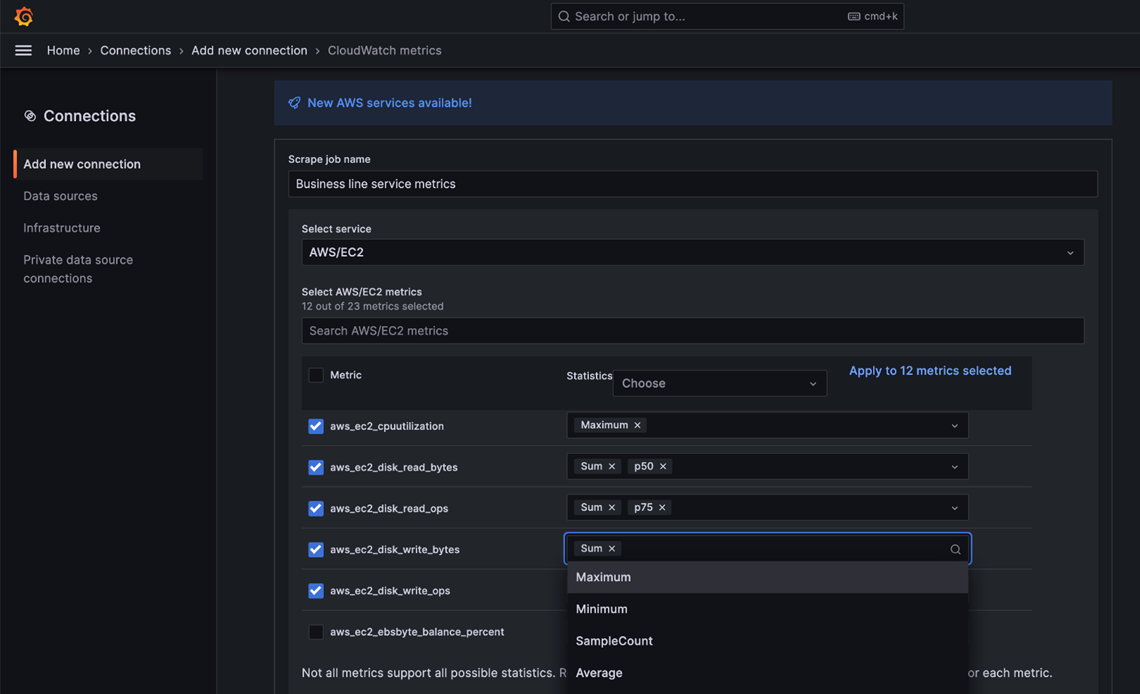
Figure 4 – Choose specific metrics for your scrape job.
- Click the Install button to add out-of-the-box Grafana dashboards.
- Now, click View Dashboards at the top of the page to see the list of available dashboards for various AWS services.
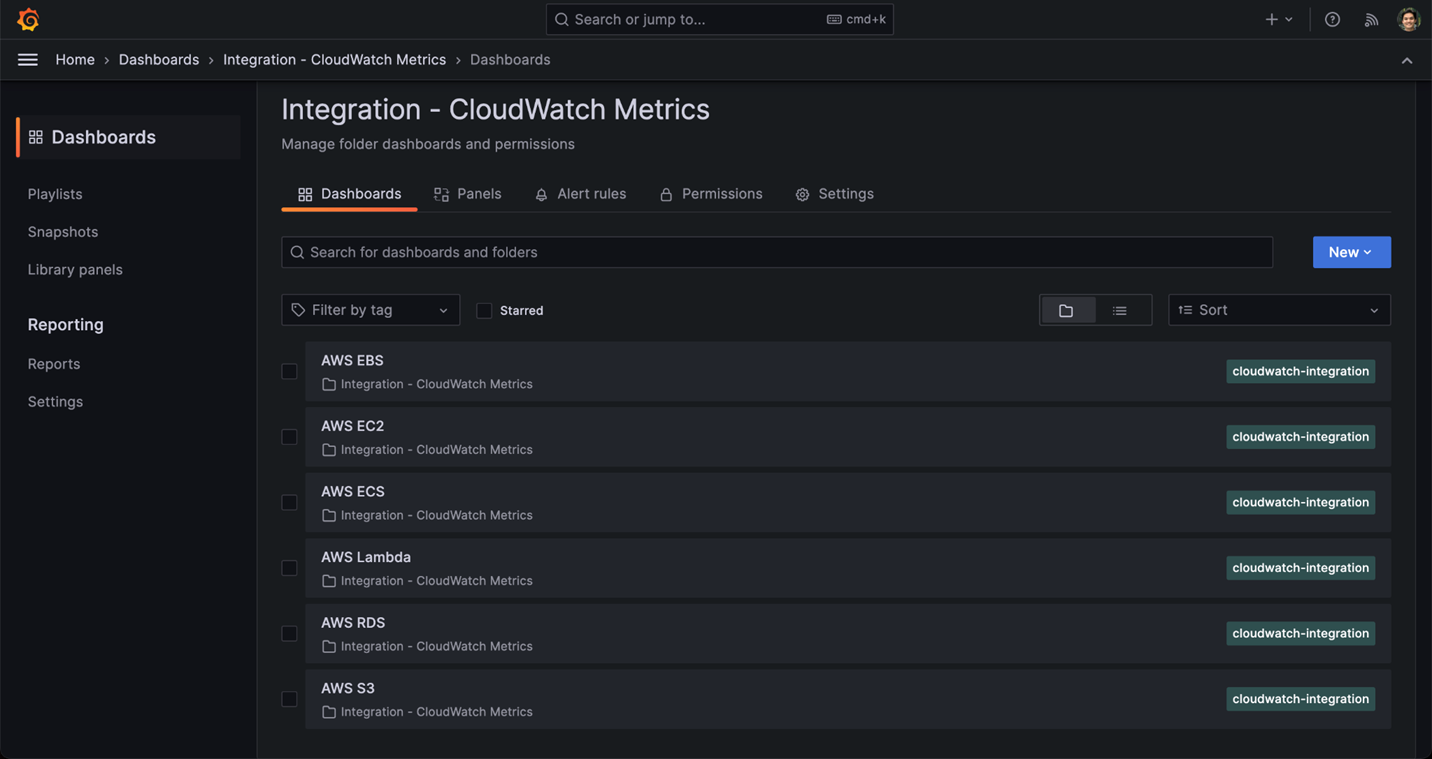
Figure 5 – Choose from a collection of pre-built dashboards.
- Pre-built dashboards for the most popular AWS services are available in the Grafana Cloud console; for example, here’s an instance of the out-of-box Amazon Elastic Block Store (Amazon EBS) dashboard which allows users to monitor read and write throughput and performance.
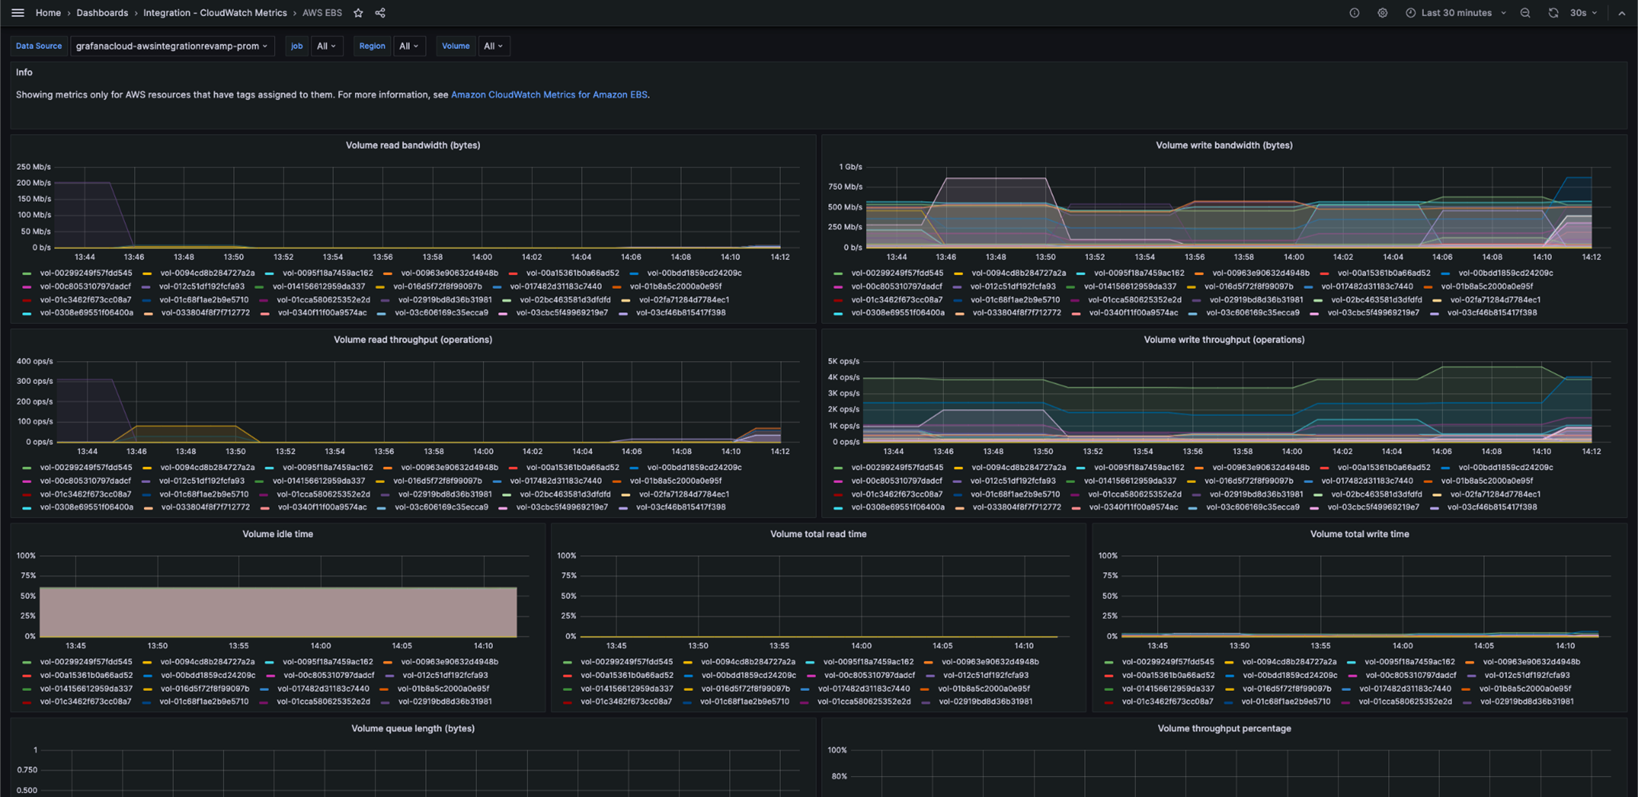
Figure 6 – Dashboard displays throughput and performance metrics from EBS.
What’s Next for AWS Observability with Grafana Cloud?
AWS is integral to the application development and management of many customers, so Grafana Lab’s is committed to adding new and improved enhancements to the existing AWS integrations. Grafana Labs plans to add support for more services, deployment types, and out-of-the-box functionality to help you better understand your usage and costs.
Conclusion
Sign up for a Grafana Cloud account to try out the AWS integration, or get Grafana Cloud through AWS Marketplace.
Integrations are free across all tiers; just pay for what you used based on data ingestion. If there’s an AWS service you want to monitor but don’t see in the list of integrations, email Grafana Labs at integrations@grafana.com to request its inclusion in the future.
.

.
Grafana Labs – AWS Partner Spotlight
Grafana Labs is an AWS Partner that supports any and all data sources that matter to their users, and has collaborated with AWS for years through fully managed CloudWatch metrics integrations.