AWS Partner Network (APN) Blog
Debugging Distributed Workloads on AWS Fargate in a Fast and Secure Way with Thundra Sidekick
By Ismail Egilmez, Business Development Manager – Thundra
By Marina Novikova, Partner Solutions Architect – AWS
 |
Software development on the cloud has changed many things. Modern applications are now composed of several distributed microservices linked together using event buses.
The robustness and ultimate scalability of Amazon Web Services (AWS) has made it possible to build a reliable and fast architecture. As a tradeoff, software issues for some became harder to replicate on the local workstations.
For this reason, application teams are looking for ways of understanding, isolating, and resolving problems faster without causing a negative impact on end users.
Some known tactics can be listed as mimicking the production environment on the local or developer cloud, improving the ways of digging into the logs, and leaning on Application Performance Management (APM) tools to discover the issues faster.
Unfortunately, every approach has its own unique challenges and doesn’t provide the comfort of debugging a local application. In this post, we’ll discuss several approaches to debugging remote applications on AWS Fargate and suggest a solution developed by Thundra, an AWS DevOps Competency Partner, that handles the downsides of existing approaches.
Thundra Sidekick makes it possible to remote debug applications hosted on AWS without stopping their execution. You can put non-breaking breakpoints (named as tracepoints) in your applications and take snapshots when the code execution hits the tracepoints.
With its plug-and-play instrumentation, Sidekick automatically connects the tracepoints of the same transaction in a distributed trace. The visualized traces let you see the errors in your microservice architecture at a glance.
We’ll use a well-known Petclinic demo application to show the capabilities of Thundra Sidekick. Although it walks you through debugging applications on AWS Fargate, it can be applied to other compute services of AWS such as Amazon Elastic Kubernetes Service (Amazon EKS) and Amazon Elastic Compute Cloud (Amazon EC2).
Existing Approaches to Microservices Debugging
In this era of cloud, the term “debugging” means several different things and none of them is actually close to the real debugging experience with breakpoints.
The possible workarounds to debug distributed microservices are digging the logs, replicating cloud environments locally, and using APM tools to troubleshoot the issues. All three help developers debug their modern cloud applications on AWS, but they all have some issues preventing them from being ideal.
Debugging Local Replicas of Cloud Environment
When you need to debug a problem that occurred in a remote cloud environment, the first thing that comes to mind is to reproduce it and possibly test the fix on the local machine.
However, mimicking the cloud environment on local machines is a daunting task, as it requires using the local versions of cloud services and/or mocking some of them with the stub data.
Developers are required to invest time and energy for this, and yet they can’t verify the similarity between the cloud environment and local workstation.
The developer community came up with some solutions, such as Localstack, to recreate the AWS services locally. These kinds of solutions are useful in some cases but may not reflect the latest versions of AWS services.
To avoid this problem, it’s advised to use developer environments mimicking production for each developer.
Digging the Log Streams for Debugging
The most commonly known and widely implemented solution is using logs to debug any application. It was a good solution at least more than a decade ago, but when you want to debug a distributed microservice application, it’s not easily feasible.
The first reason is that you need to enable log levels for several microservices to avoid drowning in logs. This itself is a hard decision to make. Then, you need to find the relevant logs coming from several different sources and correlate them manually.
It’s hard to achieve this with just one service; imagine how hard it would be to deal with multiple AWS services. Using old-world habits for new modern applications may turn out to be tiring and not so useful.
Traditional Remote Debugging
Remote debugging is not a new term for experienced developers. The application you want to debug doesn’t have to be on your local machine to pause the execution and debug as if you’re debugging a local application.
However, this approach has two main issues for distributed microservices. First, traditional debugging means pausing a remote application while others are using it. For pre-production applications, a colleague might be using that application, so you could be throttling the usage of a microservice. For post-production, you can block the usage of your customers and fail your application badly while trying to fix it.
The second issue is security. When you set up a remote debugging session, you have to open network ports on your application server to the whole world. This is needed to pass the commands of pausing and playing the application and retrieving the values of local variables.
Even configuring to use SSL and authentication, it’s still a security risk when any remote user who knows or guesses the port would be able to influence your application. While it may be acceptable on development environment, it’s totally unacceptable for production.
An open port means an open door for threats and security issues. This violates the compliance and security best practices of many organizations. Therefore, traditional remote debugging is impractical for distributed applications.
Using APMs to Debug Microservices
APM solutions claim that modern problems require modern solutions. It’s right to say that APM solutions provide efficient ways of understanding issues by integrating several sources of logs, metrics, and traces. However, they introduce a completely new set of problems due to the steep learning curve and new user interface.
It’s not as straightforward as the debugging itself, and most of the time it can’t provide the granularity of information that a developer needs. For example, no APM solution gives you the ability to play with local variables during the execution to reproduce the desired behavior of code, which is simply what we regard as “debugging.”
Thundra Sidekick Solves the Remote Debugging Problem
Thundra Sidekick seamlessly integrates with AWS services such as AWS Fargate, Amazon EC2, and AWS Lambda, and offers a way of debugging code without stopping the execution of the running service. In this way, the application performance and security are not affected negatively.
Mostly, applications are distributed and get triggered via asynchronous event sources. Thundra’s agents get the breakpoint data without a performance overhead and link the breakpoints of the same transaction all together. This enables users to see the whole execution of their application end-to-end.
Non-intrusive debugging with non-breaking breakpoints means you can debug your remote application like you’re debugging a local application while it’s running. Non-intrusive breakpoints allow developers to work together in the same environment without pausing someone else’s application.
When you set a tracepoint in your application code with Sidekick, its agent intercepts the execution on the line of the tracepoint and takes the snapshot of the variables during the execution, and lets the execution flow. The maximum overhead of a tracepoint is approximately a maximum of 20 microseconds.
Sidekick instruments your applications with just a few clicks, and then connects the breakpoints of the same transaction with distributed tracing. In this way, developers can navigate or step into a breakpoint or just go to the next breakpoint.
Debugging Distributed Application with AWS Services
For the purposes of this post, we prepared a demo application and scenario based on a Petclinic application. We added a new notification application to the existing monolithic Petclinic application to turn the application into a microservice architecture.
Therefore, our application is composed of two Spring applications running on AWS Fargate and communicating asynchronously via Amazon Simple Queue Service (SQS).
The Petclinic application receives the request from Application Load Balancer and informs the Petclinic-Notification application via a message through SQS. Then, the Petclinic-Notification application notifies users with an SMS via Amazon Simple Notification Service (SNS). See the source code, and explore the application architecture below.
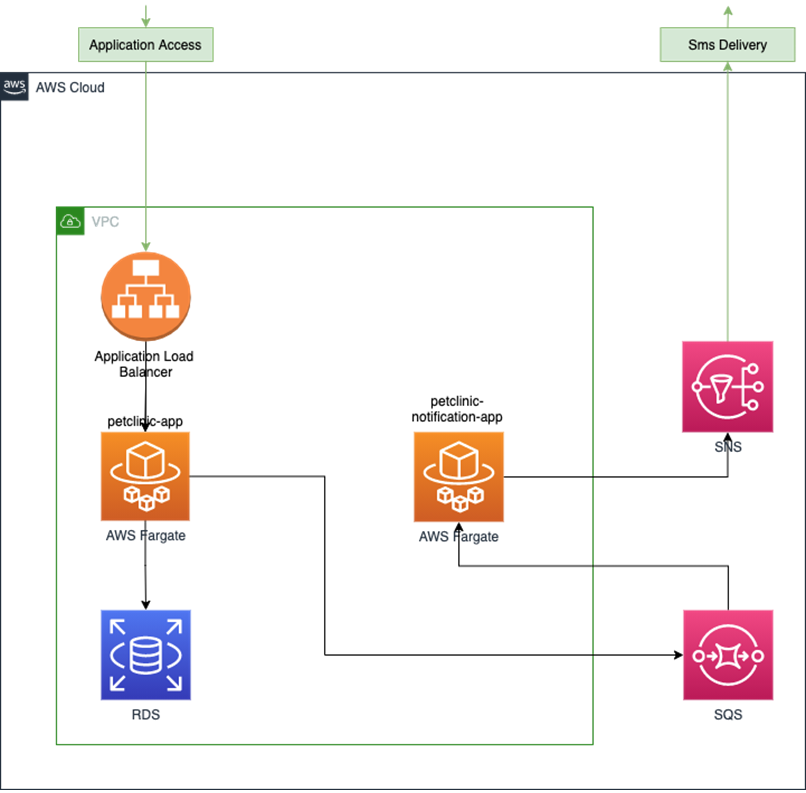
Figure 1 – Petclinic application architecture.
First, you need to set up and install Thundra Sidekick. Then, instrument your application with Thundra’s agent and make the minimum required configuration.
When we added a visit to our pet, we noticed the system did not send an SMS to us to verify the visit was successfully added in the system. So, we wanted to debug the system with Sidekick and see what and where the problem was.

Figure 2 – Importing application code from GitHub to a project in IntelliJ IDEA.
We imported our code to Sidekick’s web application with an easy-to-use GitHub integration. Next, we connected to Thundra’s broker using our Thundra account credentials.
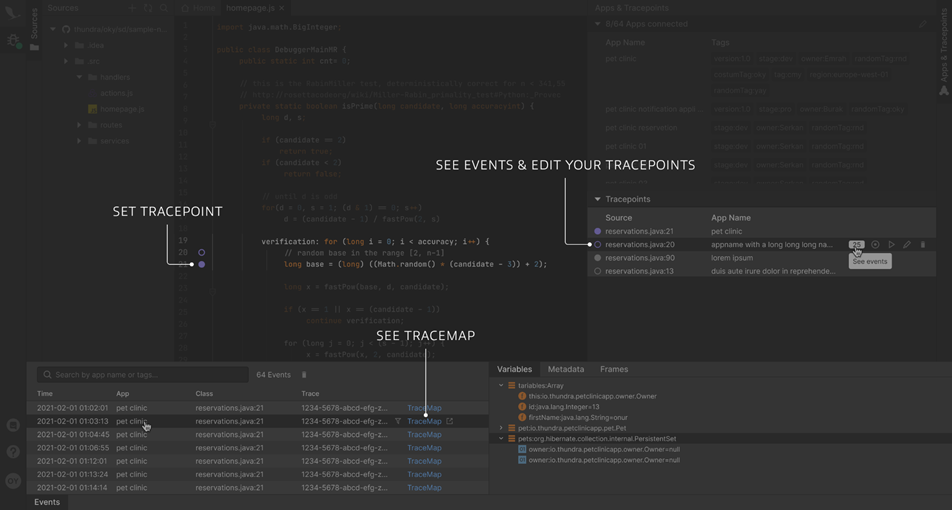
Figure 3 – Debugging your application in the IDE with Thundra Sidekick.
Then, we set a tracepoint just like a breakpoint on our code, where the SNS service is called when we added another visit to our pet just to run the application again to let Sidekick take a snapshot of the application execution.
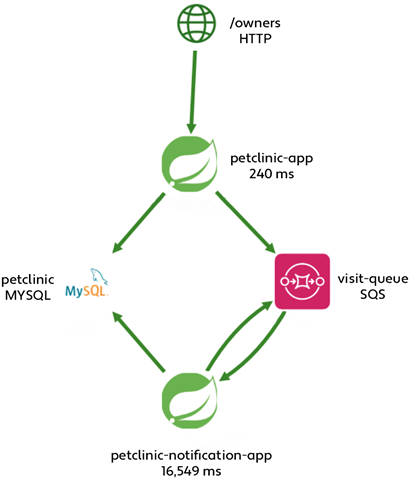
Figure 4 – Application execution diagram captured by Thundra.
When we see the correlated tracepoints transaction in the Thundra console, as seen in Figure 4, we noticed the Petclinic-Notification application did not call the SNS service which sends an SMS to users.
After we noticed there was a problem in our system, we detected what and where it is in four simple steps using Thundra Sidekick:
- Sign up and instrument your application (see video)
- Import your code (see video)
- Set tracepoints and take snapshots (see video)
- See the distributed trace maps (see video)
Thundra Sidekick is fast, secure, and easy-to-use compared to a typical cycle to debug and fix issues in microservice cloud applications.
Summary
It’s unpleasant when the speed of a software developer is limited. Development speed decelerates when code has to be pushed to the cloud every time a change is made, and it’s difficult to debug distributed microservice applications on the cloud.
Thundra and AWS help developers embrace the power of remote development without any drawbacks. Applications teams can move their workloads to the AWS Cloud or improve and modernize their applications without hesitating with the combined value of AWS and Thundra.
Thundra Sidekick supports Java runtime with its web application and IntelliJ IDEA plugin.
.

.
Thundra – AWS Partner Spotlight
Thundra is an AWS Competency Partner that provides deep performance and security insights into the distributed workflows of serverless-centric applications.
Contact Thundra | Partner Overview | AWS Marketplace
*Already worked with Thundra? Rate the Partner
*To review an AWS Partner, you must be a customer that has worked with them directly on a project.