AWS Partner Network (APN) Blog
How to Streamline and Automate Reliability with Gremlin and Amazon CloudWatch
By Andre Newman, Technical Marketing Manager – Gremlin
By Shashiraj Jeripotula, Sr. Partner Solutions Architect – AWS
 |
| Gremlin |
 |
Amazon Web Servicers (AWS) is a reliable platform for building and deploying cloud-based applications, but that doesn’t mean the unexpected can’t happen.
Amazon Elastic Compute Cloud (Amazon EC2) instances may reboot, misconfigured networking rules could cause outages, and under-provisioned Amazon Elastic Kubernetes Service (Amazon EKS) clusters could exhaust CPU and RAM.
Additionally, AWS customers often run workloads spanning multiple services; for example, running a backend application on an EKS cluster, load balancing with Amazon Route 53, and monitoring CPU and memory using Amazon CloudWatch. Each of these introduces points of failure that could lead to outages, unless you prepare for them in advance.
Gremlin is an AWS DevOps Competency Partner and AWS Marketplace Seller that gives users a solution for safely and securely improving the reliability of their technology stack. Teams can use Gremlin to find hidden reliability risks, standardize reliability testing and measurement, and simulate real-world outages with an ever-growing library of tests.
As a market leader in chaos engineering and reliability management, Gremlin helps hundreds of organizations build cultures of resiliency, increase uptime, prevent unplanned outages, modernize disaster recovery efforts, and more.
In this post, you’ll learn how to test and measure the reliability of AWS systems using Gremlin Reliability Management and Amazon CloudWatch.
Key Benefits of Gremlin Reliability Management
Gremlin’s latest offering, Gremlin Reliability Management (RM), helps teams proactively improve reliability at scale. It provides a suite of pre-built reliability tests to help standardize, measure, remediate, and automate reliability practices.
With Gremlin RM, you simply define your services in Gremlin, link your CloudWatch alarms, and then run each of Gremlin’s auto-generated reliability tests to determine whether your service is susceptible to different failure modes. This lets you:
- Understand your reliability risks at each level of your technology stack.
- Standardize and streamline reliability testing across your organization.
- Automate reliability by scheduling regular tests.
Solution Overview
Gremlin is a managed service that uses agents to orchestrate reliability tests and chaos engineering experiments. You can deploy agents using Helm or kubectl for Kubernetes; Docker images for containers; or packages for Amazon EC2, virtual machines, and bare metal.
After deploying your agents, define your services in Gremlin using the Gremlin web app. A “service” is an individual unit of functionality that, when combined with other services, makes up your application. A service can be a Kubernetes deployment, a set of containers, or individual processes running on one or more instances.
Services are the base unit of reliability measurement within Gremlin. Once you define a service in Gremlin, the platform assigns it a reliability score and generates a set of reliability tests. You can start running tests on that service, track its score and history, and compare all services across your team or organization.
In this post, we’ll be installing onto Amazon EKS via Helm.
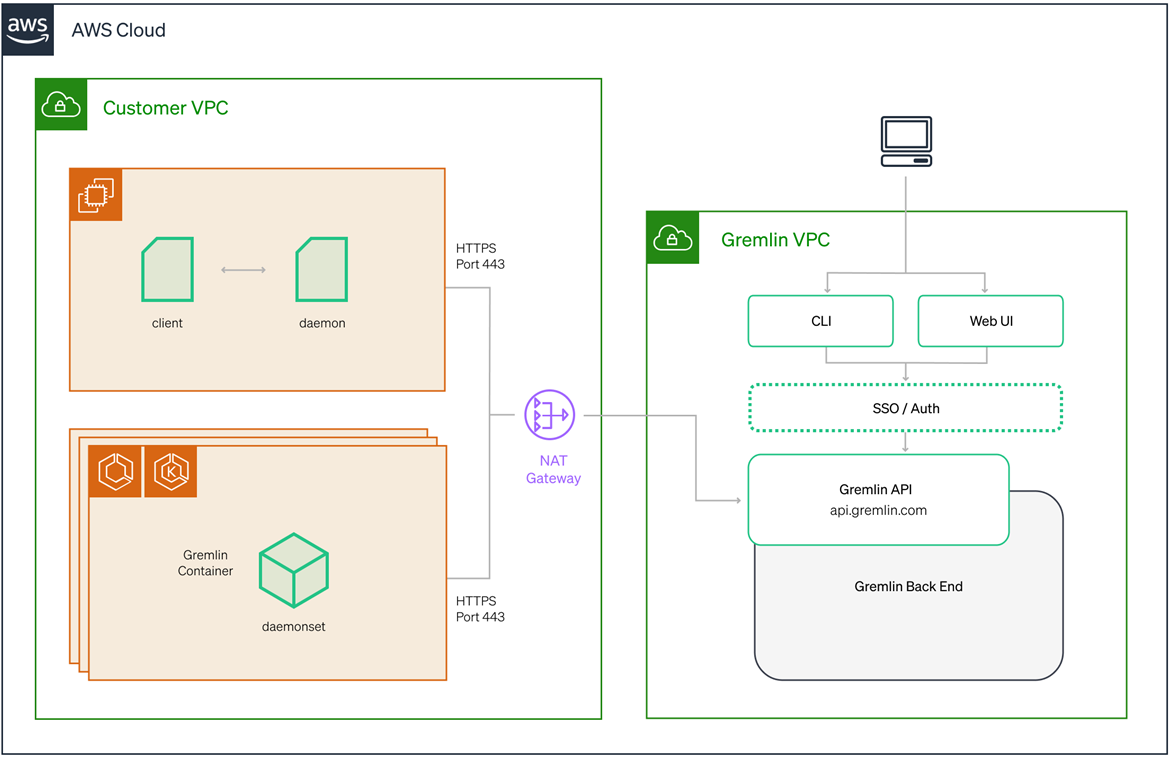
Figure 1 – Gremlin is deployed within your AWS environment.
Prerequisites
Before you begin this tutorial, you’ll need the following:
- AWS account
- AWS Command Line Interface (AWS CLI) configured on a local machine
- eksctl command-line tool configured on a local machine
- Gremlin account
Walkthrough
This tutorial will walk you through the required steps to:
- Run an Amazon EKS cluster
- Deploy two microservice-based applications with CloudWatch metrics
- Define a service in Gremlin using a CloudWatch metric as a health check
- Run a reliability test
After following these steps, you’ll get a reliability score indicating how well your service withstood the reliability test.
Step 1: Verify Your Account AWS CLI Installation
To get started, verify you have your AWS CLI configured to use eksctl to create the EKS cluster: aws –version
This should give you an output similar to:
aws-cli/1.16.150 Python/3.7.3 Darwin/18.5.0 botocore/1.12.140
If you need help, review the AWS CLI installation documentation.
Step 2: Deploy an Amazon EKS Cluster
In this step, we’ll create a new EKS cluster and deploy our application to this cluster, using it to run our reliability tests.
First, we’ll create the cluster. You can replace “my-cluster” with whatever name you’d like to give this cluster. If you want to run it in a different region, you can also change the region code. This cluster only needs two worker nodes.
eksctl create cluster --name my-cluster --region us-east-2
After a few minutes, you’ll see the following message:
[✓] EKS cluster "my-cluster" in "us-east-2" region is ready
eksctl also automatically creates the required kubectl configuration file, so you can run commands on the cluster using kubectl.
Step 3: Deploy a Kubernetes Application
Next, we’ll deploy an example application. This is a retail application split out into 11 services as shown below.
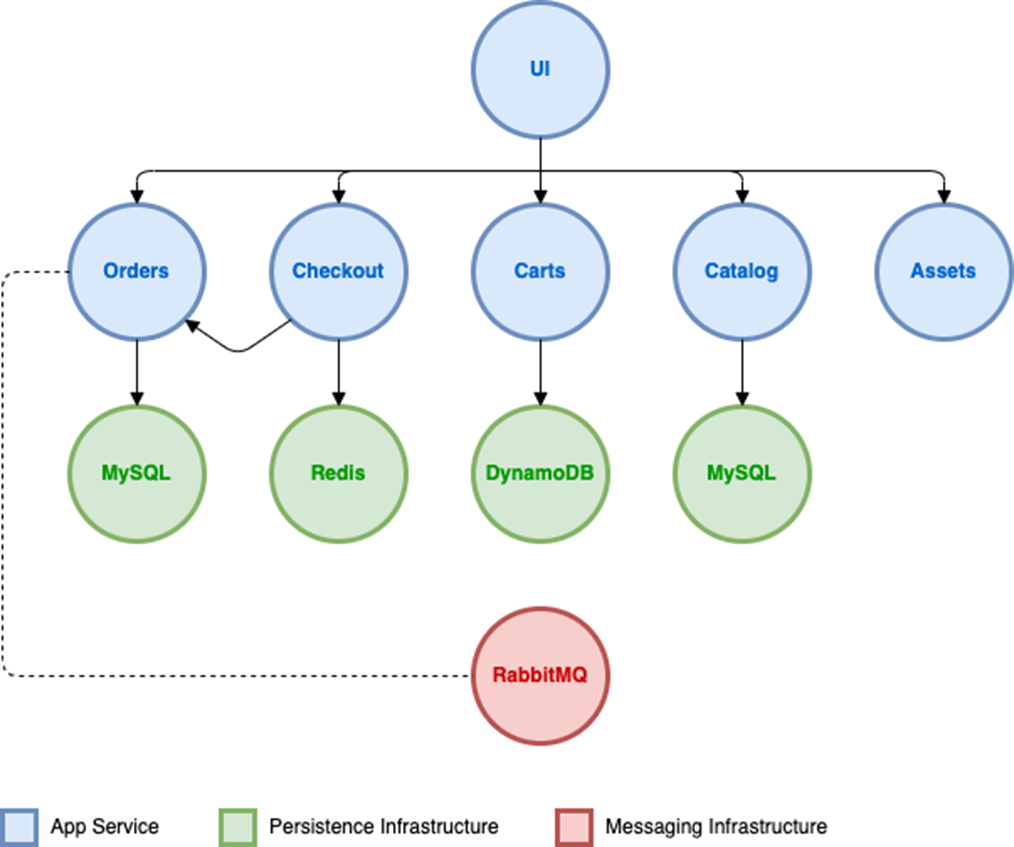
Figure 2 – Architecture diagram of the retail store sample application.
To deploy the application, run the following commands in your terminal:
kubectl apply -f https://raw.githubusercontent.com/aws-containers/retail-store-sample-app/0.4.0/dist/kubernetes/deploy.yaml
If you want to open the website in your browser, run this command to get the IP address:
kubectl get svc/ui
Retrieve the EXTERNAL-IP and open it in your web browser, where you’ll see the following screen. If not, don’t worry—as long as the deployment succeeds, you can continue to the next step.
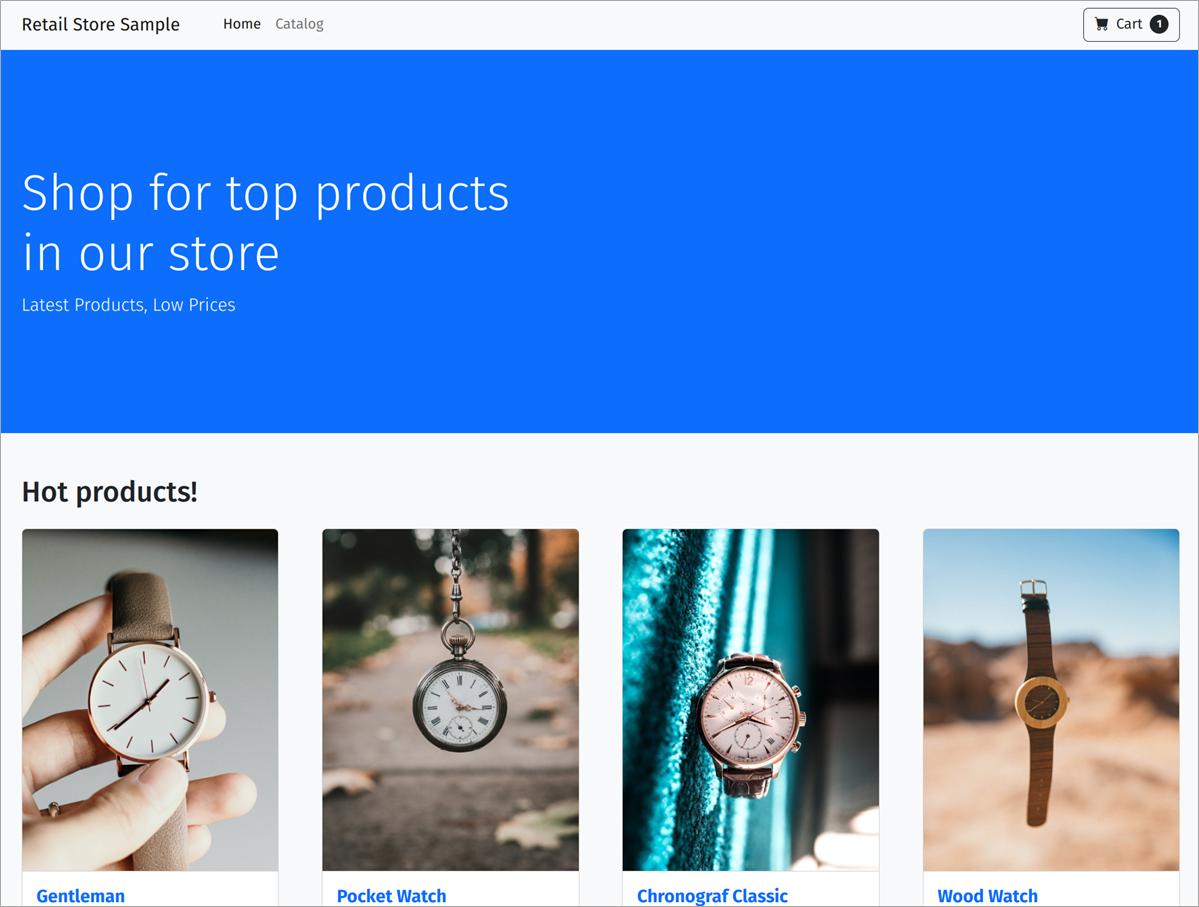
Figure 3 – Retail store sample application as it appears in a web browser.
Step 4: Deploy the Gremlin Agent
To deploy the Gremlin agent, we’ll use the kubectl command-line tool and Helm. The Gremlin agent is deployed as a DaemonSet, and the agent will automatically detect Kubernetes resources which we’ll use to define our service in the Gremlin web app.
First, log into your Gremlin account and navigate to Team Settings (click on the user icon in the top-right corner of the screen and select Team Settings).
Next, select the Configuration tab and look for the Secret Key line. If you don’t already have a key created, click Create. Otherwise, click Reset to generate a new secret. This secret will only be shown once, so make sure you copy it to a text file or other location. You’ll also need your Team ID, so copy it or keep this page open.
Run the following command in your terminal to add the Gremlin Helm repository:
helm repo add gremlin https://helm.gremlin.com/
Run this command to create a new Kubernetes namespace for Gremlin:
kubectl create namespace gremlin
Now, run the following command to deploy the Gremlin chart. Make sure to replace YourGremlinTeamID and YourGremlinSecret with your Gremlin Team ID and the secret key you copied earlier in this step.
Step 5: Create a CloudWatch Alarm to Monitor the Application
Next, let’s create a CloudWatch alarm to monitor our application. We’ll create a relatively basic alarm that checks to see whether our EC2 node group is responsive.
First, open CloudWatch in the AWS Management Console. Under “Get started with CloudWatch” click Create alarms, and then select the Create alarm button in the top right corner. Choose Select metric and search for StatusCheckFailed. From the results, click EC2 > By Auto Scaling Group, and then check the box next to Status Check Failed. Finally click the Select metric button.
For the conditions, open the Statistic drop-down box and select Maximum. Open the Period drop-down box and select Maximum. Make sure the Threshold type is set to Static, select Greater/Equal, and enter “1”into the number box. In other words, this alarm will fire if the Status Check fails at least once during the one-minute period. Click Next.
The next screen will show prompt for you to configure sending notifications via Amazon Simple Notification Service (SNS). We don’t need notifications, since Gremlin is monitoring this for us, so click Remove and then Next. Enter a name for this alarm (such as “EC2 Status Check Failed”) and enter a description if you wish. Click Next, review your settings, and click Create alarm. You’ll see the following in the CloudWatch console.
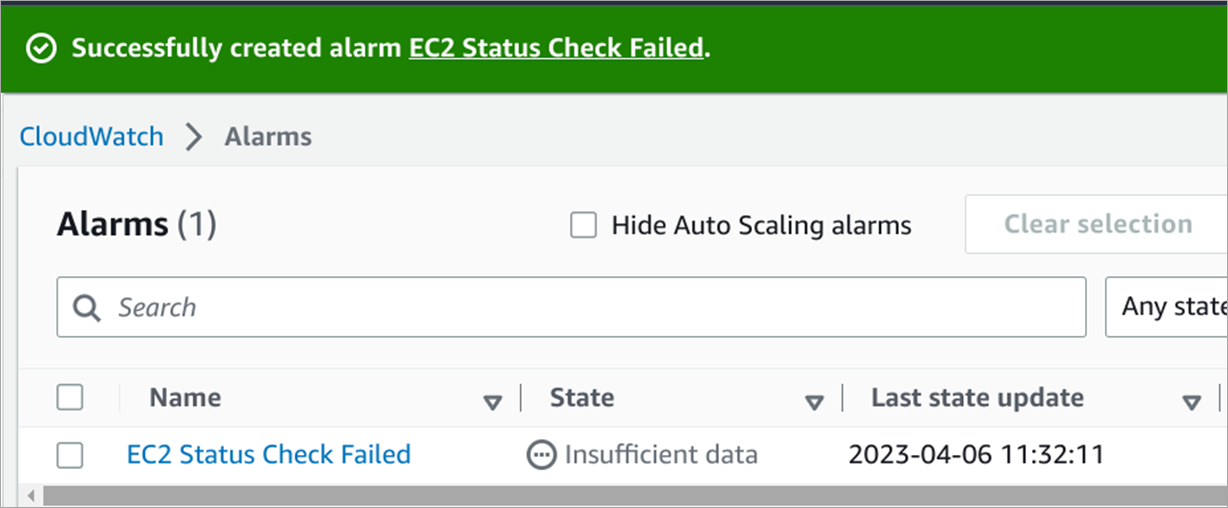
Figure 4 – Newly created CloudWatch alarm named “EC2 Status Check Failed.”
Step 6: Define a Service in Gremlin and Connect CloudWatch Alarm
Now, we can define our service. In Gremlin, select Services in the left-hand menu, and click + Service. Enter a name for the service, and then select Kubernetes from the Type of Service combo box. Click Next to continue.
You’ll need to tell Gremlin which Kubernetes resource(s) identify your service (the “Service Fingerprint”). As an example, we’ll choose the ui service. The easiest way to do this is to type “UI” into the search box and click on the entry that appears. Then, click Next.
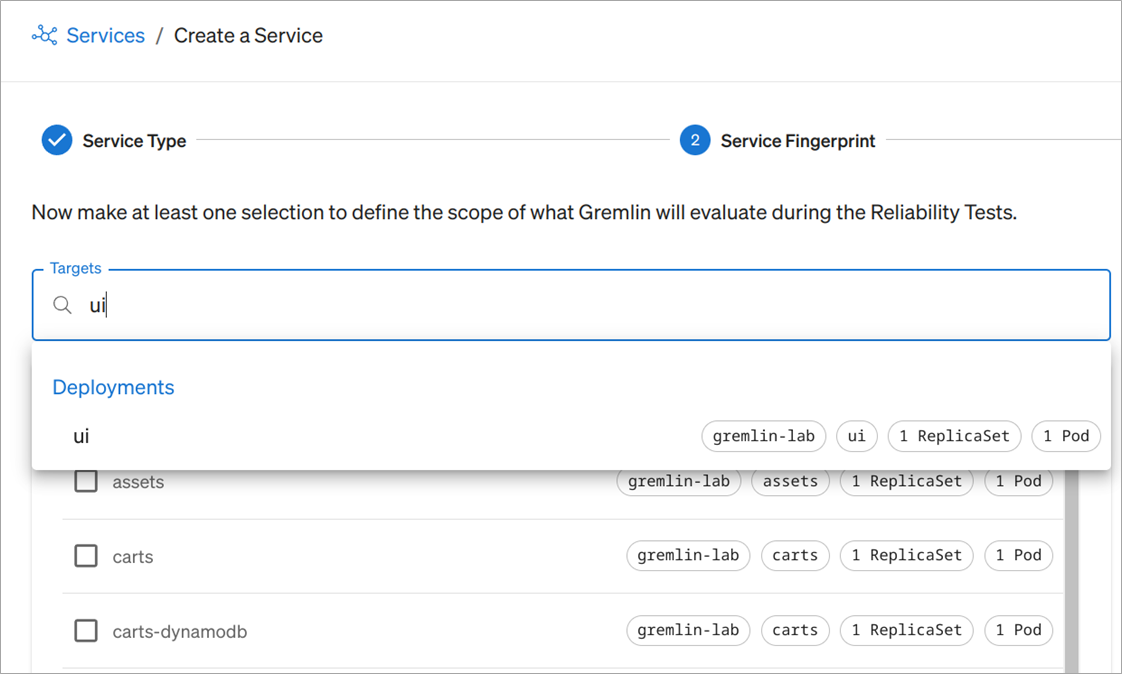
Figure 5 – Selecting a Kubernetes deployment named “ui” using Gremlin.
We now need to select the process running on Kubernetes. Gremlin uses process data to detect network dependencies. Since there’s only one process running in this service, which is “ui (port 8080)”, Gremlin selects it automatically, so you can just click Create Service.
With our new service created, let’s link our CloudWatch monitor:
- Under Getting Started, click + Health Check.
- Click on the Observability Tool combo box and select AWS.
- Enter your AWS Account ID.
- Enter the credentials for an AWS Access Key. If you need to create one, see Managing access keys for IAM users.
- Click Authenticate Observability Tool to make sure you can authenticate successfully, and click Save Authentication.
- Click Next to use the Account ID you just set up.
- Enter the name of the Health Check, and copy and paste the URL of your CloudWatch monitor. As a suggestion, use the monitor name for the Health Check. Click Test Connection to make sure the URL is valid.
- Optionally, specify the Success Evaluation criteria. As long as the monitor meets this criteria it’s considered healthy. By default, Gremlin considers any response with an HTTP 200 status code as healthy.
- Enter the endpoint URL of your CloudWatch metric.
- Click Test Connection to send a test API call. Gremlin should receive a successful response. If not, you might need to edit your header or URL configuration until you can make a successful API call.
- Leave the Success Evaluation criteria set to 200 for the Healthy Status Code and 1000 for the Request Timeout, and click Test Evaluation.
- Finally, click Create Health Check.
Step 7: Run a Reliability Test
Now that we can start running reliability tests, let’s run a CPU scalability test. This test consumes increasing amounts of CPU on our EKS cluster. If we configured our cluster to scale, this should trigger EKS to deploy an additional node to the cluster to increase capacity. If not, CPU will become limited and may cause slowdowns, pod evictions, or even crashes.
While the test is running, Gremlin continually checks our CloudWatch alarm. If the alarm enters the error state, or the Gremlin agents become unresponsive, Gremlin immediately stops the test and marks it as a failure. Otherwise, it marks as passed and we’ll see an increase in our reliability score.
Results
As it turns out, consuming CPU didn’t cause our cluster to become unresponsive, and so our service passed the test.
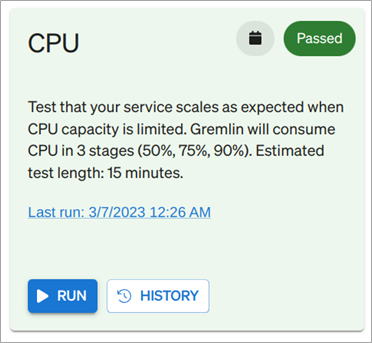
Figure 6 – CPU scalability test marked as “passed” in Gremlin.
This is a good sign that our service is resilient to spikes in CPU usage. We may still want to enable cluster auto-scaling just to be safe, but this tells us we have some headroom. Had we not passed the test—for example, if our cluster nodes became unresponsive—we’d see a failed test like in the following image.
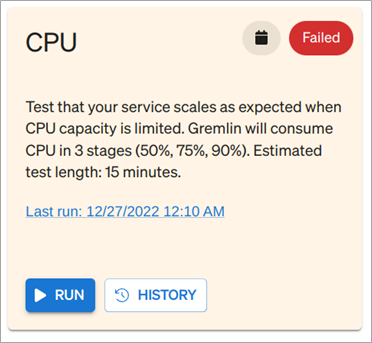
Figure 7 – CPU scalability test marked as “failed” in Gremlin.
Congrats! You’ve set up an Amazon EKS cluster, deployed a microservice application, installed the Gremlin agent using the Gremlin Helm chart, and ran your first reliability test to validate Kubernetes reliability.
If you want to continue testing, try running additional tests like a memory test, host redundancy test, or a dependency test. Depending on which ones fail, try modifying your cluster to make it more resilient, and then re-run the test to confirm your changes work. Try and get your reliability score as close to 100 as possible.
Cleanup
Remember to delete your EKS cluster to avoid additional costs. Your free Gremlin trial will automatically end after 14 days.
Summary
In this post, we covered how AWS customers can leverage Gremlin to test, measure, and improve the reliability of their Amazon EKS deployments, and we discussed Gremlin Reliability Management (RM) specifically.
Customers wishing to learn about Gremlin Fault Injection—Gremlin’s chaos engineering solution—can take a self-guided hands-on workshop to perform chaos engineering experiments within their AWS environments.
To see a demonstration of the platform, contact the Gremlin team. You can find additional tutorials, guides, and videos at gremlin.com. If you have questions or need help with this demo environment, please email support@gremlin.com.
You can also learn more about Gremlin in AWS Marketplace.
.

.
Gremlin – AWS Partner Spotlight
Gremlin is an AWS DevOps Competency Partner that gives users a solution for safely and securely improving the reliability of their technology stack.
Contact Gremlin | Partner Overview | AWS Marketplace | Case Studies