AWS Partner Network (APN) Blog
How to Visualize and Monitor Your AWS Container Fleet with Datadog
By Will To, Technical Writer at Datadog
 |
 |
Whether it’s an online retailer on Black Friday or game studio preparing for a big release, containers allow organizations to rapidly (and automatically) scale their systems in response to fluctuating demand. By packaging and deploying microservices in containers, developers can decouple applications from infrastructure, making it easier to deploy code without unanticipated side effects.
And yet, containers present new monitoring challenges. Because containers have an average lifespan of just two days, most traditional observability tools cannot keep up because they are designed to monitor servers that typically have a lifespan of several months.
To fully leverage the versatility and scalability of containers, you need a monitoring solution capable of providing clarity into a highly dynamic environment comprising thousands (or even tens of thousands) of ephemeral containers.
In this post, I will walk you through how Datadog provides comprehensive, real-time visibility into dynamic, ephemeral container workloads running on Amazon Elastic Kubernetes Service (Amazon EKS), which makes it easy for you to run Kubernetes on Amazon Web Services (AWS) without needing to install and operate your own Kubernetes clusters.
Datadog is an AWS Partner Network (APN) Advanced Technology Partner with the AWS Container Competency and multiple AWS Service Delivery designations that showcase our AWS technical expertise.
An Intro to Datadog for Amazon EKS
Datadog provides deep visibility into applications running on Amazon EKS, as well as the underlying cloud and container infrastructure.
With Datadog, you can sort fleets of containers by Kubernetes labels and AWS tags, isolate and investigate data from individual containers and services, and automate your monitoring and auto scaling processes.
As a managed Kubernetes service, Amazon EKS allows you to delegate the logistics of running your Kubernetes clusters to AWS. In other words, AWS will provision, configure, and host your Kubernetes clusters on AWS infrastructure.
This makes cluster setup much easier while enabling you to take advantage of various AWS technologies, including Amazon Elastic Compute Cloud (Amazon EC2) for provisioning hosts, Elastic Load Balancing (ELB), and Amazon Elastic Block Store (Amazon EBS) for high-performance block storage.
Amazon EKS automatically manages the Kubernetes control plane and distributes control plane nodes across multiple AWS Availability Zones to ensure high availability. By handling these operational tasks automatically, Amazon EKS allows engineering teams to focus on application development and end-user experience.
Datadog integrates seamlessly with the full spectrum of AWS technologies, from load balancers to databases, so you can visualize, monitor, and optimize every part of your Amazon EKS environment.
Installing the Datadog Agent
Traditionally, to get rich detail on a running container you’d have to use Secure Shell (SSH) to access a specific host before running shell commands to view resource usage or read container logs. Unfortunately, this process doesn’t scale across thousands of containers that are constantly being created, destroyed, or moved.
Datadog unites all operational data from your cluster in a single interface, allowing you to explore every layer of your stack. The lightweight, open-source Datadog Agent runs on your nodes, collecting metrics and other observability data and submitting this information to Datadog so you can easily search, filter, aggregate, and alert on important information.
By deploying the Datadog Agent across your Amazon EKS cluster, you can see the real-time performance of your containers in granular detail. To deploy the Datadog Agent to all of the nodes in your cluster (or specific groups of nodes), follow the instructions in the documentation to create a Kubernetes DaemonSet that automatically installs the Agent on each node.
Alternatively, if you are not able to use DaemonSets on your clusters, you can install the Datadog Agent as a deployment on each Kubernetes node.
Enabling Datadog’s Autodiscovery Feature
To automate monitoring in dynamic environments, the Datadog Agent provides the Autodiscovery feature for detecting which workloads are running on which nodes, and configuring data collection accordingly.
Autodiscovery checks a container’s identifiers against preloaded integration templates. For Kubernetes and Amazon EKS clusters, these identifiers are stored in pod annotations.
The Datadog Agent systematically browses all of your pod annotations to extract configuration details for your monitoring checks, including variables such as hosts and port numbers. By dynamically configuring your monitoring to match your workloads, Autodiscovery enables you to track containers as they spin up, shut down, or move across pods and hosts.
The following code is an example manifest for a Redis pod, annotated for Autodiscovery. Whenever a new pod is created from this manifest, the Datadog Agent enables Datadog’s Redis integration (based on the `redisdb` annotation).
The Agent will then dynamically apply the host IP address, the default port for Redis (6379), and the Redis password to the integration template so the Agent can start gathering monitoring data from the Redis container, wherever it may be running.
For more details (and integration templates for other technologies), see the documentation.
Installing the Cluster Agent to Streamline Data Collection
The Datadog Cluster Agent was specifically designed to gather monitoring data from large Kubernetes clusters. Essentially, the Cluster Agent serves as an intermediary between the Agents deployed on your nodes and the Kubernetes API server.
The diagram in Figure 1 shows the flow of data between the Cluster Agent and the Node Agents. Instead of having individual Node Agents connect with the API server, the Cluster Agent gathers cluster-level data and metadata from the API server and sends it to each Node Agent. This reduces the load on the API server while still allowing Node Agents to enrich locally collected metrics with the cluster-level data.
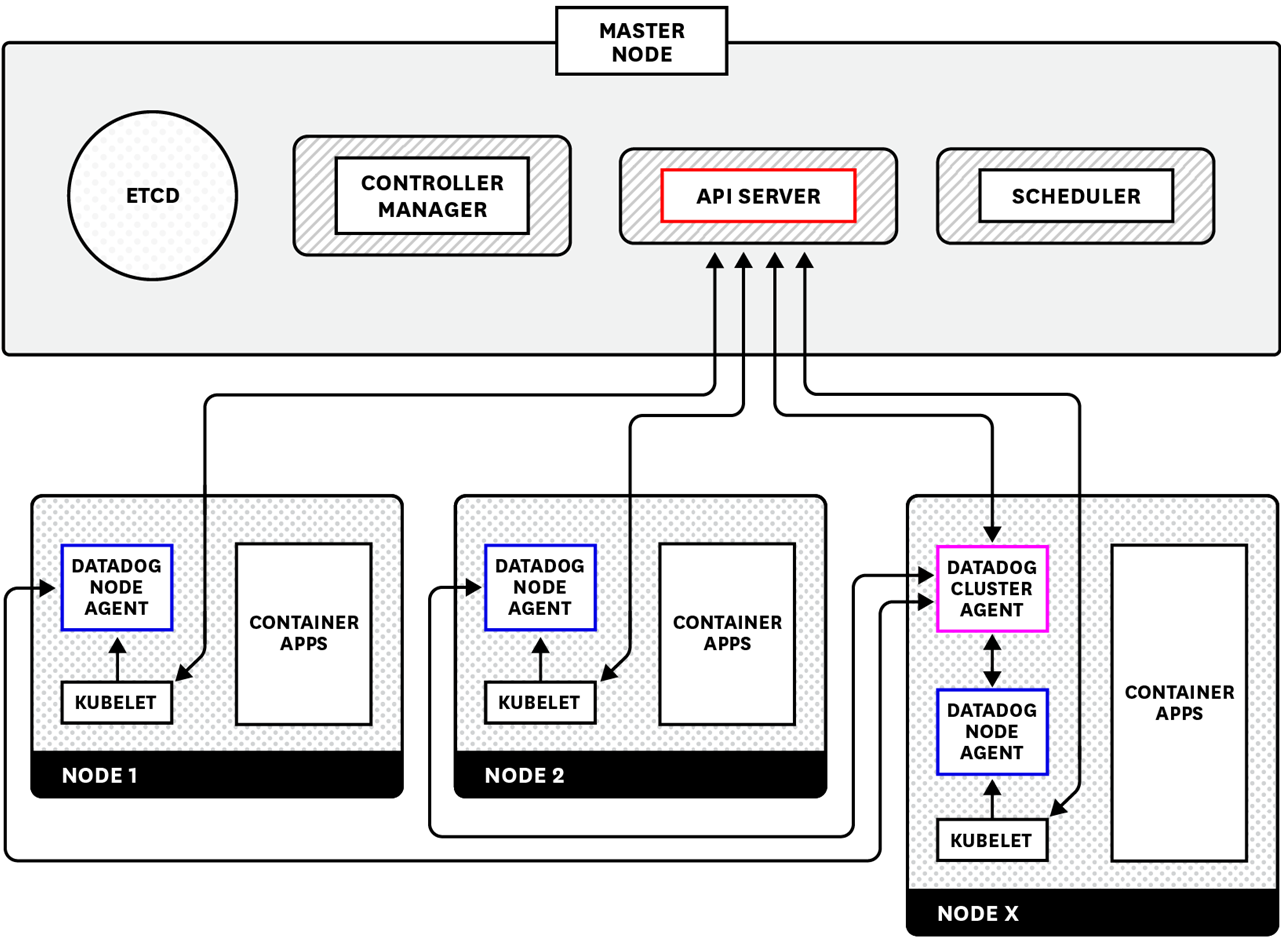
Figure 1 – The Cluster Agent streamlines communication between the Kubernetes API server and Node Agents in large Kubernetes clusters.
In addition to streamlining the gathering of data across an Amazon EKS cluster, the Cluster Agent is also capable of auto scaling Amazon EKS workloads based on any metric collected by Datadog.
In this capacity, the Cluster Agent serves as an external metrics provider, submitting custom metrics to Kubernetes’ Horizontal Pod Autoscaler (HPA), which will then scale up (or down) according to your instructions.
When using the HPA, you can use any metric regardless of origin, whether it’s from within your cluster, your application, or an external service like ELB.
You could automatically scale your web application based on the resource usage of your application pods, or based on metrics from outside the cluster, such as the request rate to your ELB instances. For a step-by-step walkthrough on auto scaling your Kubernetes workloads with any Datadog metric, check out this Datadog blog post.
At Datadog, we “dogfooded” the Cluster Agent before releasing it—essentially using it to monitor and scale our own Kubernetes environment. With the Cluster Agent, we were able to seamlessly scale from 100 to 1,000 nodes without putting unnecessary strain on the API server.
To deploy the Cluster Agent on all of your Amazon EKS clusters, follow the instructions in the documentation.
Container Map
Once the Datadog Agent is deployed across your Amazon EKS cluster, you can start visualizing the data from your cluster in Datadog.
Start with the Container Map feature, which provides a bird’s-eye view of your environment and allows you to sort thousands of containers with tags like availability zone, pod, or Amazon EC2 instance type.
The Container Map enables you to group and filter your containers by cloud provider, Availability Zone, or any other combination of tags. You can also color-code and size the map according to the real-time value of any metric collected from your containers, such as the average rate of I/O writes or CPU utilization.
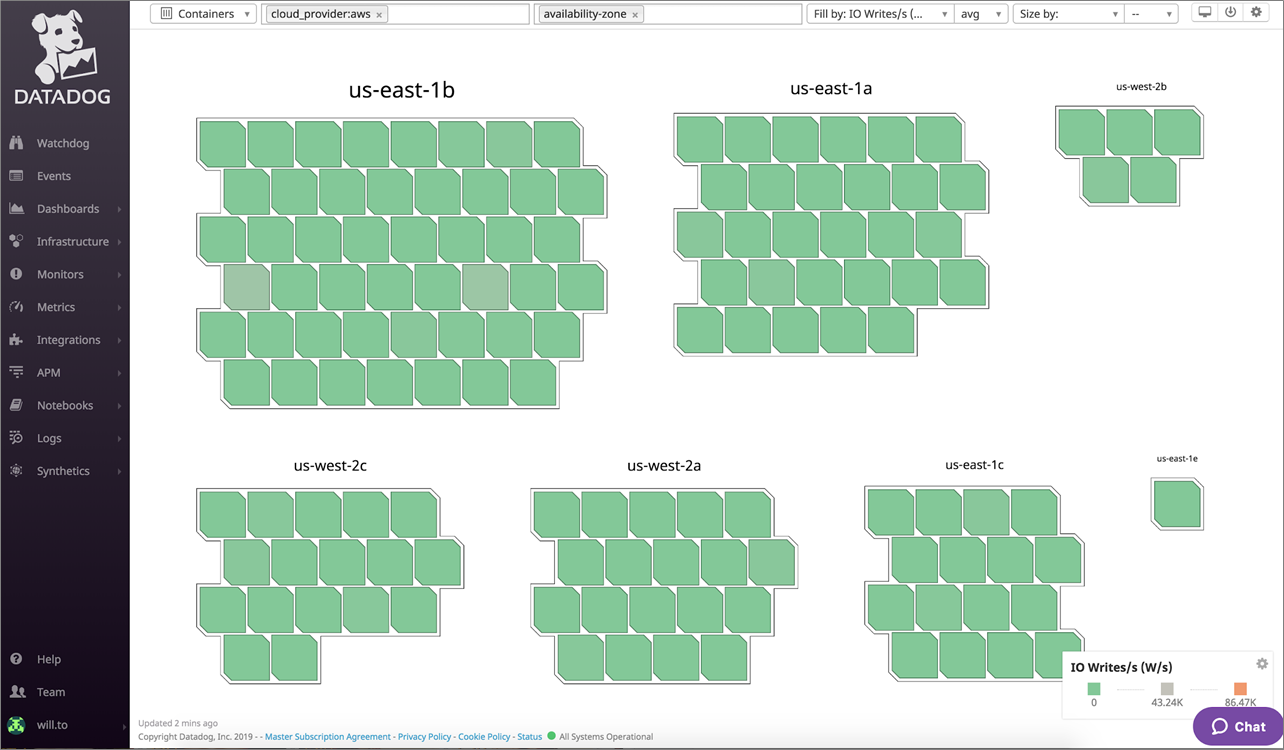
Figure 2 – Container Map enables you to group and filter your containers by cloud provider, Availability Zone, or tags.
The map is color-coded by CPU utilization (or any other metric you select), so you can identify hotspots in your infrastructure or services. This top-down visualization allows you to quickly isolate and investigate anomalous containers or pods, before pivoting to the Live Container view to dive into container-level metrics.
Live Container View
The Live Container view displays granular details on running processes and resource consumption of individual containers, with metrics reported at two-second intervals.
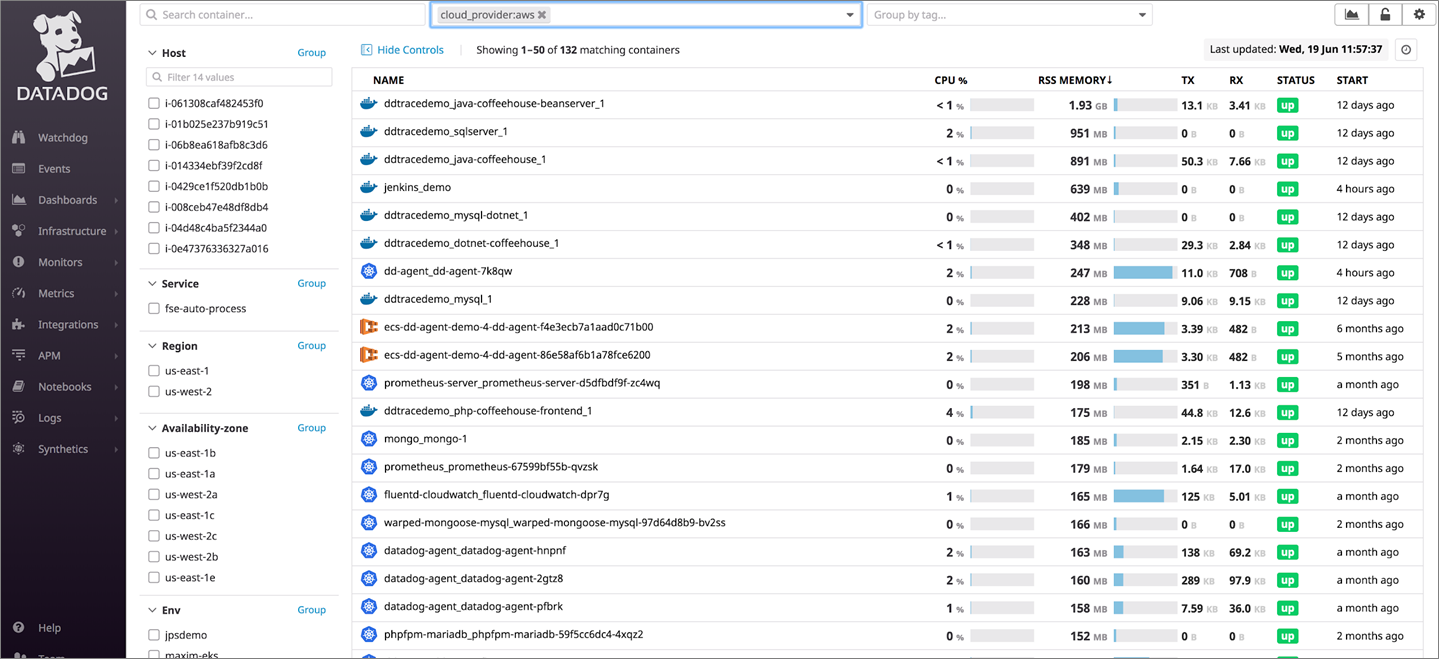
Figure 3 – Live Container view displays high-granularity metrics from all the containers running in your environment.
Datadog ingests all of your Amazon EKS tags, like Availability Zone, security group, and Amazon EC2 instance type, as well as Kubernetes metadata like pod name, deployment, and namespace.
You can use these tags in combination with text-based search to sort and filter your containers on the fly, drilling down to a specific segment of your infrastructure or isolating the containers from a particular workload.
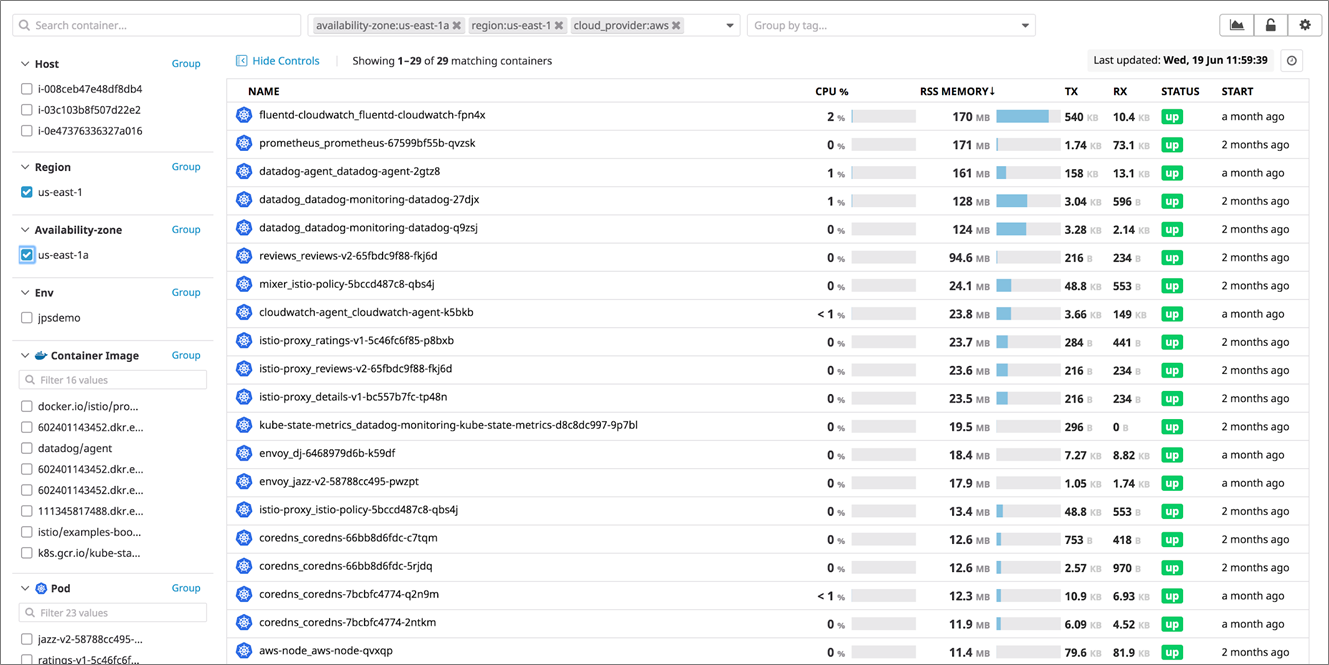
Figure 4 – Live Container lets you search for a subset of your container fleet, and then group and filter results by tags.
Once you’ve selected a specific container for investigation, you can drill into the associated logs and metrics, providing crucial, real-time context for troubleshooting efforts.
You can graph key resource metrics, such as container CPU utilization and RSS memory over time; view all the recent logs from a container; or use the Live Tail feed to watch new logs streaming in.

Figure 5 – Click on a specific container to inspect process-level metrics, logs, or traces.
It’s not always possible to diagnose problems solely with container-level metrics, however. For extra detail, you can visualize the metrics for each process running within an individual container. If CPU utilization is abnormally high for a certain container, for example, you can see which piece of software running in that container is causing the issue.
Visualizing Amazon EC2 Nodes
Datadog’s Kubernetes monitoring features help you track resource usage and identify potential bottlenecks at the level of pods and other Kubernetes abstractions.
To get visibility into the health and performance of the underlying nodes, you can enable Datadog’s AWS integration and start collecting data from all Amazon EC2 instances in your cluster. The AWS integration also enables you to collect data from supporting services like Amazon EBS and ELB.
For a step-by-step walkthrough on installing our AWS integration, see the documentation.
Once you configure the AWS integration, Datadog automatically pulls Amazon EC2 data directly from Amazon CloudWatch for visualization, alerting, and correlation.
Enabling the AWS integration involves three steps:
- Create a specialized read-only role in your AWS Identity and Access Management (IAM) console.
- Select the permissions you wish to grant to that role; Datadog provides template policies you can use or customize, depending on your needs.
- Configure your Datadog monitoring preferences and AWS credentials: input account and role details, add tags to hosts and metrics, and complete the installation, as shown in Figure 6.
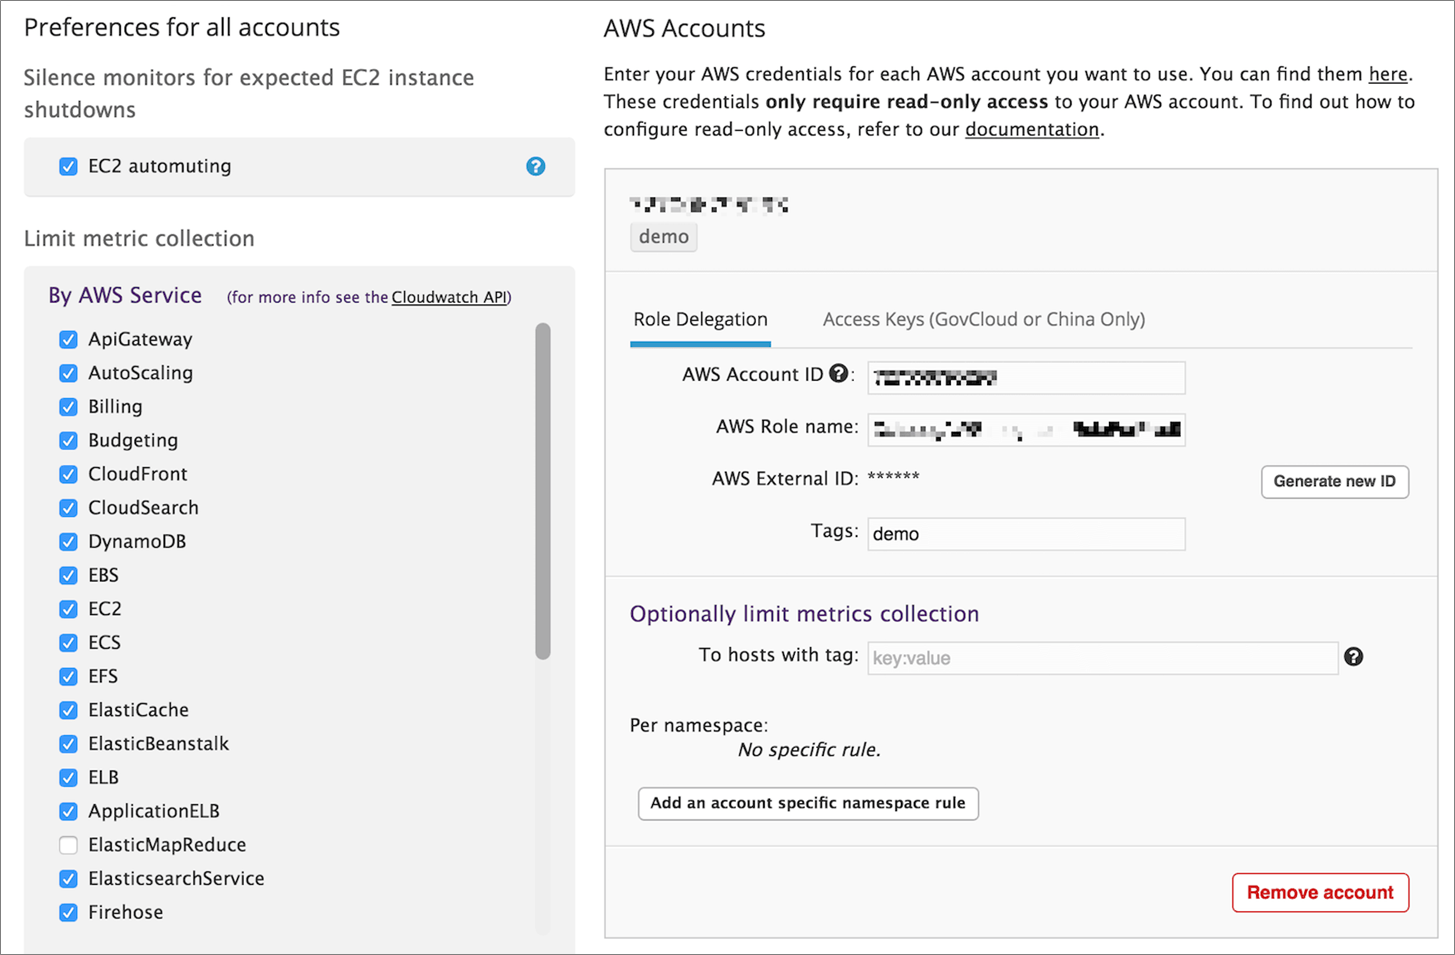
Figure 6 – When configuring Datadog’s AWS integration, you can select each service you want to monitor.
To learn more about Amazon EC2 monitoring, check out our three-part blog series.
Out-of-the-Box Dashboards
Datadog includes templated dashboards for visualizing your Kubernetes deployment, as well as for monitoring any other AWS infrastructure components that make up your cluster, like Amazon EC2 instances.
Datadog also provides targeted dashboards for monitoring specific Kubernetes components, such as the metrics server and the scheduler.
The Kubernetes Overview dashboard shown in Figure 7 provides a comprehensive visualization for important health and performance indicators. It displays several categories of key performance data, such as resource utilization, disk input/output, Kubernetes events, and an overview of deployments, DaemonSets, and other Kubernetes objects.
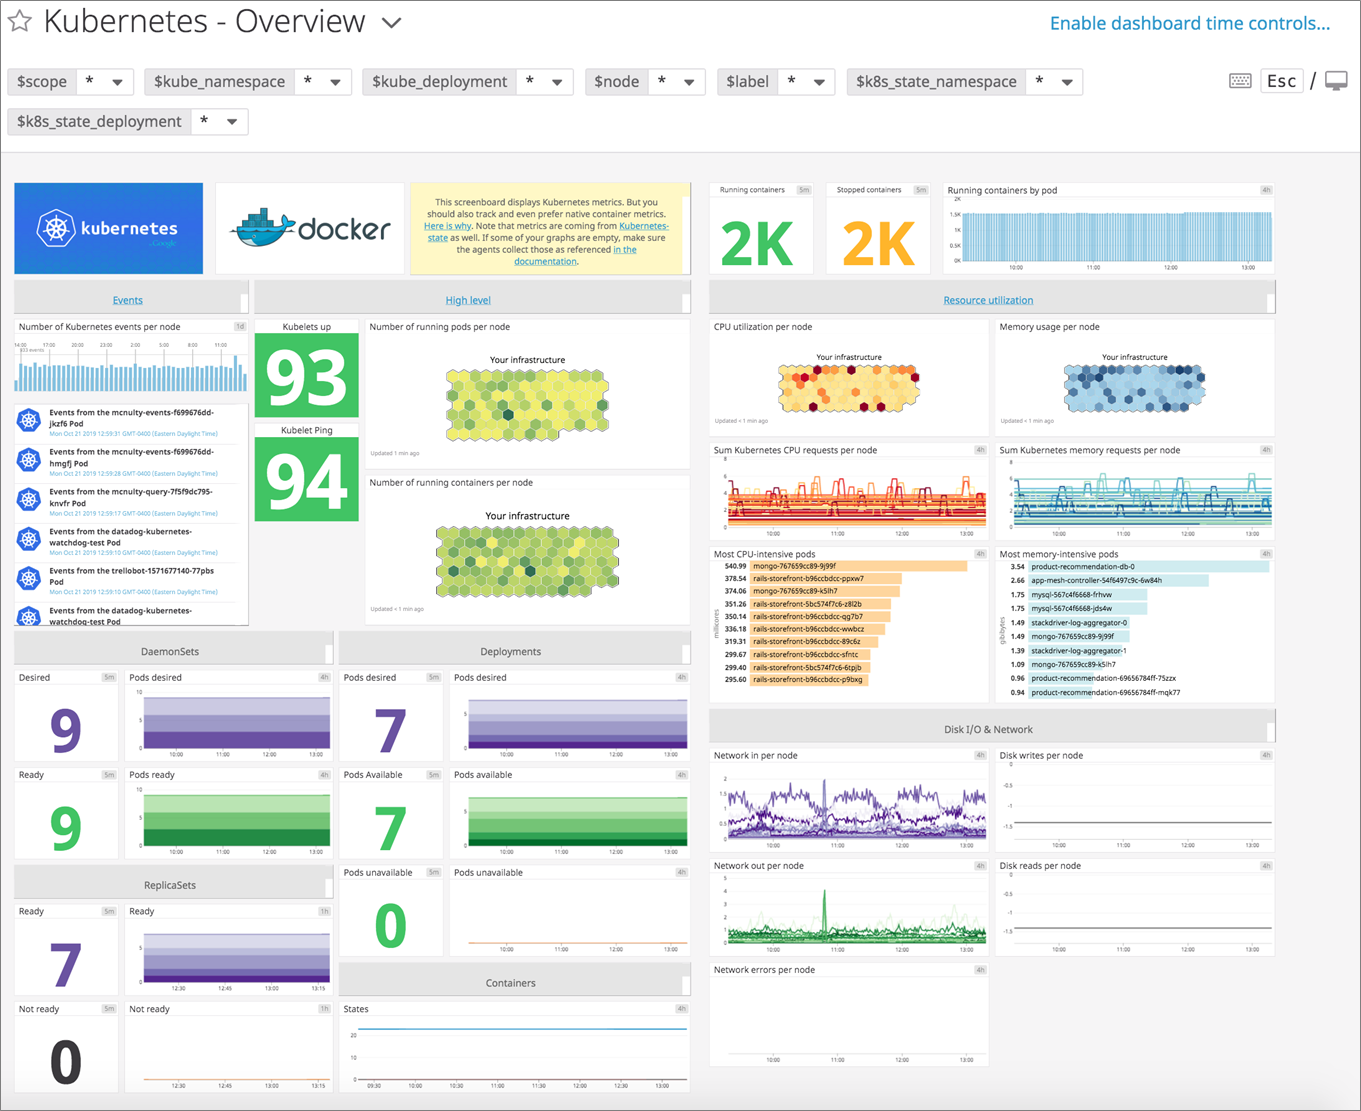
Figure 7 – The Kubernetes Overview dashboard provides immediate visibility into your infrastructure, without any additional setup.
Alternatively, you can build your own dashboards or clone and edit a template dashboard. To populate your own dashboard, simply use our drag-and-drop dashboard builder or copy and paste relevant widgets between dashboards.
For more information, take a look at the dashboard documentation.
Comprehensive Visibility into Your Amazon EKS Environment
Datadog integrates seamlessly with the underlying AWS and Kubernetes infrastructure of your Amazon EKS environment. By automatically collecting and aggregating data via Amazon CloudWatch and the Datadog Agent’s Autodiscovery functionality, the platform provides visibility into dynamic, dispersed containers and the applications within.
From there, key data is displayed in intuitive visualizations, such as the Container Map for a high-level picture of your Amazon EKS clusters, or the Live Container View that allows you to inspect the processes, metrics, and logs of individual containers.
Summary
By packaging microservices as discrete, portable units of code, containers allow organizations to quickly scale their environment in response to demand. However, because containers are so ephemeral by nature, they present significant challenges for conventional monitoring solutions, most of which are designed to deal with longer-lived hosts.
Datadog’s dynamic visualization features, such as the Live Container view and Container Map, enable you to quickly explore the real-time status of your entire container infrastructure in one pane of glass. Plus, there’s no need to learn a new query language; you can easily search, sort, and filter by tags like Availability Zone or pod name to get detailed insights into any subset of your environment.
With turn-key support for all AWS technologies and out-of-the-box template dashboards, Datadog provides deep visibility into your Amazon EKS environment in minutes. If you’re a current Datadog customer, see our documentation to learn more about monitoring your Amazon EKS clusters. You can also try Datadog with a free 14-day trial.
The content and opinions in this blog are those of the third party author and AWS is not responsible for the content or accuracy of this post.
.

.
Datadog – APN Partner Spotlight
Datadog is an AWS Container Competency Partner and monitoring service for cloud-scale applications. It brings together data from servers, databases, tools, and services to present a unified view of your entire stack.
Contact Datadog | Solution Overview | AWS Marketplace
*Already worked with Datadog? Rate this Partner
*To review an APN Partner, you must be an AWS customer that has worked with them directly on a project.